Betashares Australian ETF Review: July 2023

Ilan Israelstam
4 minutes reading time
Related articles
Better investing starts here
Get Betashares Direct
Betashares Direct is the new investing platform designed to help you build wealth, your way.
Scan the code to download.
Learn more
Learn more
November 2023 Review: The Australian ETF industry grew rapidly in the month of November driven by the ‘triple threat’ of large Unlisted-to-Active ETF conversions, asset value appreciation and strong net inflows
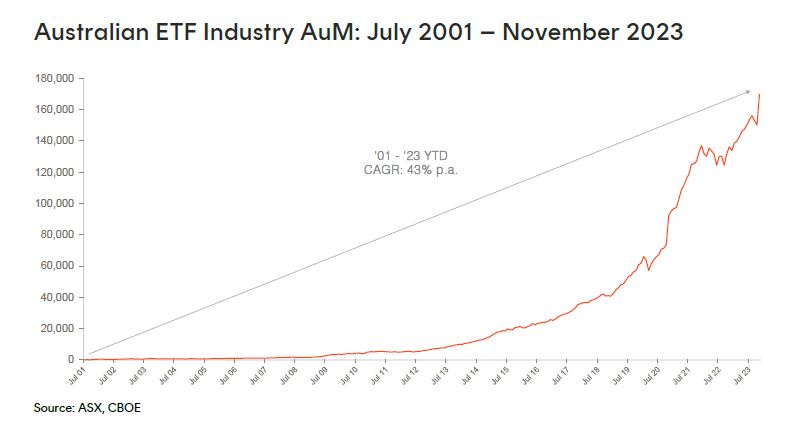
In a very significant month for the industry, assets grew 13.1% month-on-month, for a total monthly market cap increase of $19.6B, with the industry reaching a new all-time high of $169.7B
At least $10B (50%) of the growth this month came from conversions of existing unlisted active funds into Active ETFs as several new issuers joined the industry. Strong asset value appreciation, particularly in global equities exposures, and net inflows contributed the remainder of the growth.
Exchanged Traded Funds Market Cap
- Australian Exchange Traded Funds Market Cap (ASX + CBOE): $169.7B – New all-time high
- ASX CHESS Market Cap: $144.2B1
- Market Cap increase for month: 13.1%, $19.6B
- Market cap growth for last 12 months: 24.7%, $33.6B
New Money
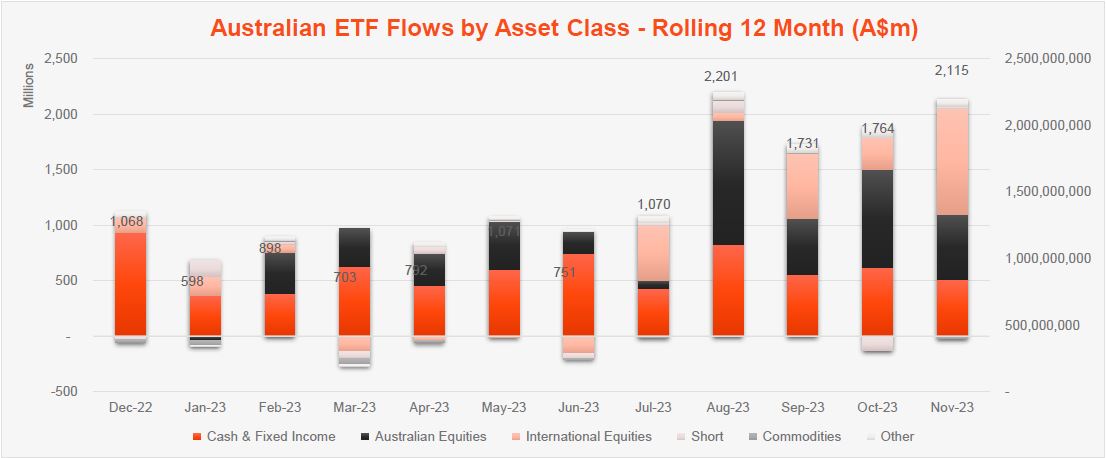
- Net inflows for month: $2.1B – 2nd highest net flows for 2023 to date
Products
- 364 Exchange Traded Products trading on the ASX & CBOE
- It was an exceedingly busy month in product development with more ETFs launched in November 2023 than in any month before. In total 15 new funds were launched, including an initial suite of Active ETFs from Dimensional and Macquarie Funds Group, who joined the Australian ETF industry. On the passive front, a new low-cost physical gold ETF was launched by iShares, and some additional currency-hedged products were launched by Van Eck. We launched an Australian first global cash-flow oriented product, Betashares Global Cash Flow Kings (ASX: CFLO) as well an income oriented Betashares Australian Cash Plus Fund (ASX: MMKT)
Trading Value
- Trading value rose by 7% in November, with ASX trading value of ~$11B for the month
Performance
- We saw growth-oriented global equity exposures outperform in November, with geared U.S. equities funds taking the top spot for performance (~24% monthly performance), followed by technology oriented thematics including Payments (17%) and Crypto Equities (16%).
Source: ASX, CBOE
Top category inflows (by $) – November 2023
| Broad Category | Inflow Value |
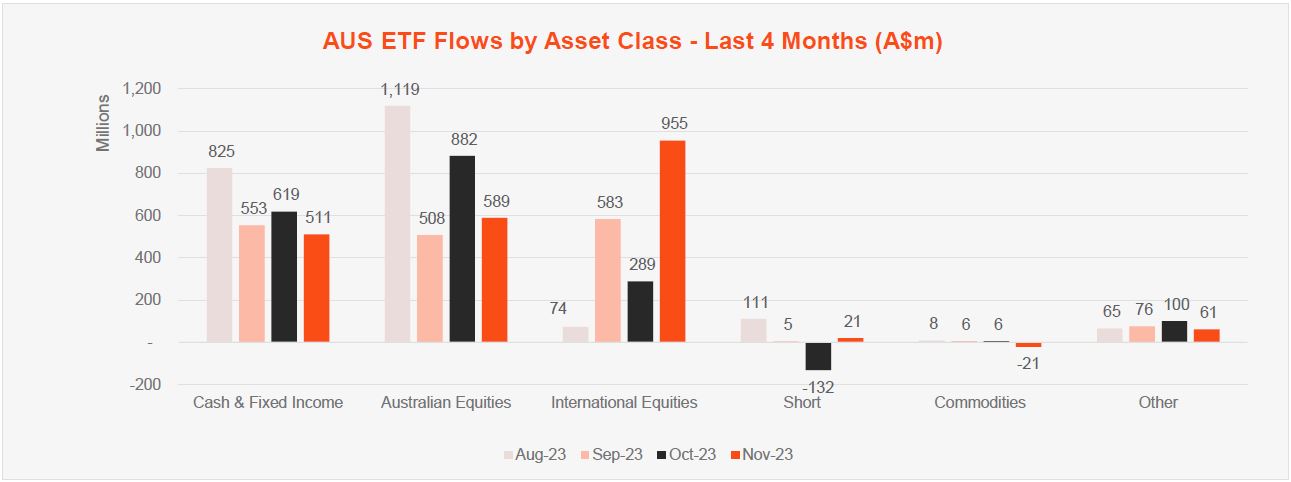
| International Equities | $955,112,779 |
| Australian Equities | $589,093,857 |
| Fixed Income | $408,421,387 |
| Cash | $102,141,200 |
| Listed Property | $49,001,966 |
Comment: In a meaningful departure from the trend observed throughout 2023, strong performance and reduced concerns over meaningful future interest rate rises led global equities exposures to be the most popular category for investors in November, with ~$955m of net inflows (45% of total net flows for the month). Australian Equities were the second most popular category recording ~$600m of net inflows.
Top sub-category inflows (by $) – November 2023
| Sub-category | Inflow Value |
| International Equities – Developed World | $568,923,892 |
| Australian Equities – Broad | $362,881,112 |
| International Equities – US | $315,488,506 |
| Global Bonds | $195,626,386 |
| Australian Bonds | $188,769,618 |
Source: ASX, CBOE
Top category outflows (by $) – November 2023
| Broad Category | Inflow Value |
| Commodities | ($21,346,802) |
| Currency | ($5,729,969) |
Top sub-category outflows (by $) – November 2023
| Sub-Category | Inflow Value |
| International Equities – Europe | ($50,032,864) |
| International Equities – E&R – Ethical | ($20,933,926) |
| Australian Equities – Short | ($18,852,660) |
| Gold | ($17,817,403) |
| Australian Equities – E&R – ESG Lite | ($12,120,715) |
*Past performance is not an indicator of future performance.
1. Since February 2023, the ASX started reporting additional data on a CHESS-only basis. The primary use of such data is that it excludes, amongst other things, the FuM and Flows in ‘dual class’ Active ETFs and potentially provide a more accurate picture of exchange traded activity.
MMKT
Australian Cash Plus Active ETF
keyboard_arrow_down
Earn attractive income, paid monthly, from cash and high-quality money market securities
CFLO
Global Cash Flow Kings ETF
keyboard_arrow_down
Invest in a portfolio of global companies that efficiently generate high levels of free cash flow.
Explore
ETF industry