3 minutes reading time
September 2022: INDUSTRY DECLINES IN VALUE AS SHAREMARKETS FALL, WHILE INFLOWS REMAIN POSITIVE
Positive inflows were not enough to combat sharemarket declines, causing the Australian ETF industry to decline in value in September. Read on for details, including best performers, asset flow categories and more.

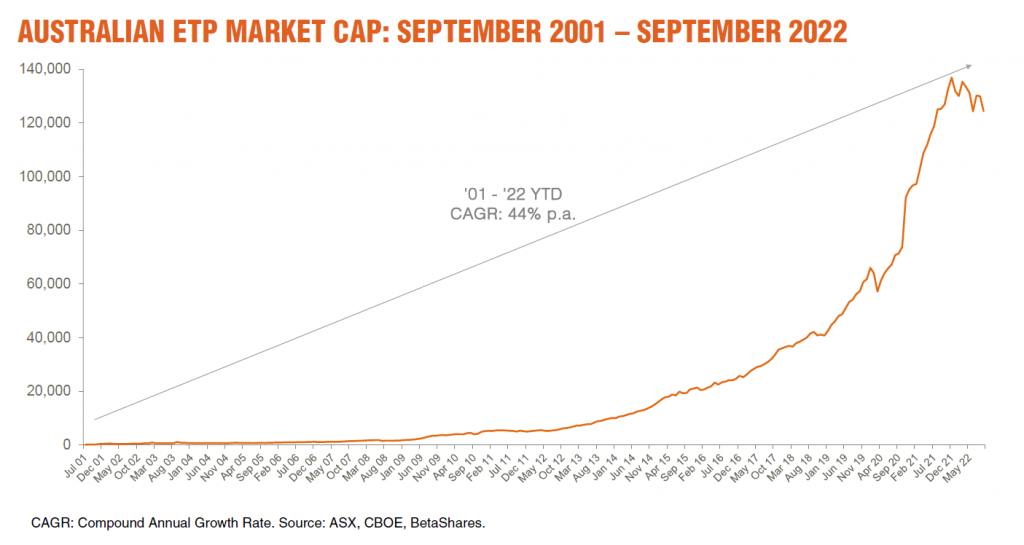
Market cap
- Australian Exchange Traded Funds Market Cap: $124.4B
- Market cap change for month: -4.3%, -$5.6B
- Market cap growth for the last 12 months: -0.7%, – $0.9B
Comment: Overall industry AuM fell 4.3% (-$5.6B) month on month, with total industry market capitalisation at $124.4B at end September.
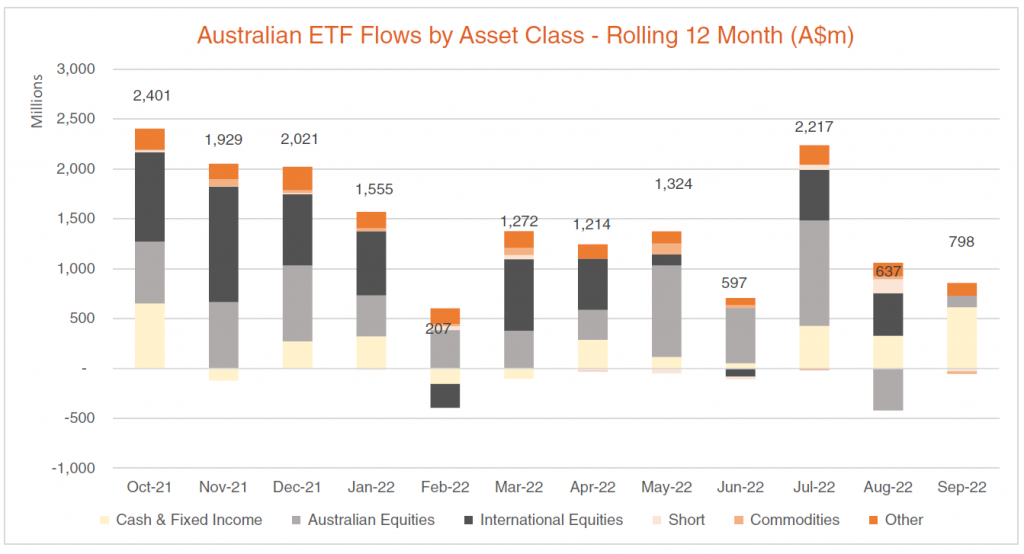
New money
- Net flows for month: +$0.8B
Comment: Notwithstanding significant global market volatility, industry flows remained positive, but as per last month, were muted – with $0.8B of net flows for the month.
Products
- 304 Exchange Traded Products trading on the ASX.
- 1 new product launched this month, being our Global Royalties ETF (ASX: ROYL). 1 single bond exposure matured.
Trading value
- ASX ETF trading value decreased 11% month on month, for a total of $9.1 billion.
Performance
- Given the significant falls recorded in global sharemarkets in September, the best performing funds were all leveraged short products, including BBUS and BBOZ (returning 23% and 15% respectively). Given continued strength in the US dollar, our Strong US Dollar Fund (ASX: YANK) also performed strongly.

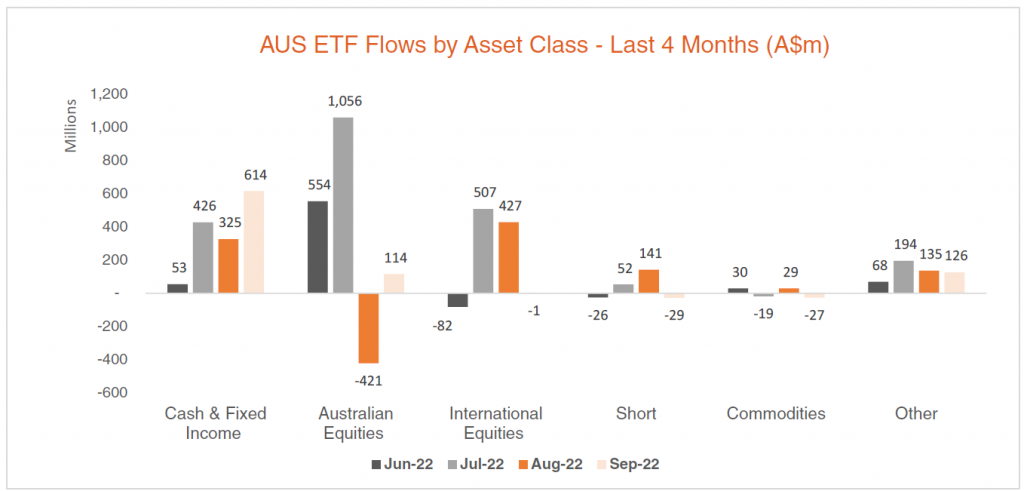
Top 5 category inflows (by $) – September 2022
| Category | Inflow Value |
| Fixed Income | $322,357,620 |
| Cash | $292,108,175 |
| Australian Equities | $114,216,091 |
| Multi-Asset | $62,225,784 |
| Listed Property | $49,604,101 |
Comment: Category flows were markedly different this month compared to the trend in the year to date, with Fixed Income & Cash ETFs receiving the lion’s share of industry flows – with over 50% of the industry’s monthly net inflows between them. With investors remaining cautious on equities, and yields continuing to rise, cash and floating-rate Australian bond exposures have seen the highest level of investor interest in September.
Top category outflows (by $) – September 2022
| Category | Inflow Value |
| Short | ($28,741,678) |
| Commodities | ($26,808,781) |
| International Equities | ($734,925) |
Comment: Net outflows were recorded in short exposures as investors sought to take advantage of the falling markets and take profits in these positions.

Source: Bloomberg, BetaShares.
Top sub-category inflows (by $) – September 2022
| Sub-category | Inflow Value |
| Cash | $292,108,175 |
| Australian Bonds | $285,286,661 |
| International Equities – US | $87,796,170 |
| Australian Equities – High Yield | $85,163,217 |
| Multi-Asset | $62,225,784 |
Top sub-category outflows (by $) – September 2022
| Sub-category | Inflow Value |
| International Equities – Developed World | ($109,115,854) |
| Australian Equities – Short | ($43,689,580) |
| Australian Equities – Broad | ($37,645,357) |
| Gold | ($32,983,751) |
| International Equities – Europe | ($21,670,447) |
