

Tom Wickenden
8 minutes reading time
Many investors, even those seeking high income portfolios, often rely on Australian equity and fixed income allocations for yield, leaving international equities for growth.
In our view, this is due to two key issues:
- Traditional global equity income strategies have significantly underperformed global benchmarks over the past decade due to their high allocations to low growth stocks, sectors, and regions.
- By selecting companies based on maximising their yield characteristics alone, investors can become susceptible to dividend traps.
Betashares have partnered with S&P’s flagship Dividend Aristocrat range to overcome these shortcomings for investor by launching a new global income strategy with the Betashares S&P Global High Dividend Aristocrats ETF (ASX: INCM).
Introducing the global dividend aristocrats
At the core of the Global Dividend Aristocrat methodology is the simple but meaningful requirement for eligible companies to have either maintained or increased dividends each year for 10 consecutive years.
Companies that consistently grow dividends are often signalling confidence in their future cash flows and operational strength. A long track record of uninterrupted dividends, particularly through times of earnings stress or economic downturns, reflects management’s commitment to shareholders and the underlying financial quality of the business. Investors often view such consistency as a sign of corporate maturity, capital discipline, and balance sheet strength.
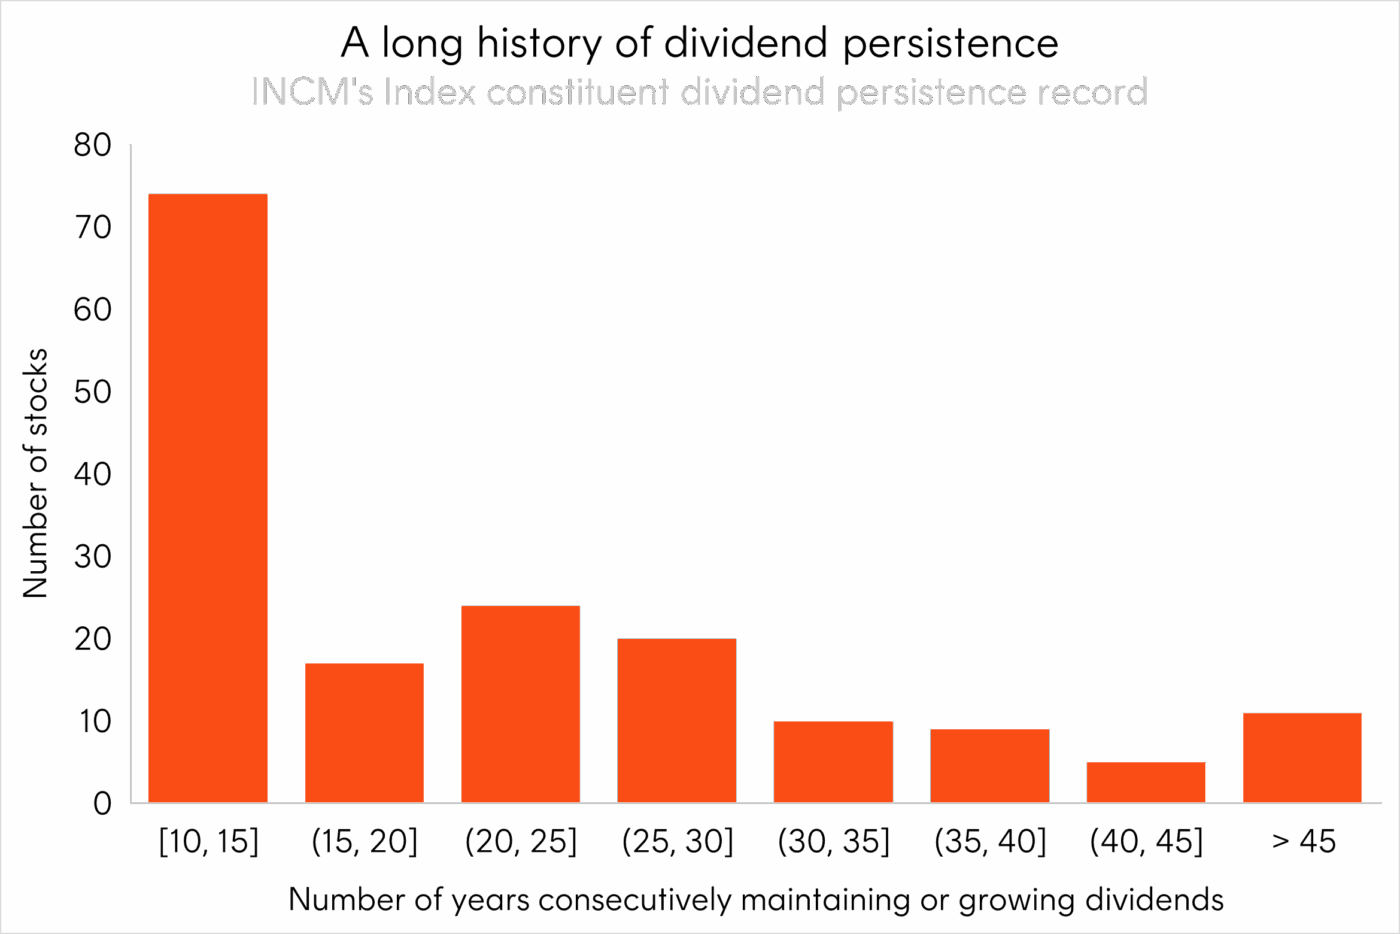
Source: S&P, Bloomberg. As at 31 July 2025.
By not limiting itself to purely selecting the highest yielding companies, which are often in low growth sectors of the market, INCM’s Index is designed to provide investors with a return profile that captures both income and growth potential.
For example, BAE Systems (LON: BA), a global defence and aerospace leader, has delivered strong earnings growth of 8.3% p.a. over the past five years, supporting consistent dividend growth of 6.85% p.a. and over the longer term boasts a 20-year dividend growth streak1. Similarly, The Coca-Cola Company (NYSE: KO) has increased its dividend for 61 consecutive years. Backed by strong brand equity and a globally diversified product base, Coca-Cola has delivered earnings growth of 6.9% p.a. and an average dividend yield of 3.0% over the past five years2.
To further seek companies with high quality income characteristics, and to avoid dividend traps, the Index methodology requires companies to have had a non-negative dividend payout ratio for the past 10 years (i.e. 10 years of positive earnings) and a maximum of 10% forecast dividend yield.
Capturing global growth
With a universe of eligible dividend aristocrats, INCM’s index then looks to improve on the shortcomings of many existing global income indices in historically failing to capture the growth in international equity market returns.
To overcome significant sector and region deviations, INCM’s Index groups eligible dividend aristocrats into three related regional groups and four related sector groups3, matching the weights of these groups at each rebalance to a broad global benchmark4.
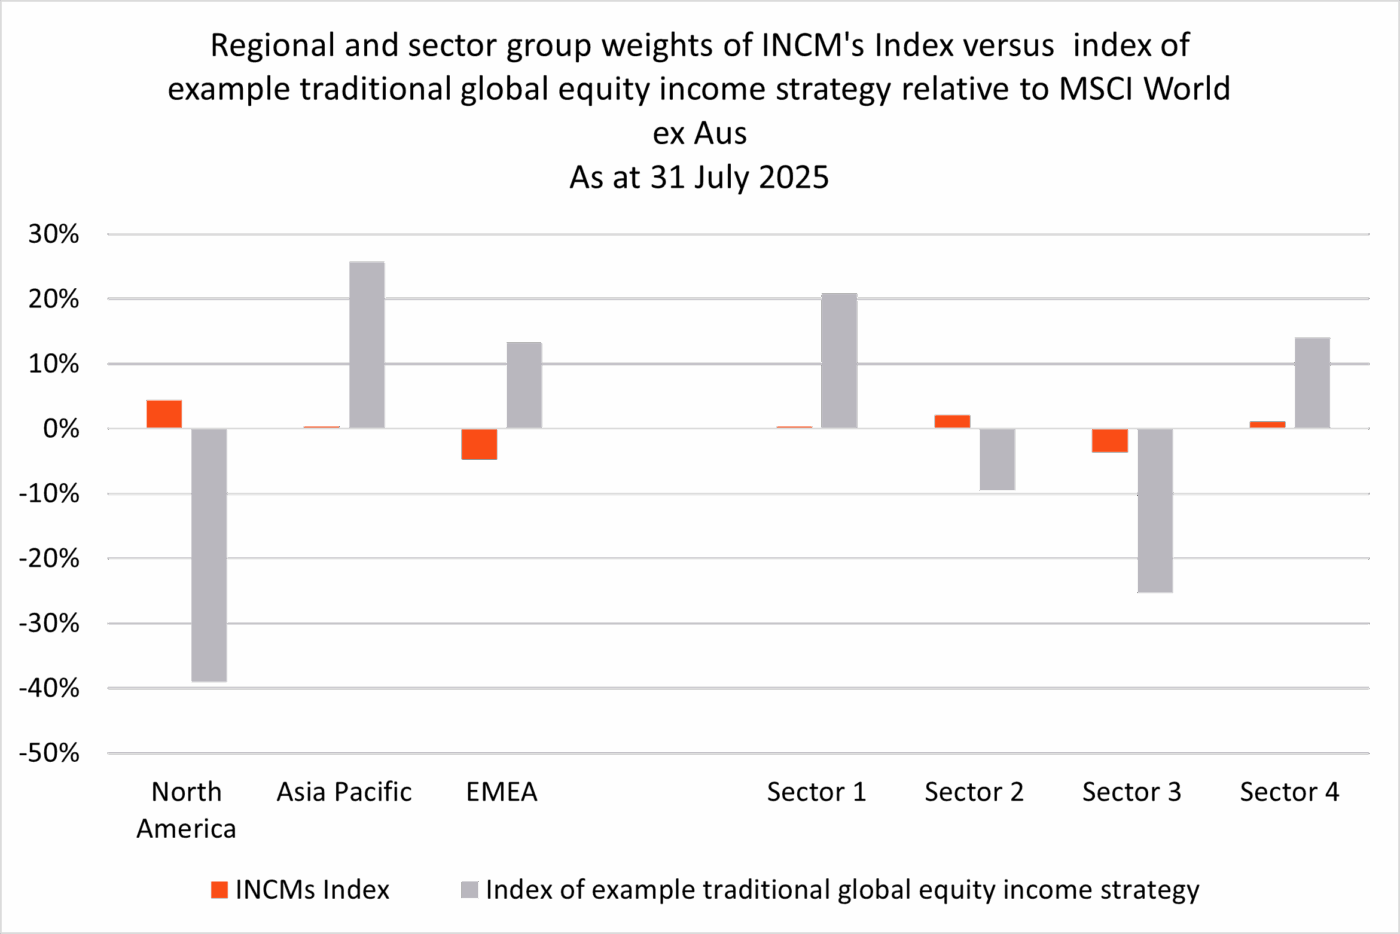
Source: Bloomberg. As at 31 July 2025. INCM’s Index is the S&P World Ex-Australia High Yield Dividend Aristocrats Select Index. Example traditional global equity income index is used for illustrative purposes only to show typical sector and regional active positions and returns of unconstrained global equity income indices. Regional groups: North America, Asia Pacific, and Europe, the Middle East and Africa. Sector groups: 1 – Financial and Real Estate, 2 – Consumer and Healthcare, 3 – Technology and communications, and 4 – Industrials, Materials, Energy, and Utilities.
In doing so, INCM’s Index avoids taking significant active positions by related sector or region. For example, INCM’s index would have avoided the heavy overweight in Real Estate and utilities and corresponding underweights in Technology-related sectors in the US, due to their relative income profiles over the past decade.
These active weights can be typical of traditional income indices and have led many to significant underperformance versus broad global benchmarks. For instance, the index in the example below has lagged the MSCI World ex Australia Index by 122% over the past 10 years with analysis showing that just over half was due to active sector and regional weights.
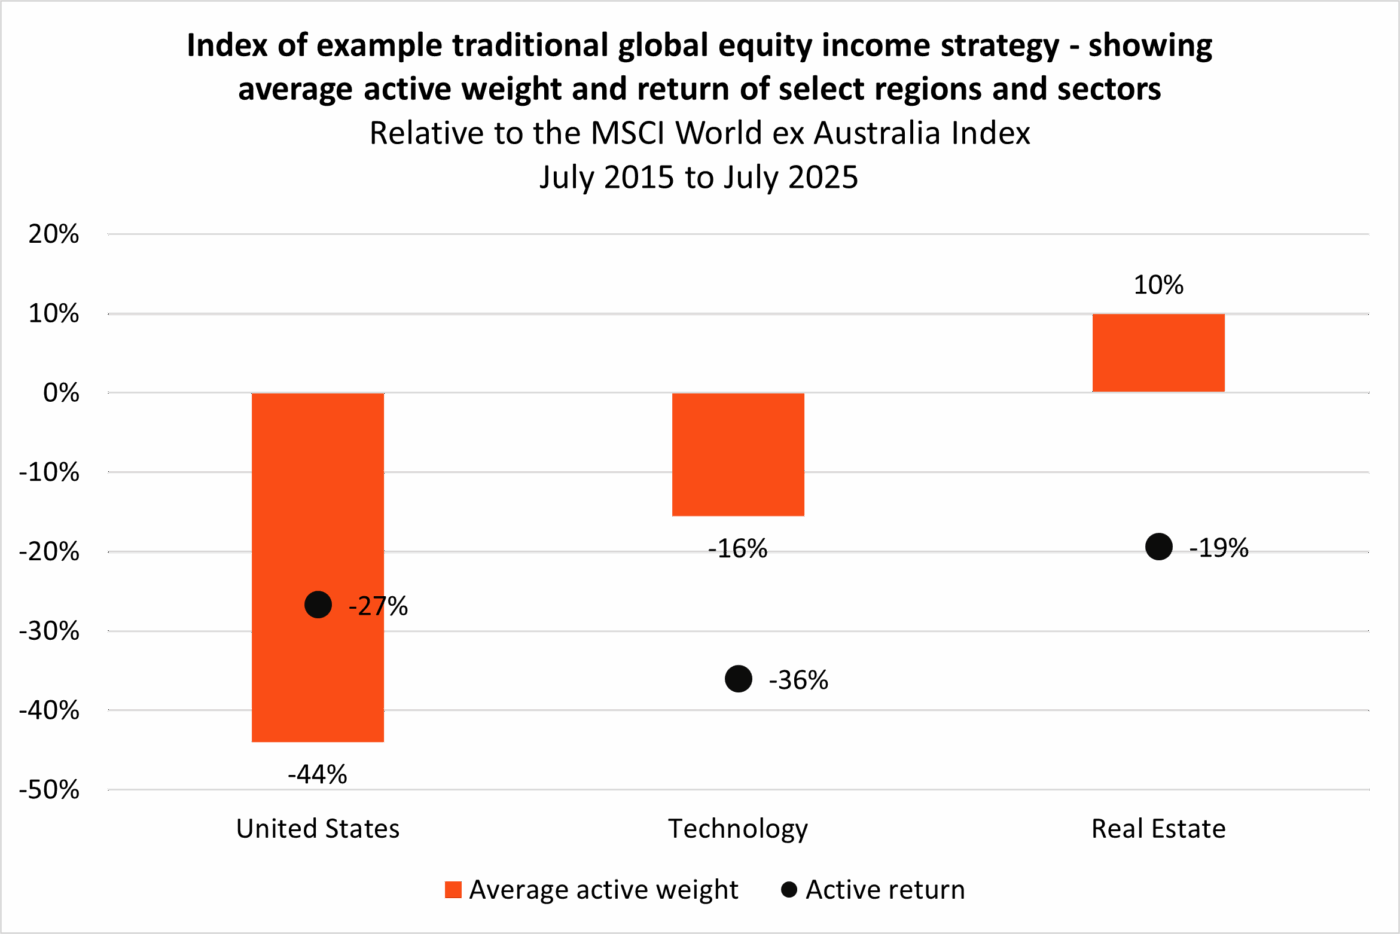
Source: Morningstar Direct. July 2015 to July 2025. index of example traditional global equity income strategy is used for illustrative purposes only to show typical sector and regional active positions and returns of unconstrained global equity income indices. Past performance is not indicative of future performance of any index or ETF.
A better balance between income and growth
INCM’s index has historically displayed the defensive characteristics one would expect from a high yield strategy. Since common inception (31 January 2019), compared to the MSCI World ex Australia Index the Index has had lower volatility, lower drawdowns in both 2020 and 2022, and a beta of 0.835.
While not participating in the full upside of the market, which has been largely driven by a small number of mega-cap US technology stocks over the period, INCM has protected on the downside achieving a capture ratio of 1.16 (upside capture divided by downside capture).
Over the same period, compared to the index of an example traditional global equity income strategy, INCM’s Index has achieved higher total returns with almost half of the tracking error to the broader market.
|
31 Jan 19 to 30 Jun 25 |
Index of example global equity income strategy |
INCM’s Index |
MSCI World ex Aus Index |
|
Total return (p.a.) |
7.53% |
12.46% |
15.08% |
|
Volatility (p.a.) |
12.95% |
14.69% |
16.48% |
|
Excess Return (p.a.) |
-7.55% |
-2.62% |
|
|
Tracking Error |
11.39% |
5.97% |
|
|
Beta (ex-post) |
0.57 |
0.83 |
|
|
Sharpe Ratio |
0.38 |
0.67 |
0.76 |
|
Max Drawdown |
-33.29% |
-22.13% |
-23.71% |
|
Upside Capture |
0.55 |
0.78 |
|
|
Downside Capture |
0.55 |
0.70 |
|
|
Capture Ratio |
1.00 |
1.11 |
Source: S&P, Bloomberg, Betashares. 31 Jan 2019 to 30 June 2025. For the Sharpe ratio a compounded risk-free rate of 2.63% was used. INCM’s index is the S&P World Ex-Australia High Yield Dividend Aristocrats Select Index. Does not take into account INCM’s management fees of 0.39% p.a. Index of example global equity income strategy used for illustrative purposes only to show typical returns of unconstrained global equity income indices. You cannot invest directly in an index. Past performance is not an indicator of future performance any index or ETF.
This historical performance of INCM’s Index against traditional unconstrained global equity income indices highlights its more considered approach to balancing income and capturing the growth of market returns.
And while INCM’s Index has not outperformed the MSCI World ex Australia in absolute terms – very few funds have over this period – its balance between income, growth and defensive qualities have led to comparable risk adjusted return profile since index inception.
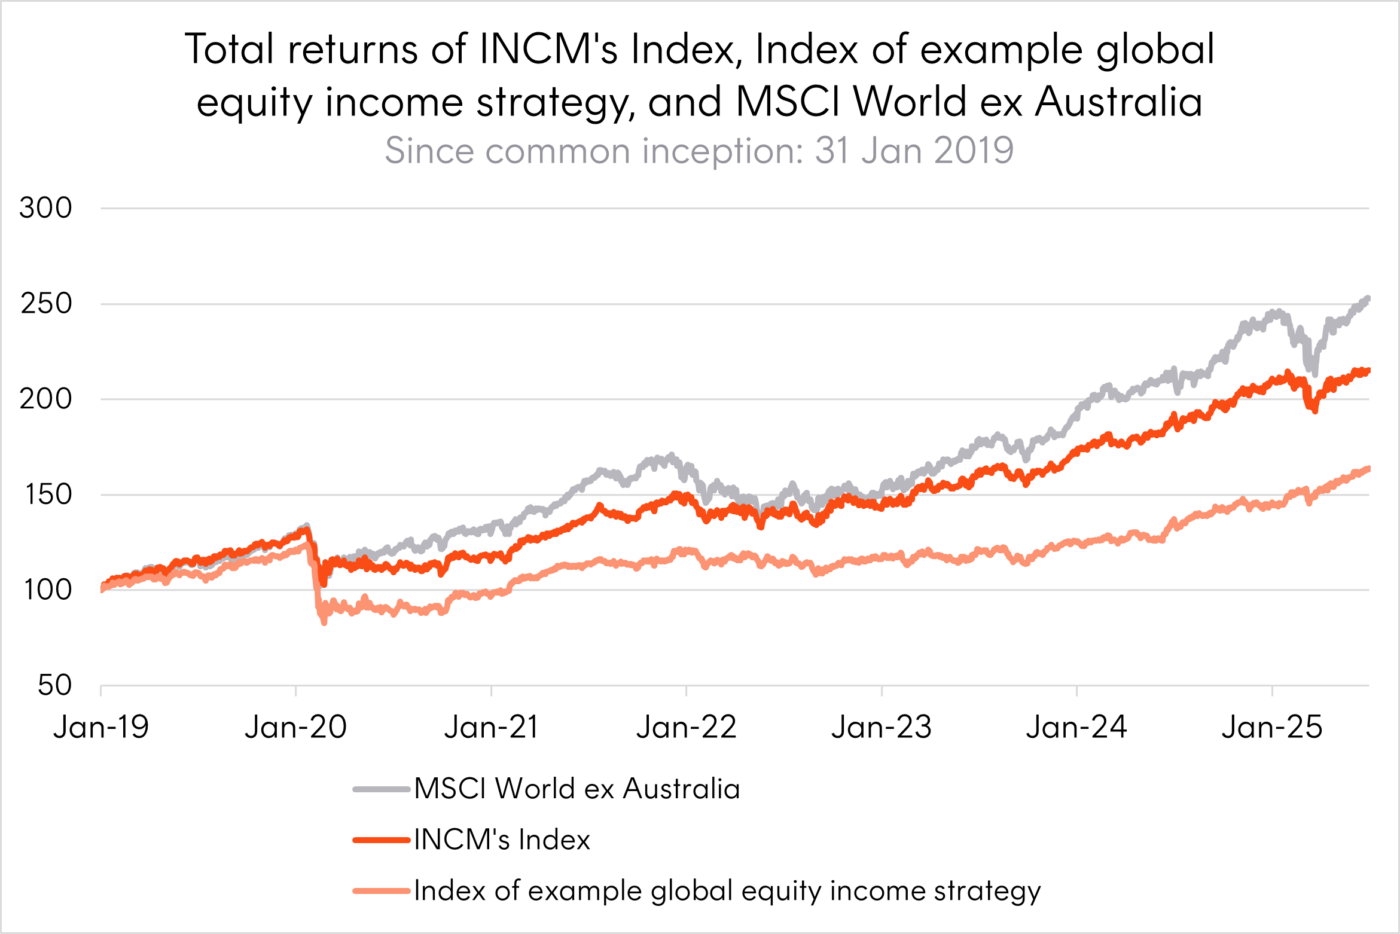
Source: Bloomberg. 31 January 2019 to 30 July 2025. Depicts index performance and does not include INCM’s management fees of 0.39% p.a. INCM’s Index is the S&P World Ex-Australia High Dividend Aristocrats Select Index. Index of example global equity income strategy used for illustrative purposes only to show returns of unconstrained global equity income indices. You cannot invest directly in an index. Past performance is not an indicator of future performance any index or ETF.
Crucially, INCM’s index has achieved these return attributes with, on average, an index yield 60% higher than the MSCI World ex Australia. While this may not be as high as some traditional global equity income strategies, it may be considered a reasonable offset to achieve the other desirable properties of INCM’s return profile.
Investment implications
International equity income allocations have been a pain point for investors, often leaving them to either ignore the income potential from this sizeable part of their portfolios or suffer underperformance against broad global benchmarks.
INCM now offers an alternative with the potential for high income and growth within international equities making it potentially appealing for:
- Investors looking to increase overall portfolio income, backed by an intuitive company selection approach
- Allocators seeking a benchmark aware building block for international equity income models
- Investors seeking defensive global equity exposure without sacrificing diversification, while balancing upside potential.
Within each of these applications INCM’s intuitive approach should both be easy for investors to understand and lead to more reliable return outcomes relative to broad global benchmarks.
For more information on INCM please visit its fund page here.
There are risks associated with an investment in INCM, including market risk, security specific risk, small and medium sized companies risk, industry sector risk and index tracking risk. Investment value can go up and down. An investment in the Fund should only be considered as a part of a broader portfolio, taking into account your particular circumstances, including your tolerance for risk. For more information on risks and other features of the Fund, please see the Product Disclosure Statement and Target Market Determination, both available on this website.
Sources:
1. Source: Bloomberg. As at 30 June 2025. ↑
2. Source: Bloomberg. As at 30 June 2025. ↑
3. Regional groups: North America, Asia Pacific, and Europe, the Middle East and Africa. Sector groups: Financial and Real Estate, Consumer and Healthcare, Technology and communications, and Industrials, Materials, Energy, and Utilities. ↑
4. Broad global benchmark is the S&P Developed BMI Index ex Aus and SK ↑
5. Source: S&P, Betashares. As at 31 January 2019 to 31 July 2025. Past performance is not an indicator of future performance. ↑
6. Source: S&P, Betashares. As at 31 January 2019 to 31 July 2025. Past performance is not an indicator of future performance. ↑