

Luke Sheather
7 minutes reading time
This information is for the use of licensed financial advisers and other wholesale clients only.
One of the central pillars of modern financial analysis dictates that an asset’s value is represented by the present value of all future cash flows.
Despite this, many investors still focus primarily on reported earnings or profit as the key consideration for stock selection. As we’ll discuss in this article, however, a strategy focused on cash flow has the potential to deliver outperformance, and can also provide resilience in periods of economic stress.
With this in mind, Betashares has just launched the CFLO Global Cash Flow Kings ETF . The Fund seeks to track an index comprising a globally diversified portfolio of companies that demonstrate strong free cash flow with relatively low levels of financial leverage.
Why should investors focus on cash flows?
A company’s profit, or its reported earnings, is a by-product of several assumptions and choices made by management. ‘Earnings management’ is the term used to describe the ability of companies to interpret accounting principles, or use accounting policies in a way that allows them to present their financial statements in a more favourable light.
This raises the question of how investors can make informed decisions and comparisons when companies employ different policies, estimates and judgement in producing financial accounts. History has provided us with a number of examples where aggressive displays of earnings management have led to misleading or fabricated financial results – for example Enron, Worldcom, Freddie Mac.
Cash flow, on the other hand, provides a more reliable and unbiased measure of performance and financial health. Other advantages of an investment strategy focusing on cash flow include:
- Solvency – Companies that generate strong cash flows are better placed to service debt obligations.
- Well placed for growth – Companies that can generate more cash flow than they require to run their business are better equipped to participate in profitable growth opportunities.
- Self-sufficiency – Companies generating high levels of cash flow are less reliant on capital markets for additional funding, and therefore less likely to engage in shareholder-dilutive events.
While various measures of cash flows can be used, one particular metric has been an integral part of financial analysis, corporate valuation, and investment decision-making in the modern financial world – Free Cash Flow.
What is Free Cash Flow?
Free Cash Flow (FCF) is simply the cash a company generates from its business operations after also considering working capital needs and capital expenditures. It is an important metric for investors, analysts and creditors, since it represents the cash available to:
- pay dividends
- buy back shares
- pay off debt, or
- fund further investments.
Positive FCF indicates a company is generating more cash than it needs to run and maintain the business, and so provides greater insight than purely profit or cash from operations.
Introducing Betashares Global Cash Flow Kings ETF (ASX: CFLO)
CFLO aims to track an index, before fees and expenses, that has been designed to target companies that demonstrate strong and consistent FCF generation, with emphasis placed on companies that are growing FCF in an efficient manner, that is, without taking on excessive debt.
CFLO’s index selects the top 200 global companies as determined by their FCF composite score. On rebalance, the index will have the same sector weights as the developed market universe (sector neutral) and country weights will also be within +/- 10% of the universe1.
You can invest in CFLO on the ASX at a management fee of 0.40% p.a.[2] or just $40/year for every $10,000 invested.
CFLO provides:
1. Outperformance potential: The chart below demonstrates the outperformance of CFLO’s index since inception for the period ending 31 October 2023, 9.5% p.a. compared to 7.2% p.a. for broad global shares, as measured by the MSCI World Index NR (AUD).
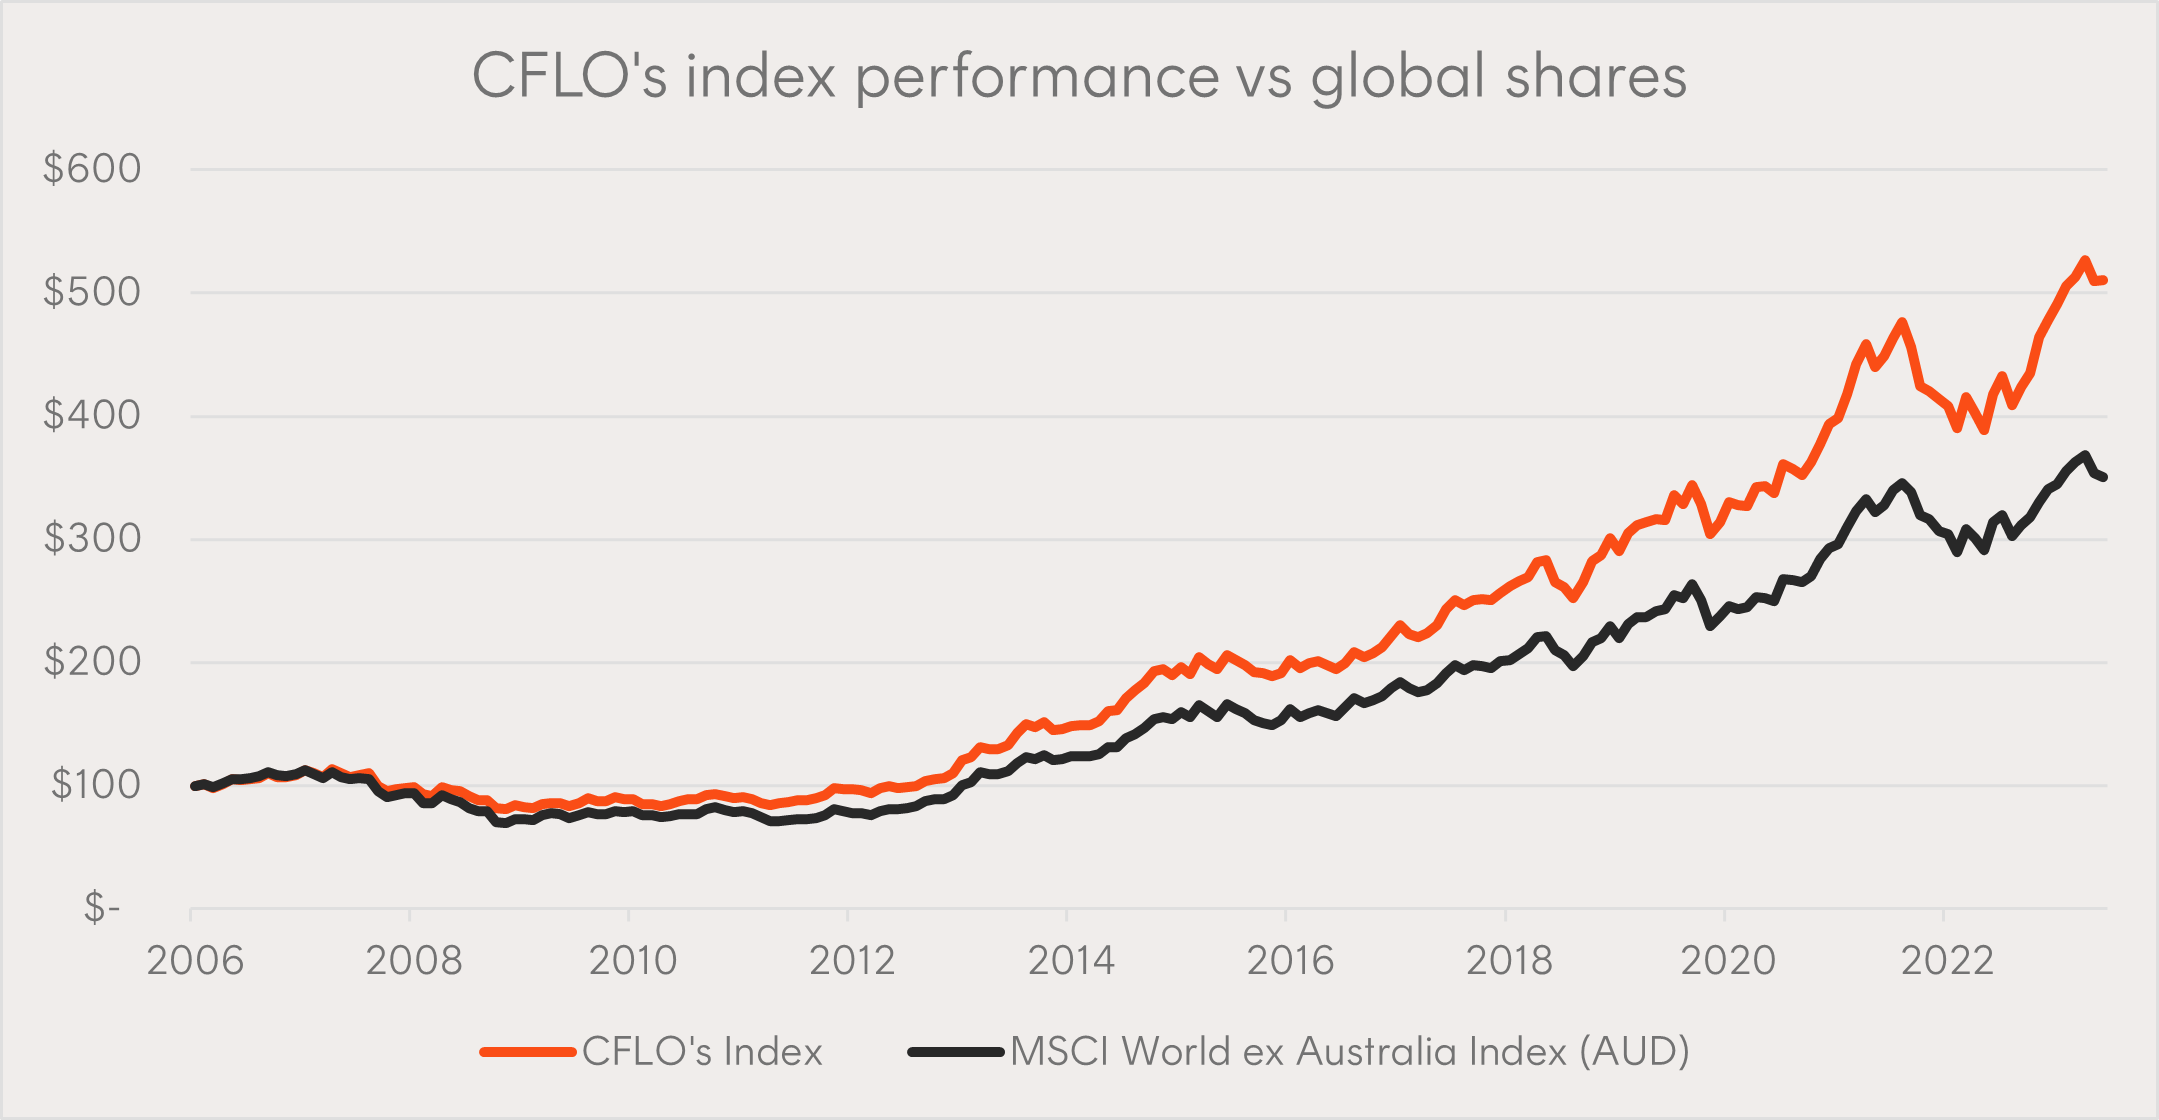
Source: Bloomberg. Data as of 31 October 2023. Return, volatility and max drawdown figures for the period since common inception on 8 May 2006 until 31 October 2023. Chart shows Index performance (not actual fund performance) to illustrate the longer-term historical performance of global companies that demonstrate strong free cash flow. Doesn’t take into account ETF fees and expenses of 0.40% p.a. You cannot invest directly in an Index. Past performance is not an indicator of future performance.
2. Robust historical performance over the market cycle: As well as historical outperformance over the time period since inception, CFLO’s index has been consistent over shorter periods, outperforming in 13 of the 17 calendar years since inception. In years of underperformance, the performance gap has generally been small (average of -1.5%). Crucially, CFLO’s index has outperformed in all bar one year when the MSCI World Index NR (AUD) was negative.
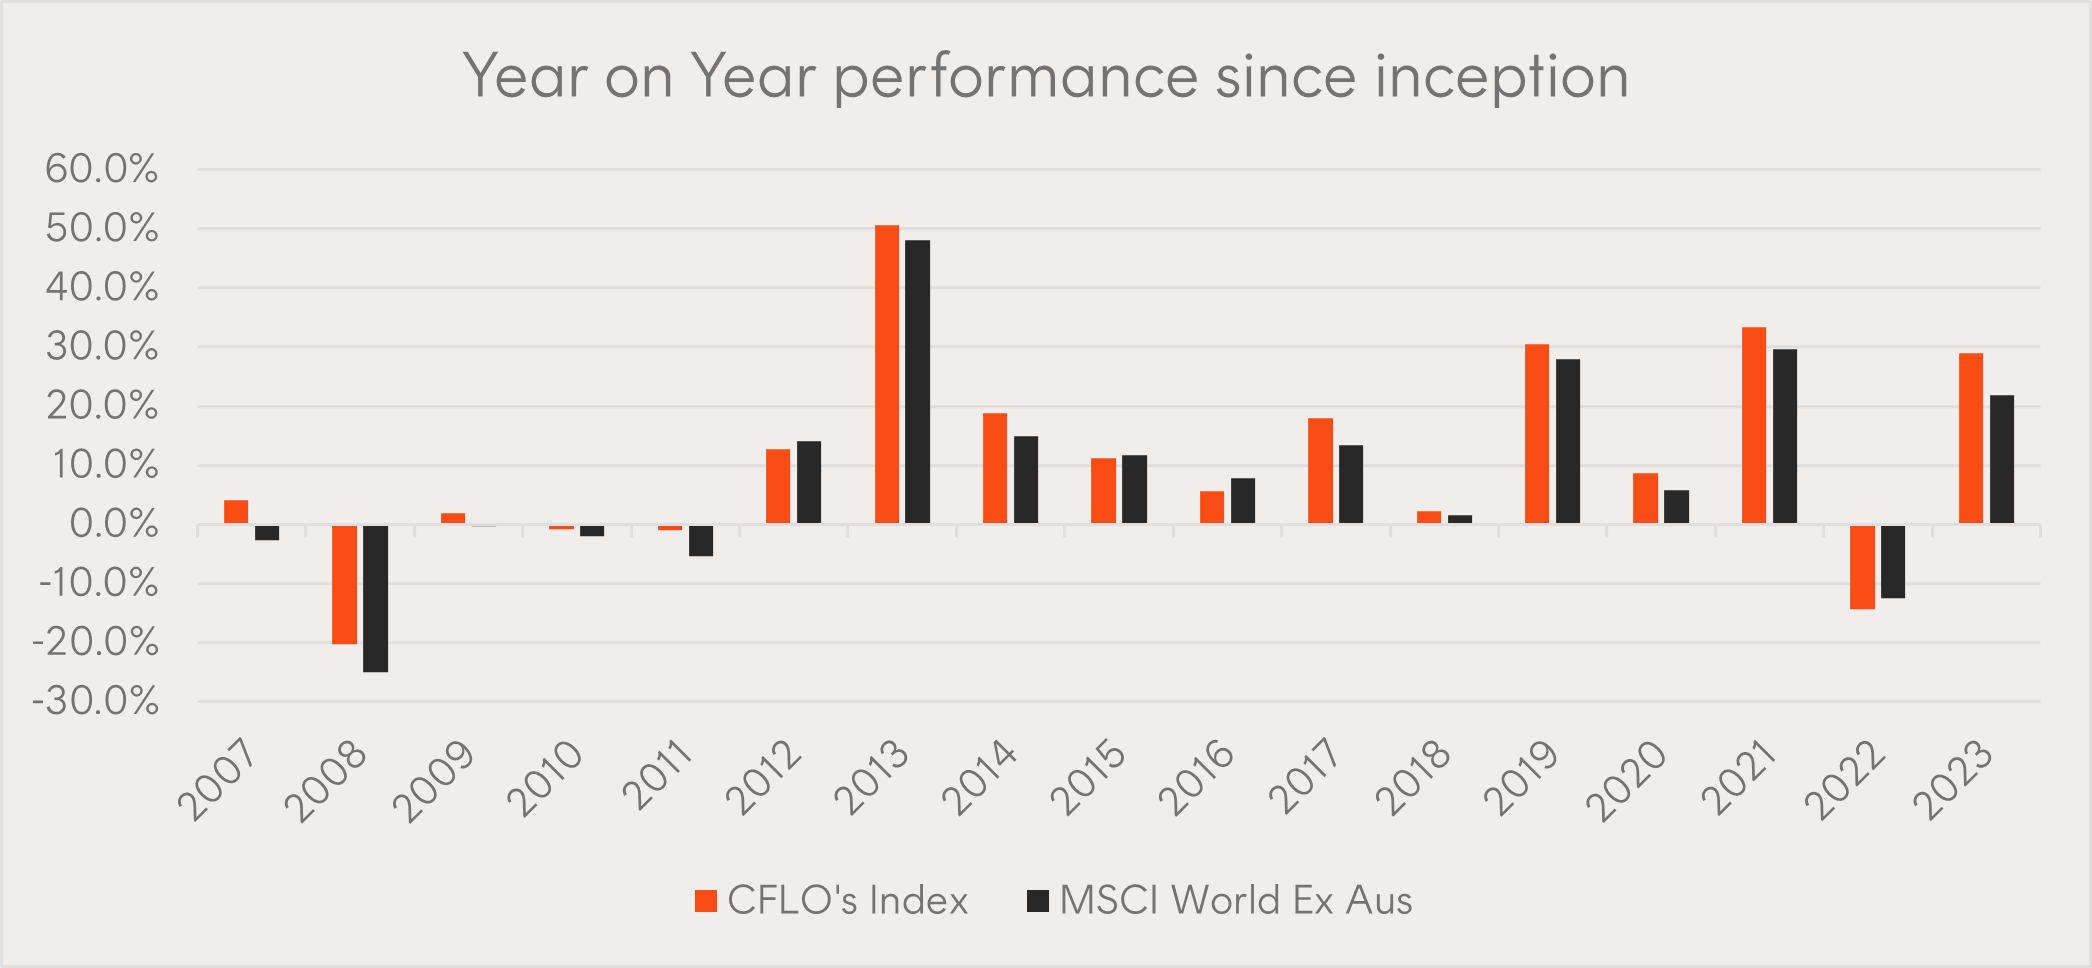
Source: Bloomberg. Data as of 31 October 2023. Annual calendar year total returns shown, with 2023 year data ending 31 October 2023. Chart shows Index performance (not actual fund performance) to illustrate the longer-term historical performance of global companies that demonstrate strong free cash flow. Doesn’t take into account ETF fees and expenses of 0.40% p.a. You cannot invest directly in an Index. Past performance is not an indicator of future performance.
3. A diversified core global equity allocation: The fund offers diversified exposure to 200 global companies with similar sector and country weights to broad global equity benchmarks.
Sector and country allocations vs global equities benchmark
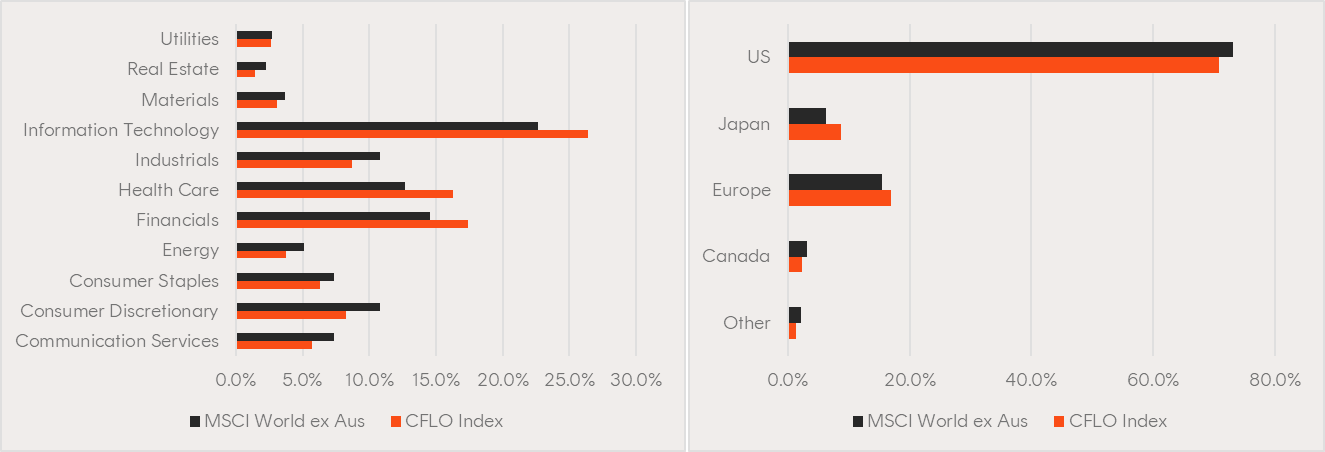
Source: Bloomberg. Data as of 31 October 2023. Sectors are defined by GICS classifications. You cannot invest directly in an Index. Past performance is not an indicator of future performance.
Portfolio implementation
CFLO was designed to address the key issue with active global equities strategies in mind; how do you provide alpha potential while minimising the risk of material underperformance?
The availability of low-cost passive approaches has made it more difficult for an ‘index hugging’ active manager to succeed – both in relative performance and attracting investor inflows. As a result, we have witnessed the growth in active global equity funds that pursue a ‘high conviction’ approach or particular investment ‘style bias’. While such an active approach has the potential to produce outperformance it also results in higher tracking error to market capitalisation global equity benchmarks, and therefore increases the possibly of sustained periods of material underperformance.
Given CFLO’s index adjusts sector and country allocations to reduce over and underweights, it is more aligned to the broader benchmark than many active funds, and its historical periods of underperformance have been shallower and shorter than most active global equity funds.
CFLO can provide investors with:
- outperformance potential at a far lower price point than most active managers.
- a more balanced, ‘index aware’ global equity profile without large over or underweights.
As such, it can be used as a single core exposure to global (developed market) equities. Or alternatively, CFLO blends well with active global equity funds to lower overall fees and reduce existing biases to sectors, countries, and factors at a portfolio level.
There are risks associated with investment in the Fund, including market risk, international investment risk, non-traditional index methodology risk and currency risk. Investment value can go up and down. An investment in the Fund should only be made after considering your particular circumstances, including your tolerance for risk. For more information on risks and other features of the Fund, please see the Product Disclosure Statement and Target Market Determination, both available on this website.
References:
1. Further details on the index methodology are available in the PDS and index methodology document, both of which you can access on the CFLO fund page.
2. Other costs, such as transaction costs, may apply. Refer to the PDS for more information.