
Southern route

David Bassanese
7 minutes reading time
Related articles


Better investing starts here
Get Betashares Direct
Betashares Direct is the new investing platform designed to help you build wealth, your way.
Scan the code to download.
Learn more
Learn more
After a few good years of equity market returns, recent market volatility has once again heightened investor concerns. It’s a reminder that equity returns, while good over the long-term, can be volatile over the short-term.
As the saying goes, volatility is the “price of admission” to be an equity market investor.
All this begs the question – just how volatile are equity market returns, especially on the downside? The chart below shows the daily drawdown in the S&P 500 from its peak levels going back 70 years to 22 September 1954 (the day the market finally recovered all its losses from the Great Depression 1930s crash). Several conclusions can be drawn from this history.
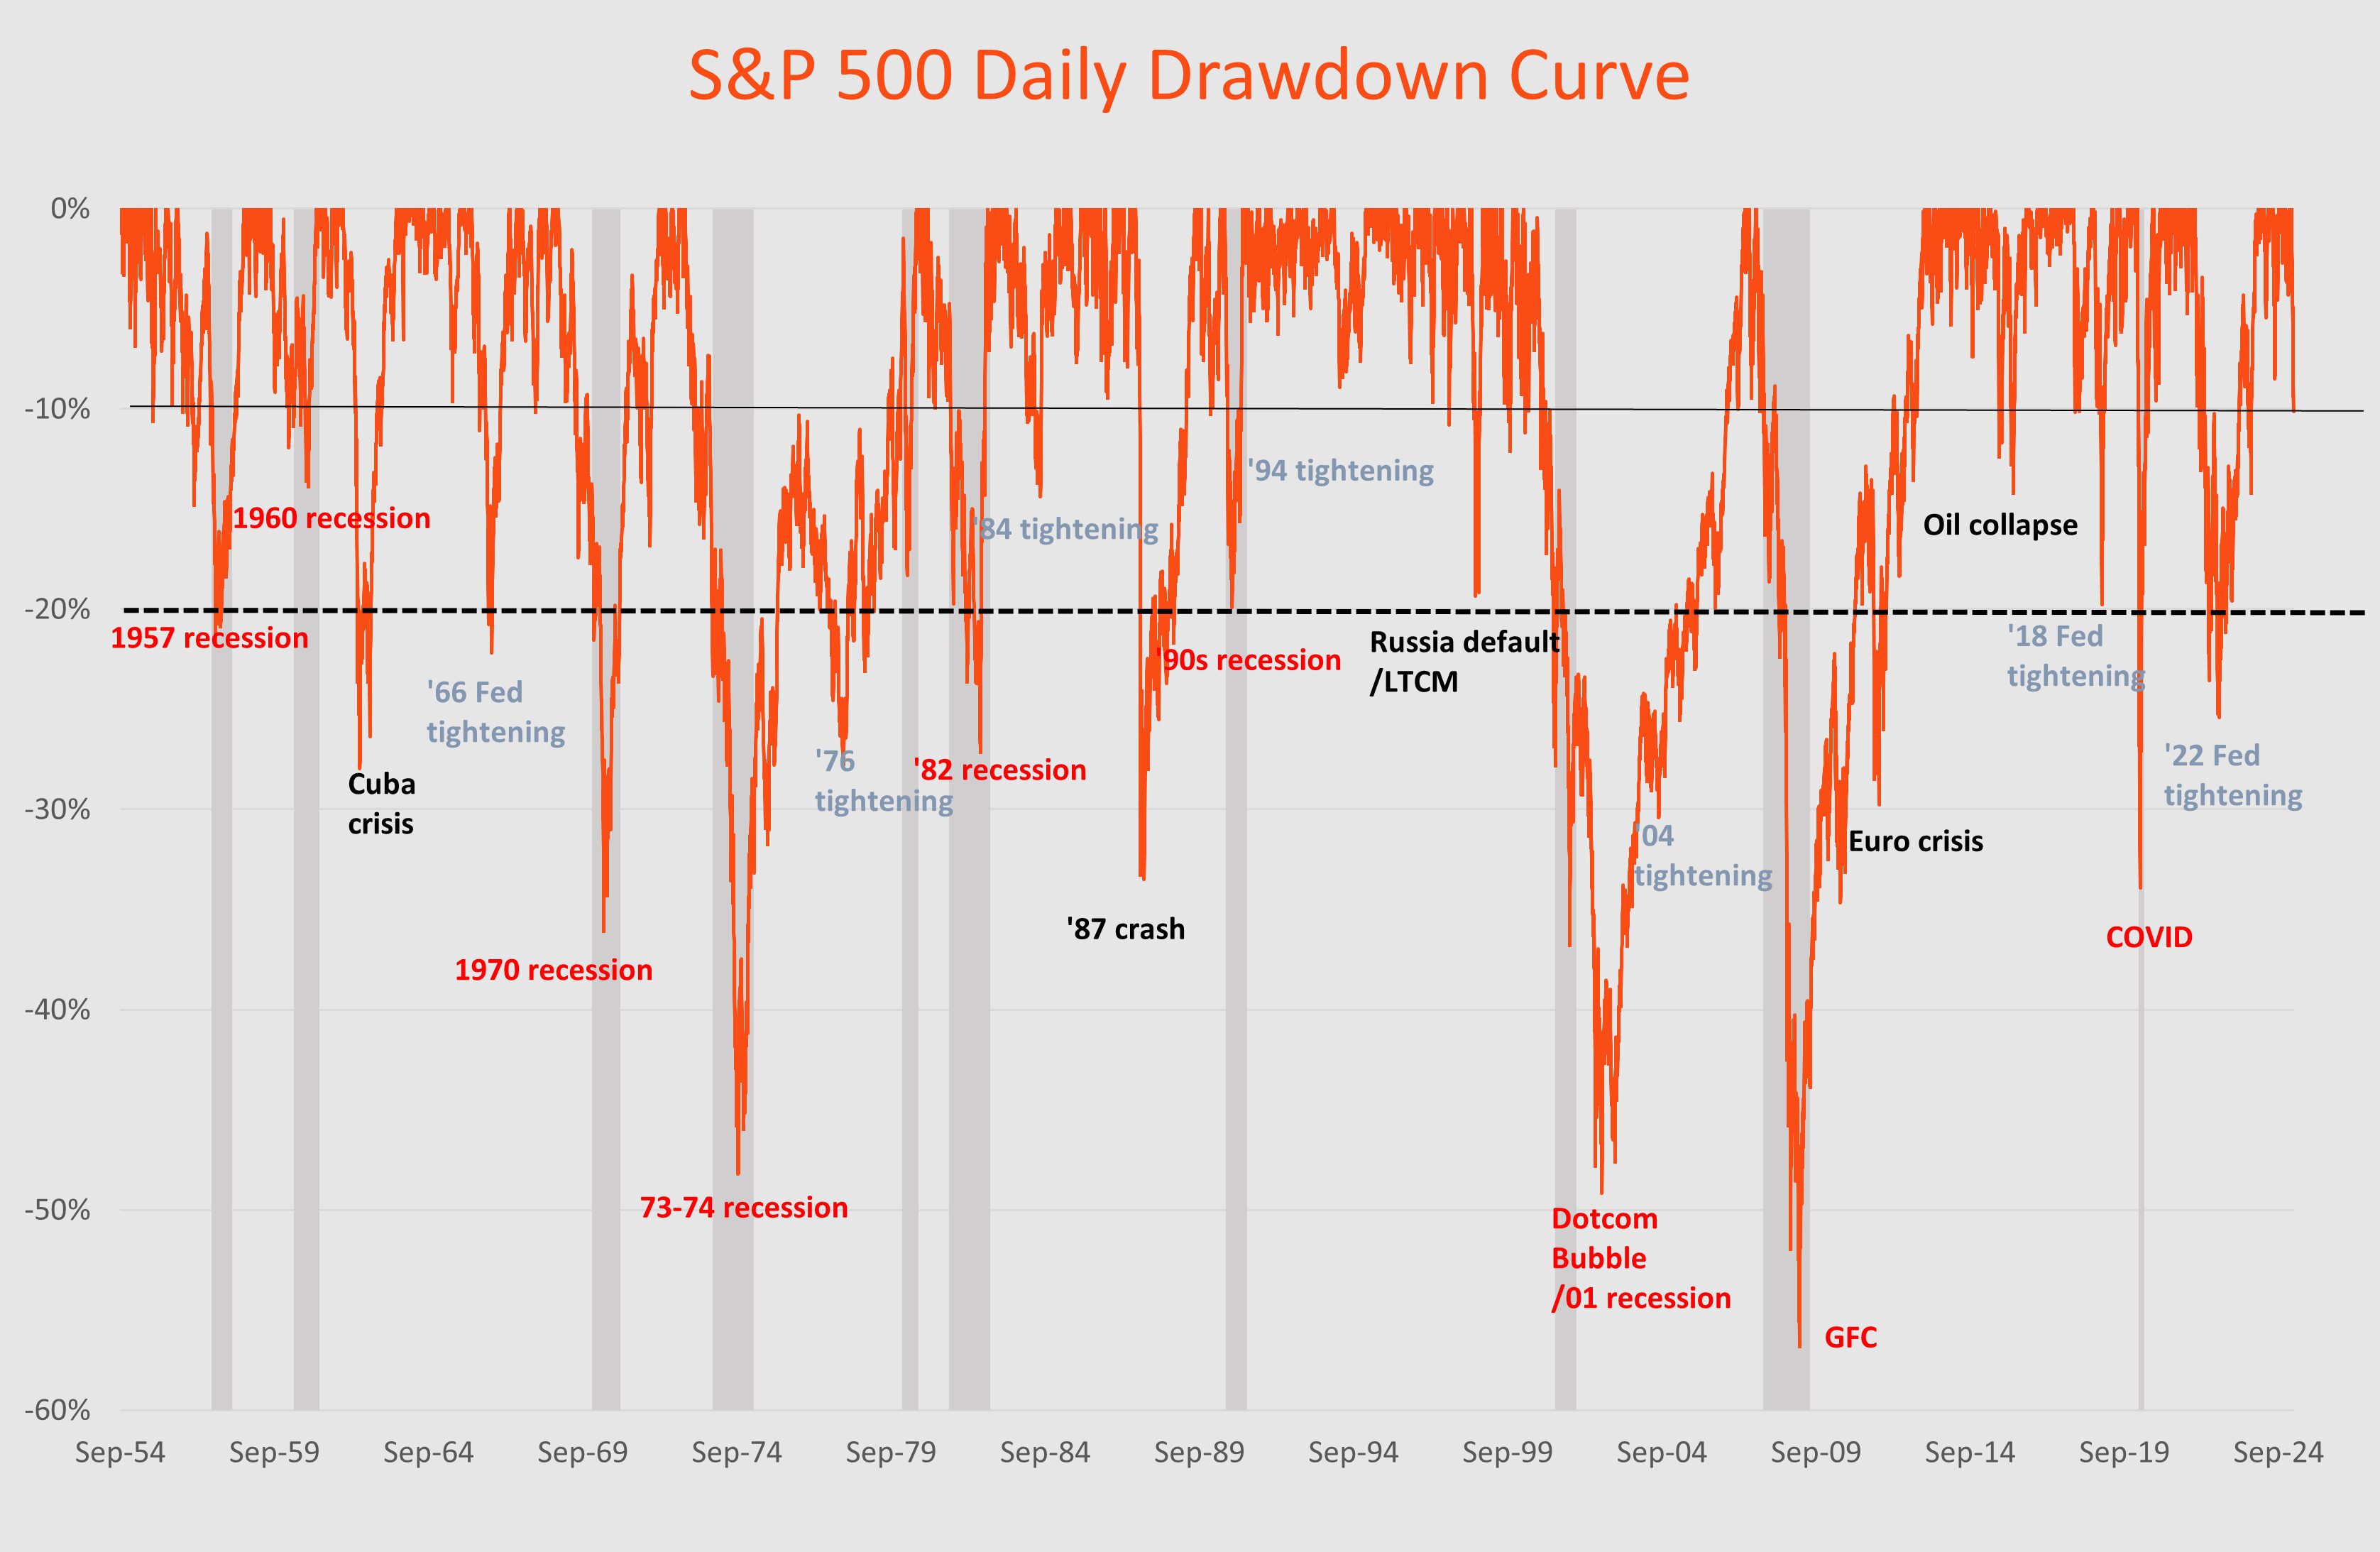
Source: LSEG Datastream, Betashares
Smaller pullbacks are very frequent
As most investors know, the market does not rise in a straight line. It can spend a considerable period of time pulling back after having made new record highs. In fact, the market only closed at new record highs on 7.4% of all the trading days surveyed in the above chart.
Most market pullbacks are small and very frequent.
Of the 589 pullbacks over this period, 523 (or 89%) were declines of less than 5%. Indeed, the market has spent around 40% of the time within a 0-5% drawdown zone. On average, these small pullbacks happen every 1.5 months and last around a week.
That means there’s been 66 market pullbacks of more than 5%, implying that the market has been down 5% at least once almost every year on average. Of these, 42 (or 64%) have been less than 10%. On average, these 5-10% corrections happened every one and half years and lasted just over a month.
Large bear markets have happened as frequently as smaller bear markets
That leaves 24 market pullbacks of at least 10%. This means that, on average, a decline of at least 10% has taken place every three years.
These can either remain “market corrections” of no more than 20%, or go on to become bear markets (meaning a 20%+ decline). However, what’s perhaps surprising is that the frequency of larger market declines, once the market is down 10% or so, does not tail off all that quickly.
Indeed, of these 24 market declines, 13 (or 55%) have remained market corrections of less than 20%. This means that 11 (or 45%) have gone on to record losses greater than 20%. There have been six declines of of greater than 30% and five declines of between 20-30%. Bear markets, defined as greater than 20% declines, have come around every 6.5 years.

Source: LSEG Datastream, Betashares
Recessions matter when it comes to corrections vs. bear markets
So, what distinguishes periods where markets correct by 10-20% from those that experience declines greater than 20%? One potentially obvious factor is whether the U.S. economy ultimately falls into recession.
As the following table shows, seven (63%) of the 11 bear markets since 1954 have been associated with recessions. Of the four remaining bear markets, two were associated with Fed tightening episodes (1966 and 2022), one related to the early 1960s Cuban missile crisis and the last being the 1987 stock market crash.
On average, bear markets last just over a year. It generally takes twice that long for the market to recover to its previous high. Bear markets that occur without a recession are typically shallower and shorter in duration.
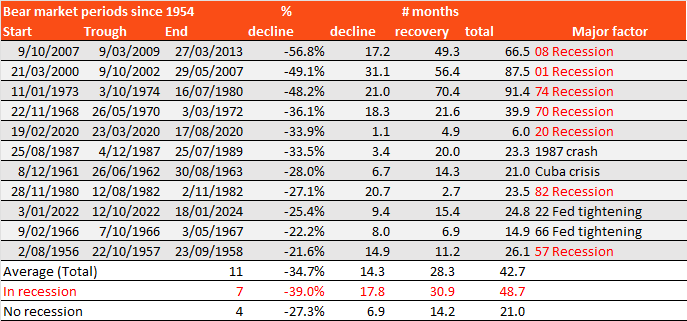
Source: LSEG Datastream, Betashares
As evident in the table below, of the 13 market corrections since 1954, only two (15%) have been associated with a recession (1960 and 1990). Most others have been associated with Fed tightening episodes that are not associated with recession. Among the other causes were the 1998 Russian debt default and the 2016 oil price collapse. So far, the current 2025 market correction is not associated with Fed tightening but rather US tariff concerns.

Source: LSEG Datastream, Betashares
As one might expect, corrections are usually shorter than bear markets. Corrections have an average decline of 13.5% and an average peak-to-trough duration of 4.3 months. Unlike in bear markets, the market tends to be quicker to recover market losses after a correction. The average trough-to-peak recovery here is 3.1 months.
All up, while 45% of corrections have gone on to be bear markets, that drops to only 26% in cases where no recession develops. When recessions to take place, the probability of a correction becoming a bear market rises to 77%.
Are market downturns becoming less frequent?
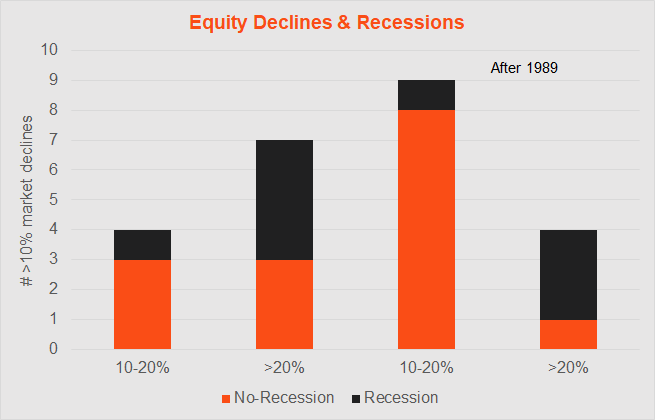
If we divide the period since 1954 into two periods (the dividing line being November 1989), there were 11 declines of more than 10% in the first half, and 13 in the second half – so on this measure the frequency of declines has not diminished. Both periods also had a similar frequency of recessions – five in the earlier period and four in the latter.
That said, there were seven bear markets in the first period yet only four in the latter period – so a lower proportion of market corrections turned into bear markets in the latter period (31%) than in the earlier period (63%).
Having one less recession in the latter period helped, but but it’s also apparent the latter period has just had more 10-20% declines (nine versus four).
When the US sneezes, we catch a cold
Finally, how do US market downturns affect the Australian market? Since the early 1970s, the Australian market usually suffered a 20%+ market decline when the US has also gone into a bear market. Sometimes, our downturns are worse and sometimes are not as bad (e.g. the GFC). The one great exception was in 2022. Our market was only down 15%, compared to a 25% market declines for the S&P 500.
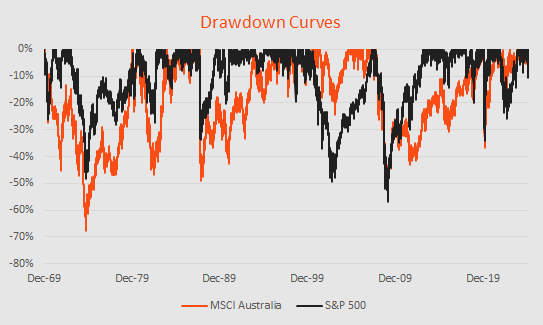
Source: LSEG Datastream, Betashares
Conclusion
Enduring often gut wrenching market declines is the “price of admission” for investing in the equity market.
Market declines of at least 10% have on average taken place every three years, and they seem no less frequent in recent decades.
In more recent decades, however, the frequency of 10-20% market corrections appears to have increased, though the probability of these becoming bear markets has lessened.
History suggests most market corrections have usually been associated with Fed tightening episodes that don’t go on to cause recession (i.e. “soft landings”). Geopolitical or financial market shocks haven been other factors.
Corrections are much more likely to become bear markets when associated with a recession – though 2022 was a notable exception.
More often than not, although 2022 was again an exception, Australia usually suffers a bear market when the US does. When the US sneezes, we often catch a cold.
Explore
Markets