
All in on AI? 3 ways to reduce concentration risk

David Bassanese
11 minutes reading time
Related articles

Better investing starts here
Get Betashares Direct
Betashares Direct is the new investing platform designed to help you build wealth, your way.
Scan the code to download.
Learn more
Learn more
The degree of slowing in US inflation this year remains critical to the global financial market outlook – as this in turn will determine the degree to which the US Federal Reserve raises interest rates and slows the US economy. Against this backdrop, this note examines the main factors driving US inflation over the past year and assesses the outlook for these factors over the remainder of the year.
US inflation hits 40-year highs
After having averaged a relatively low rate of around 2% in the years prior to the COVID crisis, annual US headline consumer price inflation recently hit 8% in May this year – the highest level in 40 years. Excluding food and energy prices, even so-called ‘core’ CPI annual inflation was relatively high at 6.0%.
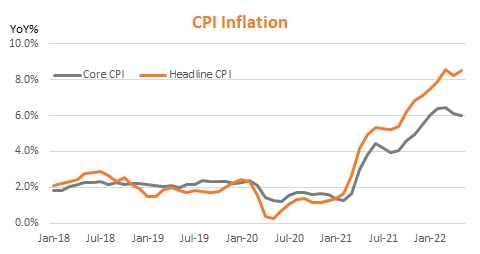
Source: Refinitiv, BetaShares
The table below helps tease out what has driven this surge in inflation from its recent lows in early 2021.
Analysis of US Consumer Price Index (CPI) Inflation
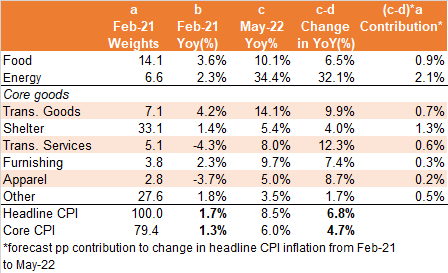
Source: Refintiv
The first point to note is that the lift in inflation has been fairly broad-based. Inflation has lifted across food, energy and a range of other goods and services.
Energy prices
The broad category of ‘energy’ accounted for around 7% of the CPI this time last year*, of which around half relates to petrol. Over the year to May 2022, CPI energy prices surged by 34.4% – or 32.1% above the February 2021 annual rate. This contributed 2.1% – or almost one-third – of the 6.8% lift in headline annual inflation over this period.
In turn, this has largely reflected a 70% rise in global oil prices from $66 to $110 over the year to May. Rising global oil prices have reflected strong post-COVID global demand for fuel, supply constraints due to a lack of investment in new capacity in recent years (including U.S. refining capacity), and most recently the loss of Russian supplies to much of the global market.
Historically, a 30% gain in oil prices has usually resulted in around a 10% gain in CPI energy prices, so the lift in CPI energy prices in the past year has been a little stronger than might otherwise have been expected (likely reflecting higher gas prices, limited US refining capacity, strong pent-up demand and rising labour and transport costs).
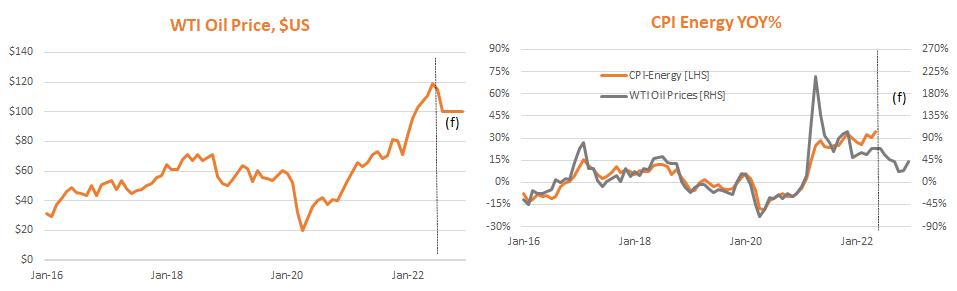
Source: Refinitiv, BetaShares
All that said, if we assume oil prices drop to a (still high) US$100 by year end, annual oil price inflation would drop from 70% to 40%, and we could see annual CPI energy price growth potentially halve to 15%. If so, that would reduce headline CPI inflation by 1.4%**
Of course, if oil prices keep rising, the decline in energy price inflation would be much less. If oil prices ended the year at US$150 per barrel, for example, annual oil price growth would be 112%, suggesting little easing in the 30% annual growth in CPI energy prices.
Food prices
The broad category of food accounts for around 14% of the CPI, with prices in this area up 10.1% in the year to end-May. While food covers many items, one underlying driver is global food prices as proxied in the chart below by the United Nations Food and Agricultural Organisation (FAO) food price index.
As evident, global food prices tend to feed through into U.S. CPI food prices with a lag (9 months provides the best broad fit over recent years). Food prices have also lifted strongly in the past year thanks to strong demand due to COVID-related policy stimulus and supply disruptions owing to challenging climatic conditions (such as drought in the United States wheat belt) and Russia’s invasion of Ukraine.
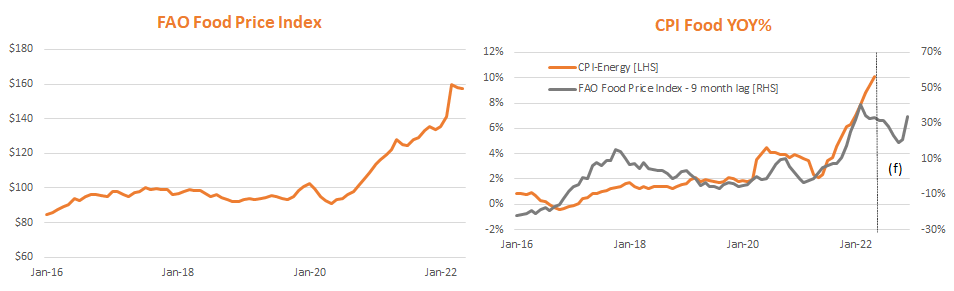
Source: Refinitiv, BetaShares
Based on recent food price performance, annual growth in the 9-month lagged FAO index will still be just over 30% by year end – hardly slowing from the current annual rate. That said, given the recent US CPI food price overshoot, it’s still possible that annual growth in this category could slow modestly by year-end from 10% to around 8%. That would only reduce annual CPI inflation by around 0.25%.
All up, based on reasonable assumptions, food and energy prices could combine to reduce annual headline inflation by around 1.5% by year-end – or a still high 7%. Any further slowing will require a decline in core consumer prices.
Shelter costs
Shelter costs are a major component of the CPI, accounting for one third of the headline CPI, and 40% of core consumer prices.
As seen in the chart below, core consumer prices tend to follow shelter prices fairly closely.
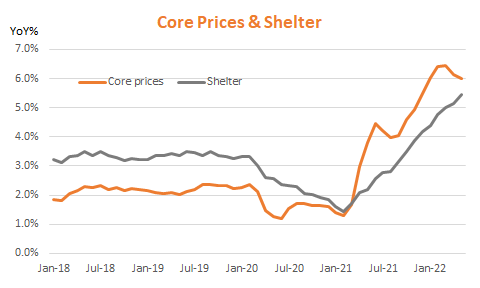
Shelter costs are in turn largely driven by rents – either on actual rental properties or imputed to have been paid by owner occupiers.
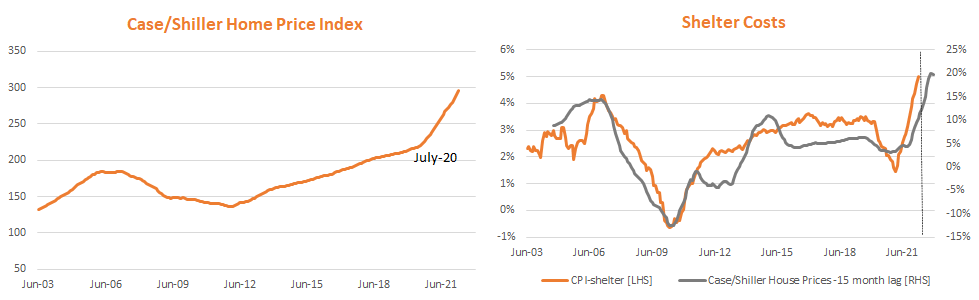
So what drives rents? As evident in the charts below, 0ver time rents tend to follow house prices, albeit with a lag (in part due to the lagged way in which a lift in rents on new leases is passed through into the CPI measure of rents, as the latter measures changes in the average actual or imputed rents paid by all households on new and existing leases).
US house prices have been rising solidly for many years since the financial crisis, but accelerated from mid-2020 – supported by very low interest rates and the strong rebound in economic growth.
Annual growth in CPI shelter costs has accordingly accelerated from less than 2% to around 5%. The bad news in this regard is that the lagged impact of high annual house price growth is likely to keep annual growth in CPI shelter costs at least around current levels – if not higher – over the remainder of 2022, even if house prices start to fall in coming months. This suggests only limited slowing in core consumer prices as long as rents continue to rise solidly.
Source: Refinitiv, BetaShares
Core goods – Transport
There are more grounds for hope in slowing core consumer prices through transportation. Transportation goods are another major component of the CPI, accounting for around 7.5% of the CPI and 9.5% of the core CPI. Within transport goods, the vast bulk is accounted for by an equally-weighted share to both new and used cars and trucks.
Transport prices have increased notably in the past year, as reflected by the surge in used car prices (as measured by the Manheim Used Car Price Index). This in turn reflects both a COVID-related increase in demand for private over public transportation and supply shortages with regard to new cars (related to global semi-conductor shortages). As evident, however, used car prices appear to have peaked in January, with a price decline of 6.4% in the three months to end-April. That said, used car prices did tick back up by 0.7% in May.
![]()
Source: Refinitiv, BetaShares
In the year to end-May, the CPI transport goods price category was up 14.1%, which was still relatively high given a slowing in annual used car price inflation (according to the Manheim Used Car Price Index) to 9.7%. Assuming a continuation of used car price declines in coming months – with an annual price decline of 20% by year-end – it’s possible that CPI transport goods prices could be down by 10% by year-end. With a 8% CPI weight for December 2021, a 25% swing in annual transport goods inflation (from +14% to -10%) could lower headline CPI inflation by 2% by year-end, and lower annual core consumer inflation by 2.5%, or from 6% to 3.5%!
One counter to this hope, however, is continued strength in new car prices – reflecting ongoing supply shortages. Indeed, Tesla recently announced further price increases for its range of cars, reflecting rising costs and supply shortages relative to demand.
Other core consumer prices
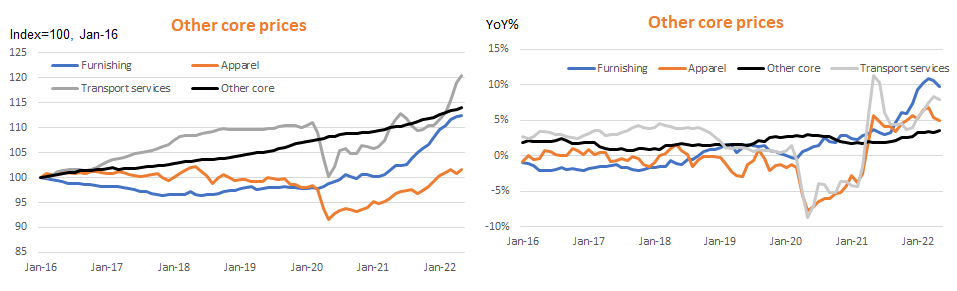
Excluding shelter and transportation goods, other core items account for around 37% of the headline CPI and almost half the core CPI. As evident in the chart below, other core price inflation consistently ran at sub-2% levels prior to COVID, then sunk below 1% during COVID, only to accelerate to 5% over the past year.
In turn, this has reflected a marked acceleration in items such as home furnishing, apparel and transportation services. Apparel prices initially collapsed in early 2020, with the subsequent rebound largely restoring prices to pre-COVID levels. Home furnishing has had a more marked acceleration in prices, likely reflecting increased ‘work from home’ demand and global supply bottlenecks. Transportation service price increases have reflected the flow-on impact of higher fuel costs on public transport and airline prices. As with apparel, part of the rebound in airline prices reflected a recovery in prices levels following their initial COVID-related collapse – though pent-up demand for travel along with higher fuel costs has seen overall prices recently push beyond pre-COVID levels.
Source: Refinitiv, BetaShares
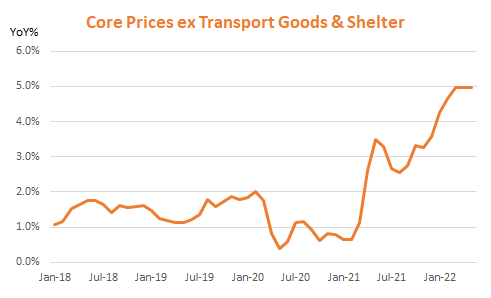
Excluding furnishing, apparel, transport services, transport goods and shelter, the lift in other core prices over the past year has been less marked, with annual inflation reaching 3.5% at end-May.
There are tentative signs that clothing and furniture prices are finally levelling out, supported by reports that retailers now have excess inventories of WFH items as people return to offices and factories. Indeed, there’s a chance that at least some apparel and furniture prices could fall to clear excess inventories.
If we assume transport services, apparel and furnishing have zero price growth over the remainder of the year and annual growth in other core prices eases to 3% from 3.5%, other core prices combined could shave 0.4% off annual headline inflation by year end and around 0.5% off annual core inflation.
Conclusion – easing inflation is likely, but it will likely require a weak economy and some luck
There are a myriad of supply and demand factors that have pushed up US inflation over the past year. In some areas – such as shelter costs – inflation is likely to remain uncomfortably high for a while, due to lags before a weakening in the housing markets flows through into estimated rents. In other areas, such as energy prices, used cars, apparel and furnishing, there are grounds to believe prices could at least level out in coming months, if not fall, helping bring down inflation.
Indeed, the table below shows some broad estimates of what could be possible based on the set of assumptions above. It suggests that headline inflation could potentially fall to 5% by year end, and core inflation to just over 3% – largely due to a slowing in energy and transports goods annual inflation. If so, it would suggest the Fed may not need to be as aggressive as markets fear in raising rates, and there could still be a chance the economy avoids recession.
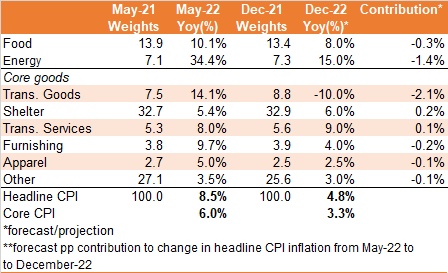
Source: Refintiv. Actual outcomes may vary materially from forecast.
That said, risks clearly remain. Ongoing supply disruptions due to Russia’s invasion of Ukraine risk pushing energy and food prices ever higher. To contain these risks, some element of demand destruction will likely be required – while already high food and energy prices will help in this regard, higher interest rates to slow demand more broadly will also be needed.
*Weights used in the table are from February 21 so as to assess the contribution to the increase in annual inflation since that period.
**Based on CPI weights for December 2021.