
Chamath De Silva
4 minutes reading time
We all know the equity market has its ups and downs. Bullish runs are often interrupted by sharp corrections or extended bearish periods, even amid little change in fundamentals. With so much ‘noise’, how should investors be thinking about their equity investments? I studied the historical data to try to get some answers about longer term investing in the share market. Turns out, like Mick Jagger famously said, “Time is on my side”.
One of the most obvious ways that investors try to deal with market volatility is via diversification. The idea here is that diversification helps investors reduce the volatility of their investment returns through spreading their investments across securities with less than perfect positive correlation. However, there are limits to diversification benefits, notably during particularly severe financial shocks, where returns between seemingly uncorrelated assets converge. Another way to reduce volatility in investment portfolios is to increase cash holdings, which provides a cushion against a blow to equity portfolios. The tradeoff, however, is ‘cash drag’, which undermines returns when the market is rising (which historically has been the majority of the time). Another solution is to just wait it out.
In the short-to-medium term, the broad equity market can be quite volatile but as investment horizons are lengthened, this volatility compresses as cycles are levelled out. This may be obvious, but as a recent BetaShares blog post pointed out, it’s easy to get trapped in the mindset of ‘short-termism’ or investment myopia. We know staying the course in a diversified index irons out short term fluctuations, but it’s worth seeing just how much.
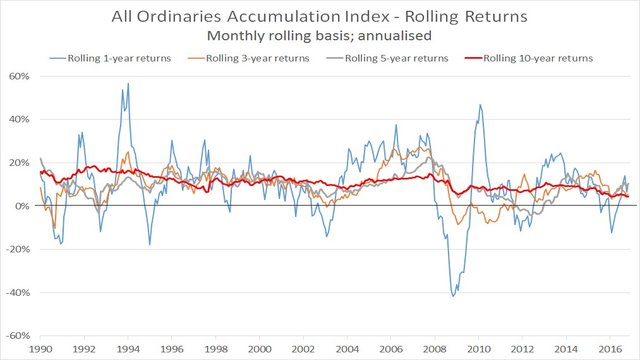
The Australian sharemarket – a case study
Since 1980, the ASX All Ordinaries Index has experienced some sharp bouts of volatility, particularly through the lens of a 12-month holding period. The worst drawdown (between November 2007 and November 2008) was -42%, while the strongest rally (between July 1986 and 1987) was +86%. In addition, most observations fell between +1.9 and +22.7 percent, suggesting not only significant dispersion, but a fairly large “tail”, or reasonably large number of years of extreme shocks. But what if our investment horizon is greater than 1-year? Let’s crunch the numbers.
All Ordinaries Accumulation Index – Annualised Returns for Various Holding Periods*
| 1-year | 3-year | 5-year | 7-year | 10-years | 20-year | |
|---|---|---|---|---|---|---|
| Average | 12.3% | 11.7% | 11.6% | 11.2% | 11.0% | 11.1% |
| Best | 86.1% | 50.3% | 40.4% | 25.5% | 18.4% | 15.1% |
| 75th percentile | 22.7% | 16.4% | 14.8% | 13.6% | 12.9% | 12.6% |
| 25th percentile | 1.9% | 5.6% | 7.3% | 8.6% | 8.7% | 9.4% |
| Worst | -41.7% | -10.4% | -4.1% | 1.2% | 4.5% |
*Returns are calculated from all the possible 1-year, 3-year, 5-year, 10-year and 20-year holding periods (based on rolling monthly intervals) between January 1980 and November 2016.
Source: Bloomberg. Past performance is not an indicator of future performance.
There are some clear conclusions we can draw from the table and chart above. As expected, the return dispersion narrows as we increase our holding period, but the degree to which it does this is really quite striking. Moving from a 1-year to 3-year horizon not only narrows the dispersion of return outcomes (most returns now fall between 5.6% and 16.4%), but significantly reduces the size of the tail and worst loss (i.e. worst loss moves from -42% to -10%). Moving from 3-years to 7-years takes it a step further with a 7-year holding period marking the point where our worst case scenario has still generated positive return. The benefits continue through to 10-year and 20-year holding periods, with the worst outcomes seeing positive returns of 4.5 per cent and 8.2 per cent respectively.
So what does this all mean? When investing in equities, it’s easy for investors to get stuck in a short-sighted mindset even if our goals are long term. However, if we acknowledge our behavioral biases and the benefits of staying the course (not to mention cost savings from reduced trading and not realising capital gains when we don’t have to), we can better align our trading strategies with our investment objectives. If we have the luxury of time and little short-term liquidity requirements, the analysis illustrates we shouldn’t be afraid of a relatively high allocation to equities – time is on your side.