10 minutes reading time
This information is for the use of licensed financial advisers and other wholesale clients only.
Commentary from the Betashares portfolio management desk by Head of Fixed Income Chamath De Silva, providing an overview on fixed income markets:
- The risks of a US hard landing have increased following a string a very weak US labour market data last week, sending bond yields plummeting and buoying rate cut expectations.
- Bonds are once again working as an equity diversifier, with the 3-month rolling return correlation between US stocks and bonds turning negative.
- Australia will likely be pulled into the global easing cycle sooner than expected, with the soft Q2 CPI print alleviating risks of a rate hike resumption
The narrative shifts again
What a difference a week can make. The dominant macro narrative has now shifted from a “soft landing” to concerns about the Federal Reserve making a “policy error” by waiting too long to cut rates following a marked deterioration in the US labour market.
This shift comes amid a sequence of recessionary data last week, including higher-than-expected jobless claims, a weak ISM employment print, and a very disappointing US jobs report.
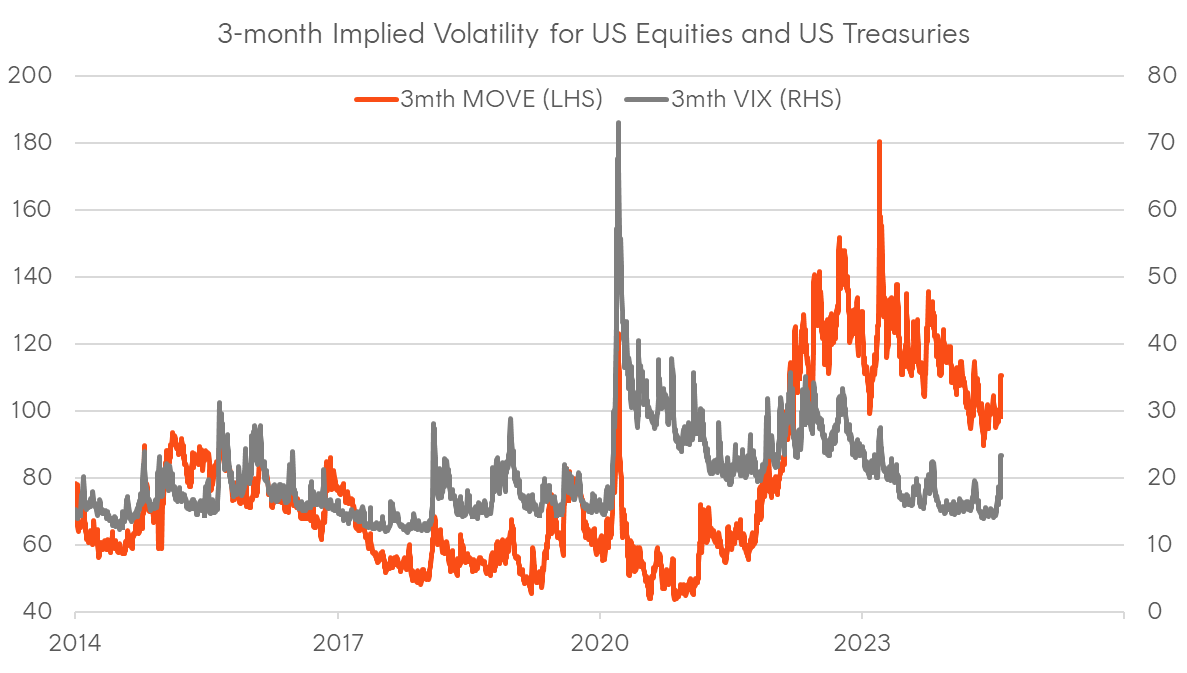
Bonds are surging, with the US 2-year yield experiencing its largest weekly decline since the regional banking stress of early 2023, and a 50-basis point cut at the next FOMC meeting in September is now becoming the base case. Furthermore, we’ve seen a return of the classic risk-off dynamic (bonds rallying and stocks falling) that had largely been absent over the past few weeks. Last week also marked the first major deleveraging event in over year, amid a jump in the VIX and MOVE indices of equity and interest rate volatility.
Before diving into the most recent US developments, it’s worth setting the scene, as the groundwork for a significant bond rally had already been laid. We are now clearly in a global easing cycle, with the ECB, the Bank of Canada, the Swiss National Bank, the Swedish Riksbank, and the Bank of England all having begun rate cuts.
The Fed is also signalling that its next move will likely be down, as is the Reserve Bank of New Zealand. However, rate cuts alone present a benign backdrop for risk assets, with the weak June US CPI data supporting this soft-landing view and justifying the equity rally (and market rotation), on the assumption that the US labour market would remain resilient.
There’s often a fine line between “goldilocks” and recessionary data—or, put another way, between “bad news is good news” and “bad news is just bad news”. Last week’s price action was an example of the latter.
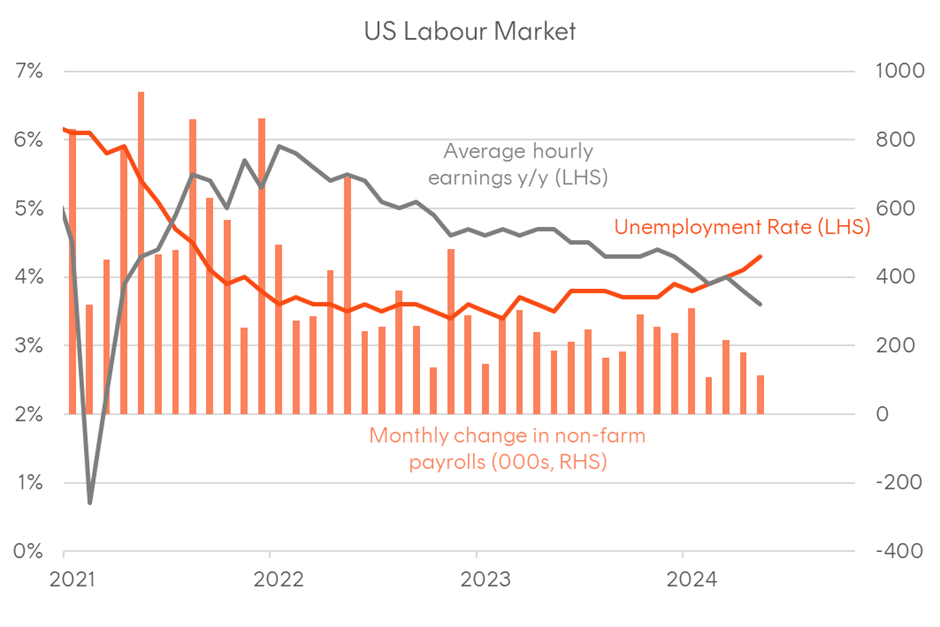
The US labour market data had been weakening for much of this year —average hourly earnings had been moderating, and the unemployment rate had been drifting higher, bringing more attention to the so-called Sahm Rule, an indicator with a good history of matching unemployment trends with recessions.
That said, until last week, the softer data was still seen by the market as less a recessionary signal and more a justification for the Fed to increase focus on the second part of its mandate (i.e. supporting growth and employment), allowing them to shift away from a restrictive policy setting to a more neutral one. This made rate cuts highly likely this year, and it’s probable that their reaction function would have called for aggressive cuts even without a recession.
Figure 1: Change in US Treasury yields and inflation breakevens
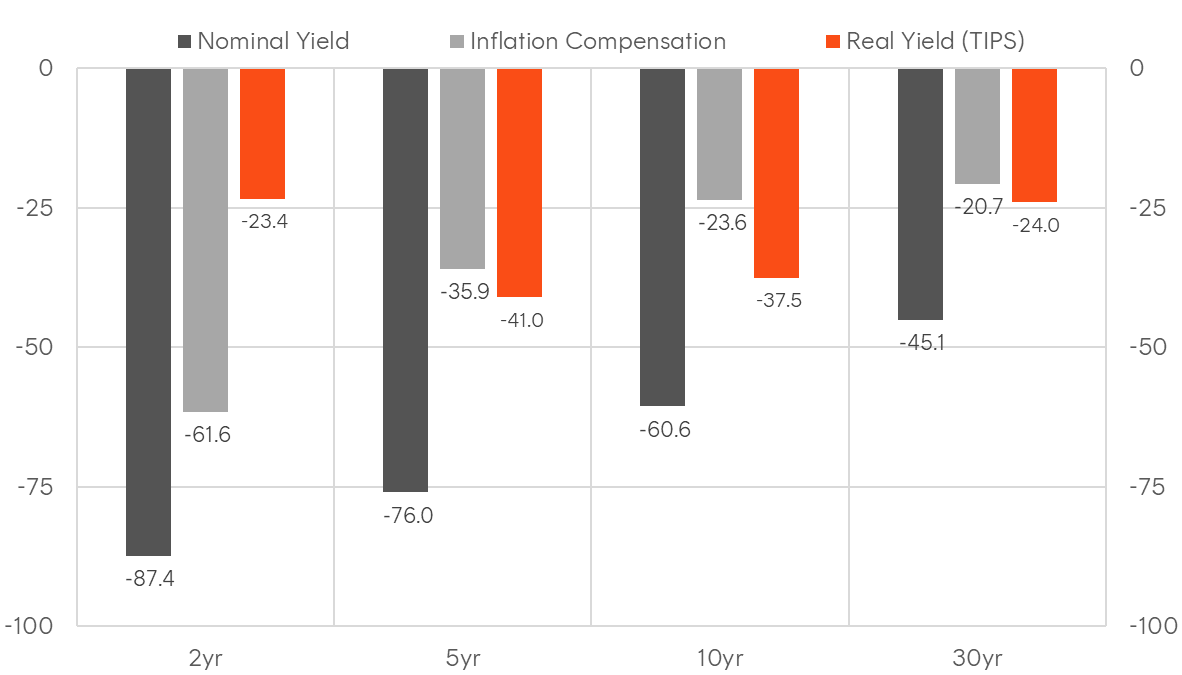
Source: Bloomberg. Between 30 June 2024 and 2 August 2024.
Figure 2: The largest weekly decline in the US 2-year yield since the regional banking stress of 2023
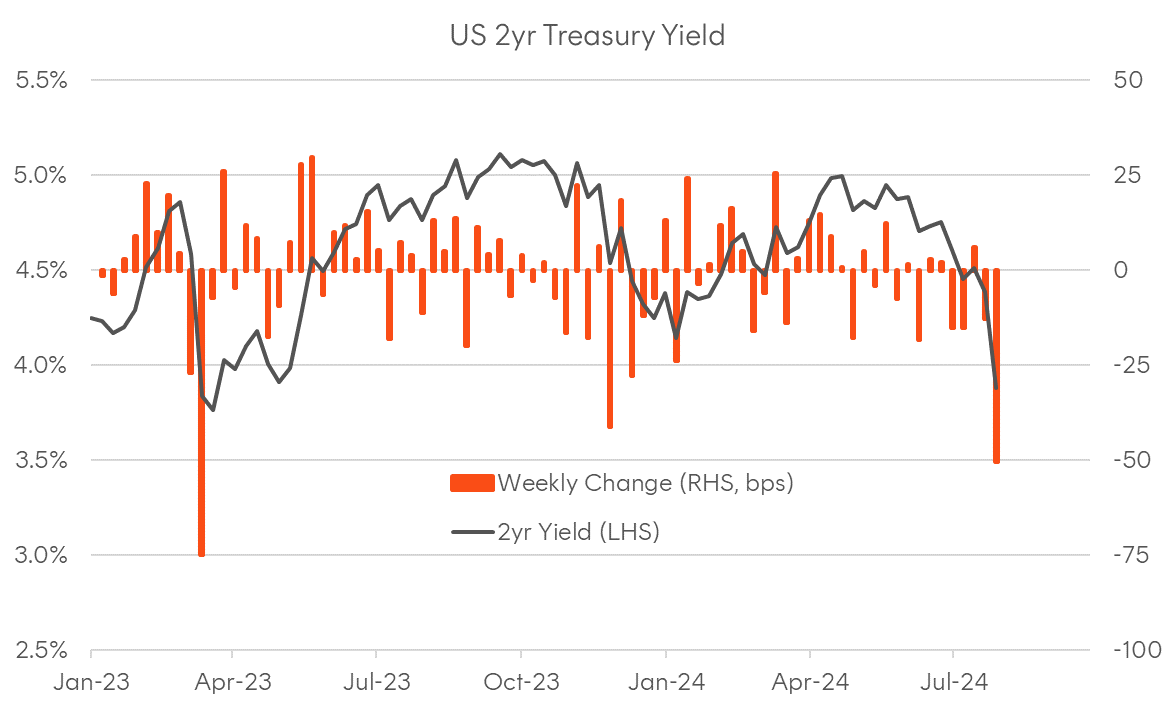
Source: Bloomberg
Figure 3: The Fed’s reaction function visualised
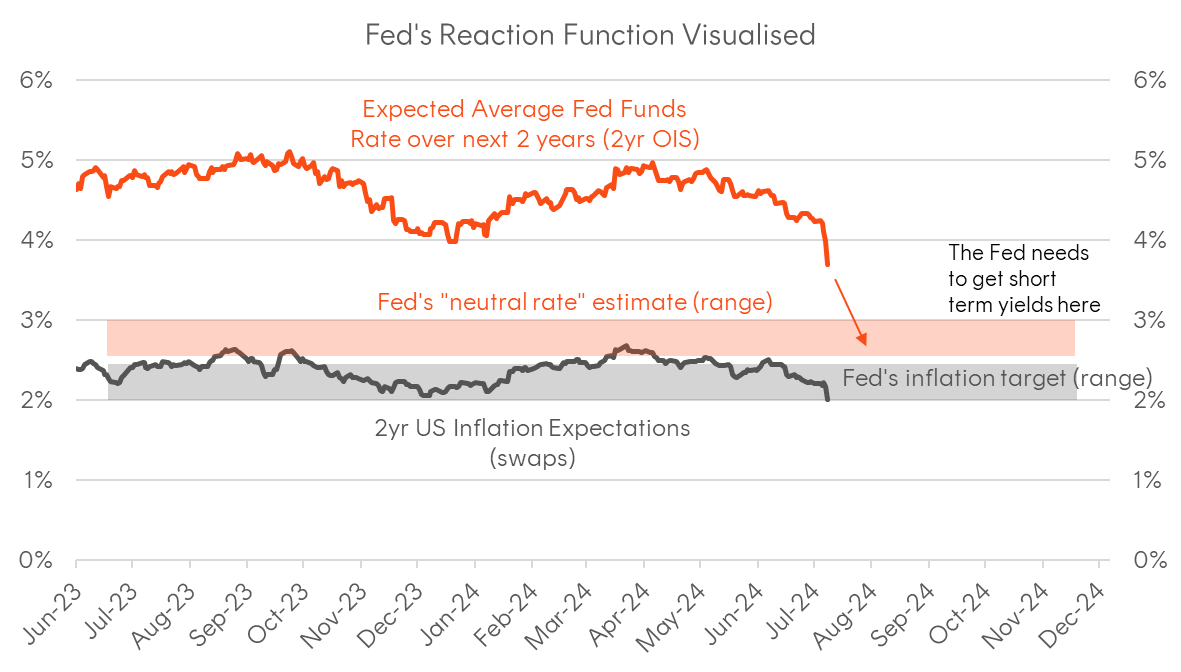
Source: Bloomberg, Betashares
Figure 4: Evolution of range in forward fed funds pricing
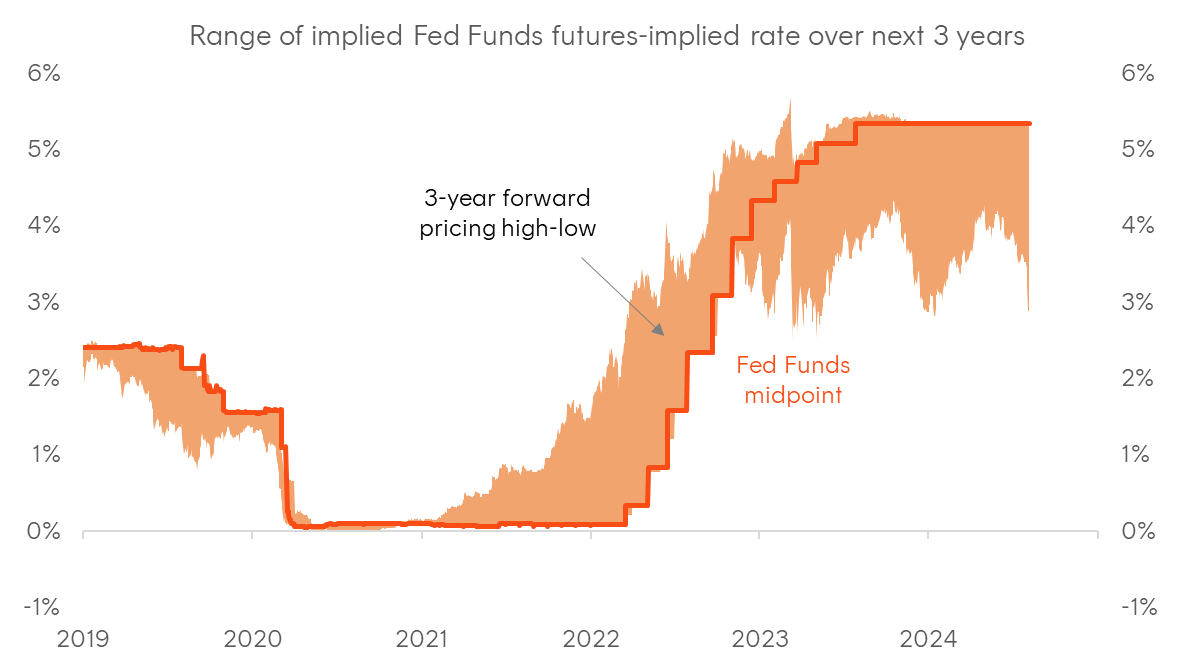
Source: Bloomberg, Betashares
The week where everything changed?
The key turning points for markets during the week ending 2 August were actually a few factors. First, there was some deleveraging dynamics that kicked into gear from the Bank of Japan’s decision to hike, prompting an unwind of the yen carry trade, weakness in Japanese equities, and a rise in FX volatility.
However, positioning alone didn’t change the macro narrative. On Thursday, we saw a weak sequence of data, including higher-than-expected weekly jobless claims and a very weak employment sub-component of the manufacturing ISM survey. We then had the July FOMC meeting, which didn’t reveal anything new in the Fed’s thinking, although it largely gave the green light to traders to double down on rate cut expectations.
It’s also worth noting that the notion of a Fed policy error had already started gaining traction within the macro community and influential figures in US policy circles. A notable example was an op-ed in Bloomberg by former New York Fed President Bill Dudley, who had gone from being one of the most well-known hawks to now saying the Fed was risking a recession by waiting until September to cut rates.
Friday’s US employment data saw misses across the board—non-farm payroll growth was lower than expected, there were negative revisions, average hourly earnings missed expectations, and importantly, the unemployment rate unexpectedly rose.
The situation has now fundamentally changed based on the market’s reaction. Not only has the rise in unemployment from 4.1% to 4.3% triggered the “Sahm Rule” (see chart below), but forward-looking inflation expectations have now collapsed, leaving the Fed even further away from a “neutral” stance, which creates an even greater need for rate cuts.
Perhaps rumours of bonds’ demise as an equity diversifier have been greatly exaggerated, with the 3-month rolling correlation in returns between the S&P 500 and Treasuries turning negative.
Figure 5: The US Labour Market
Source: Bloomberg. As at 31 July 2024.
Figure 6: The Sahm Rule
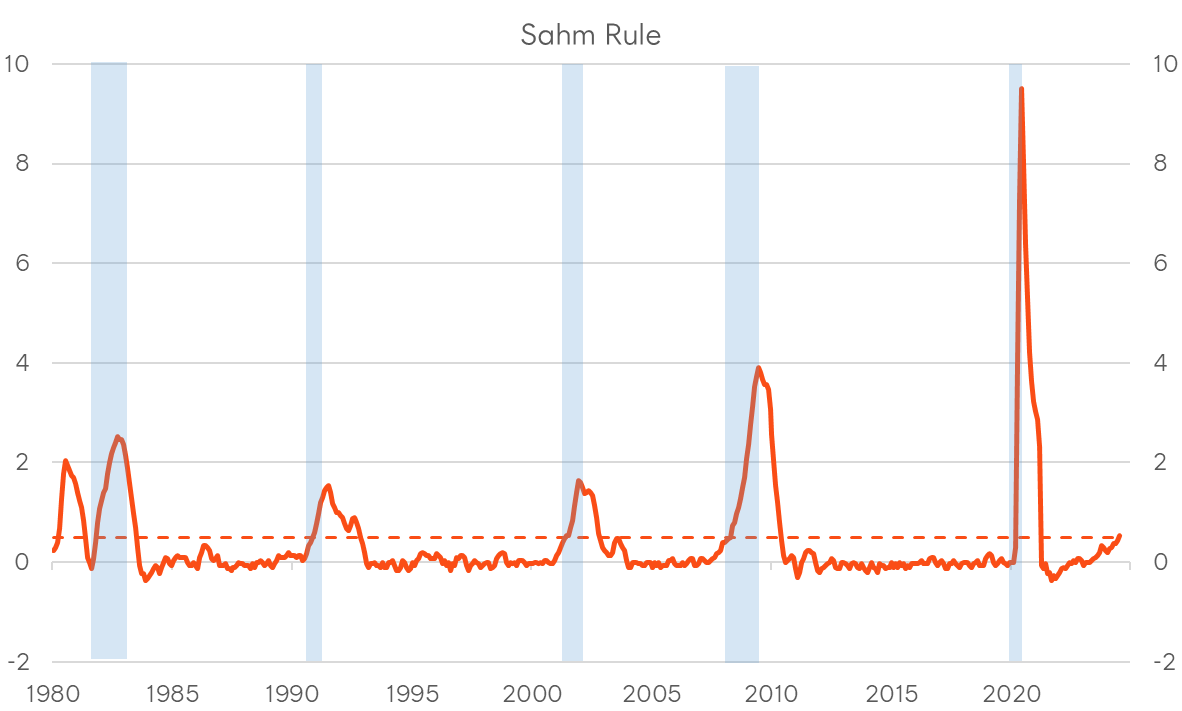
Sahm Recession Indicator signals the start of a recession when the three-month moving average of the national unemployment rate (U3) rises by 0.50 percentage points (dotted line) or more relative to the minimum of the three-month averages from the previous 12 months. Source: St Louis Fed, Bloomberg; Recession bars shaded.
Figure 7: 3-month rolling return correlation between S&P 500 and US Treasuries

Source: S&P, Bloomberg
Figure 8: 3-month VIX and MOVE indices
Source: ICE, CBOE; Bloomberg
What this means for Australia?
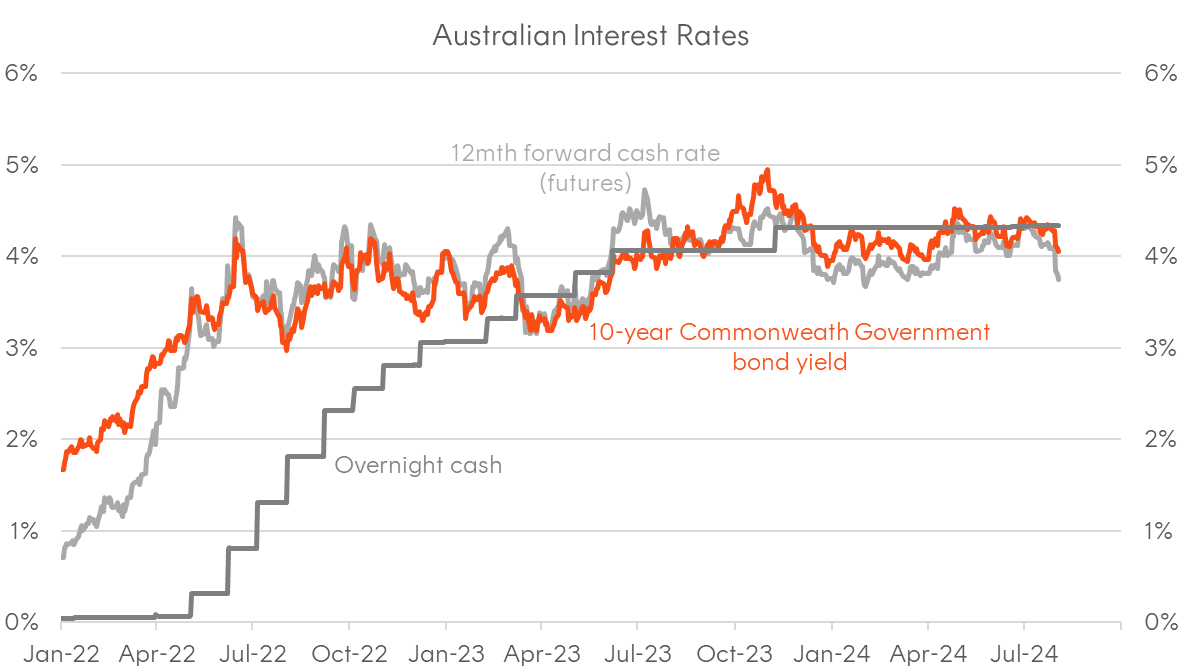
While the narrative shift in the US has been dramatic, it has been just as profound here. Only a week ago, commentators and the sell-side were discussing the risks of the hiking cycle resuming. This made last week’s Q2 CPI print quite important in dictating the RBA’s updated inflation forecasts, with a hot reading potentially putting this week’s CPI “in play”. However, with CPI coming in below expectations, the debate has shifted from whether the RBA will hike to how long it will wait to cut rates.
Australia (along with Japan) had been a bit of an outlier in market pricing, largely because the sell-side economist community and financial press had created a hawkish echo chamber following the higher-than-expected May monthly CPI print, despite the rest of the world having moved on from inflation being the primary concern of policymakers.
Regardless of what the Q2 CPI print delivered, we should not forget that we are a small, open economy, and policy and markets do not move in isolation from the rest of the world. It would be extremely hard to see the RBA hiking while the Fed and most other central banks are cutting. I like to joke that predicting what RBA will do over the next 12 months is largely down to predicting what the Fed will be doing in the next 6 months.
Furthermore, the inflation that hit us in 2022 was a global force that started in the US and arrived here with 6-month lag, and that global trend has now clearly turned disinflationary. In addition, the RBA has said they see financial conditions as restrictive, and just like with the US, a moderation in inflation would allow cuts back towards a more neutral setting.
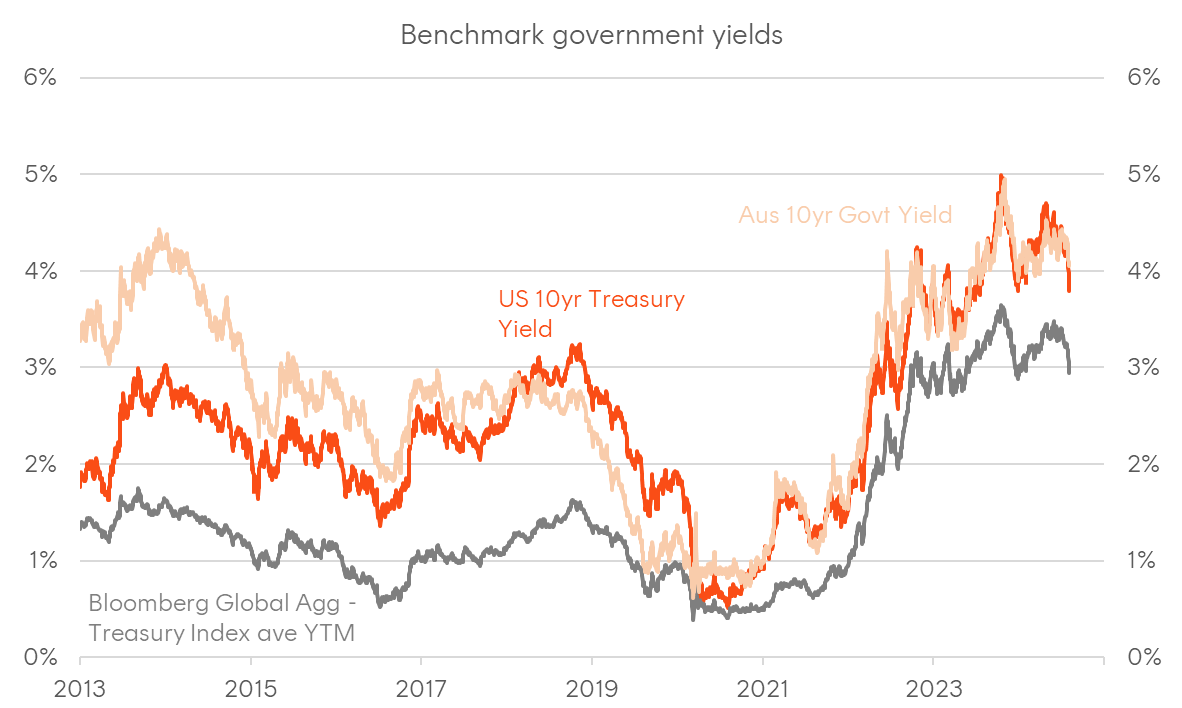
Before the CPI print, there was a compelling relative value case for AUD bonds on the idea that Australia would eventually be dragged into a global cutting cycle. While there has been a significant repricing, I still see decent value if the US hard landing scenario opens further. A US recession would likely take policy globally not only to neutral, but to accommodative levels, which might mean a cash rate here below 3 per cent.
Figure 9: Benchmark bond yields
Source: Bloomberg
Figure 10: Evolution in forward cash rate expectations
Source: Bloomberg. As at 2 August 2024.
Figure 11: Forward rate pricing compared – Australia vs the US

Source: Bloomberg. As at 2 August 2024.
The case for duration
Just to finish, I’d like to address a question I’ve been increasingly asked by clients in recent months: whether traditional fixed rate bonds still a role have to play in diversified portfolios and strategic asset allocations? The fact that this question is being asked reflects the recency bias many investors have. It’s been a challenging past three years for duration, and 2022 saw a simultaneous sell-off in both bonds and equities. So, it’s not surprising that investors are cautious about moving out of cash and floating rate instruments into duration.
I’ll leave with just a few points (and each could be an insights piece in itself):
- Over the long run, government bonds tend to outperform cash, and fixed rate corporate bonds outperform FRNs (for a given credit quality)
- High grade bonds outperform risk assets during recessions and episodes of credit stress.
- In an economic environment where growth and inflation expectations are falling, fixed rate bonds tend to be the most reliable outperformer.
- In a policy easing environment, the expected returns on cash and floating rate declines, while the expected return on duration increases, creating a self-fulfilling prophecy from tactical asset allocation decisions and investors scrambling to lock in returns
- Correlations between equities and bonds aren’t stable. When inflation is the dominant concern, correlations rise, and when growth increasingly becomes a concern, correlations fall.
- Even if rate cut expectations are already priced in, they tend to get even more aggressive during an easing cycle. Yields, being cyclical and trending, overshoot on both the upside and on the downside, which a dynamic reinforced by the large footprint of trend following strategies and other systematic investors.
