
Southern route

Tom Wickenden
5 minutes reading time
Related articles


Better investing starts here
Get Betashares Direct
Betashares Direct is the new investing platform designed to help you build wealth, your way.
Scan the code to download.
Learn more
Learn more
Betashares senior investment strategist, Cameron Gleeson, recently sat down with S&P Dow Jones Indices global head of index investment strategy, Tim Edwards, to unpack the S&P 500 Equal Weight Index, its historical performance, return drivers, and why it has recently been gaining traction with investors.
Below we look at five key takeaways from the webinar, and how Australian investors can gain exposure to the index through QUS S&P 500 Equal Weight ETF
1 – The S&P 500 Index is at its highest level of concentration in 50 years
As measured by the percentage weight of the top five holdings in the index, the market capitalisation weighted S&P 500 is at its highest levels of concentration since the early 1970’s.
Tim highlights that this gives investors two reasons to look at the equal weight index now. Firstly, high concentration gives investors the onus to manage portfolios from a risk perspective. Secondly, concentration has historically mean reverted and this has tended to be very good in relative terms for the performance of the equal weight index.
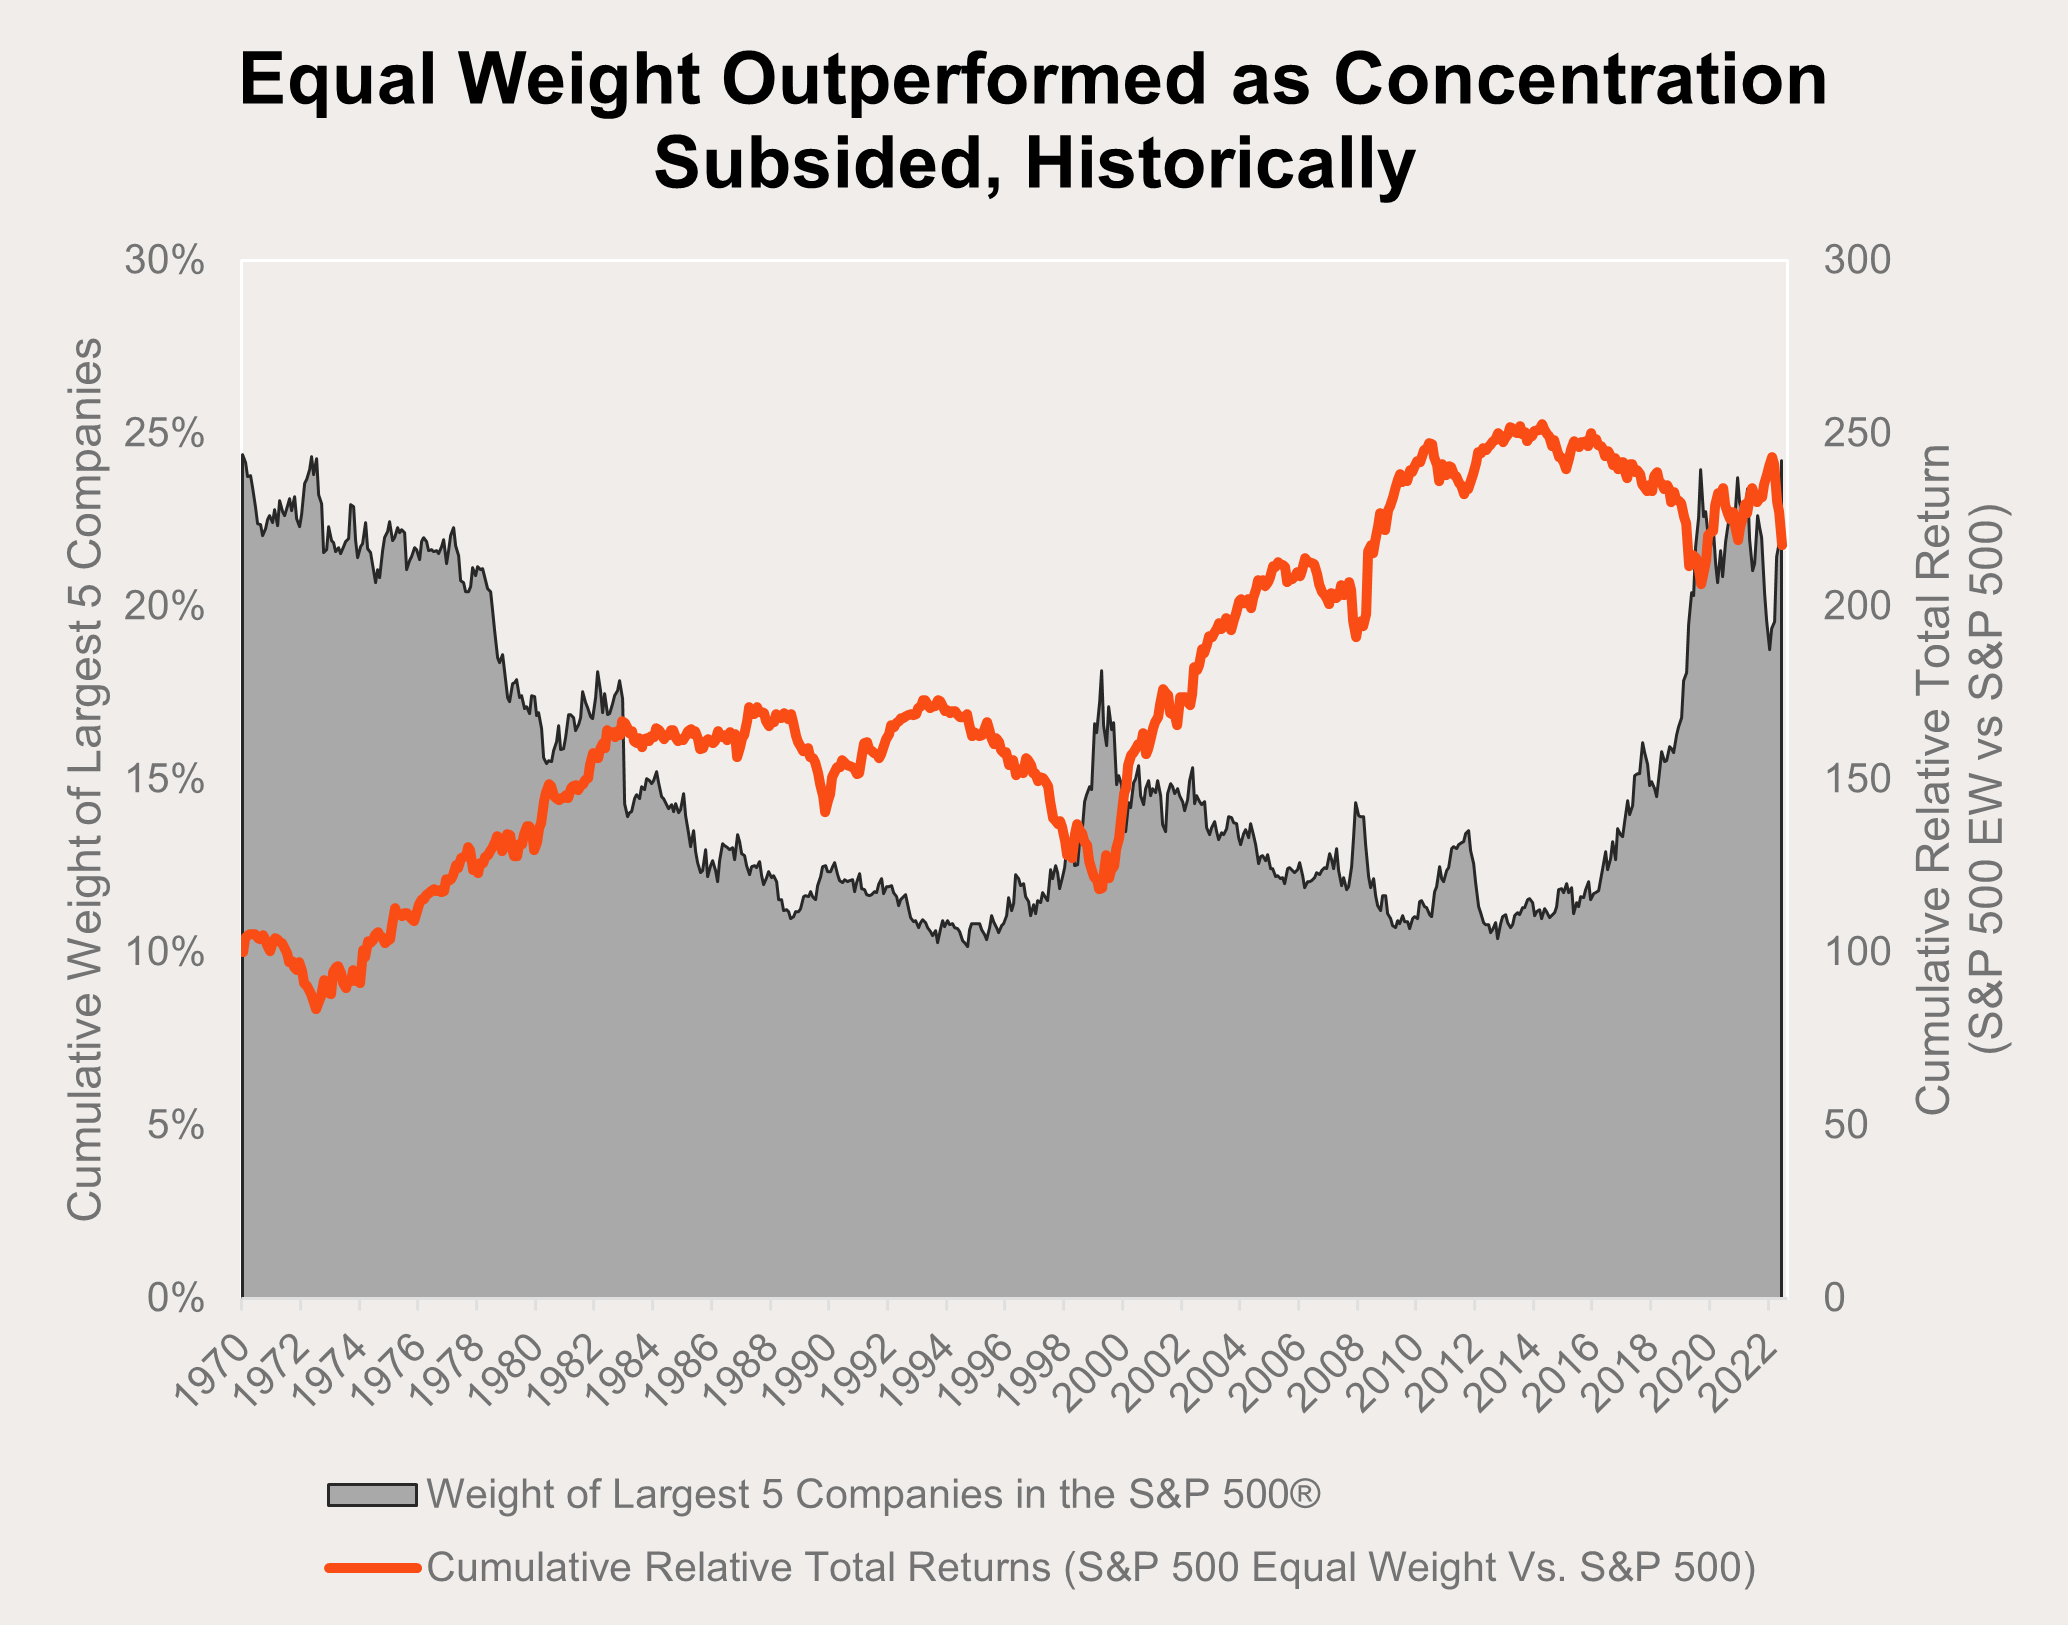
Source: S&P Dow Jones Indices LLC. Data as of 13 July 2023. Past performance is no guarantee of future results.
2 – Market breadth improving is a catalyst for equal weight outperformance
For the year to 31 May 2023, just 10 companies in the market capitalisation weighted S&P 500 contributed 11% to the index’s return, as the remaining 490 companies detracted from overall performance. In signs that this narrow source of performance is beginning to shift, the same 490 detractors contributed the majority of the index’s performance from the start of June (to 13 July 2023), as visualised below. Increased breadth in the market’s rally inherently lends itself to outperformance for an equally weighted strategy.

Source: S&P Dow Jones Indices LLC. Data as of 13 July 2023. Past performance is no guarantee of future results.
3 – The S&P 500 Equal Weight Index has outperformed 99.7% of all actively managed US large-cap core funds over 20 years
In a special 20-year anniversary edition of their ‘SPIVA’ report, the team at S&P looked at how the S&P Equal Weight index performed against US equity funds since its live inception 20 years ago. The results – the equal weight index outperformed 99.7% of all large-cap core funds over the period. Only three in every 1000 funds managed to keep pace. You can find the paper here.
In the webinar, Tim and Cameron dissect the reasons for the outperformance and why the equal weight index has qualities similar to active funds.
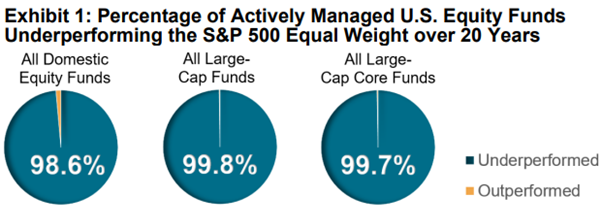
Source: S&P Dow Jones Indices LLC, CRSP. Data as of 31 January 2023. Performance based on 20-year total returns in USD. Past performance is no guarantee of future performance.
4 – The largest S&P 500 Equal Weight fund has seen contrarian inflows over the past three years
The largest fund in the US tracking the S&P 500 Equal Weight index has seen a rapid acceleration of inflows over the past three years. Traditionally, fund flows have tended to be positively correlated with recent performance. Interestingly, the S&P 500 Equal Weight flows have come at a time when market concentration in the US is increasing, and the market capitalisation weighted S&P 500 index has experienced periods of outperformance over its equally weighted counterpart.
Tim points out that the market is telling investors that now is a very interesting time to look closer at equal weighed indices as a potential compliment or alternative to market capitalisation weighted US equities.
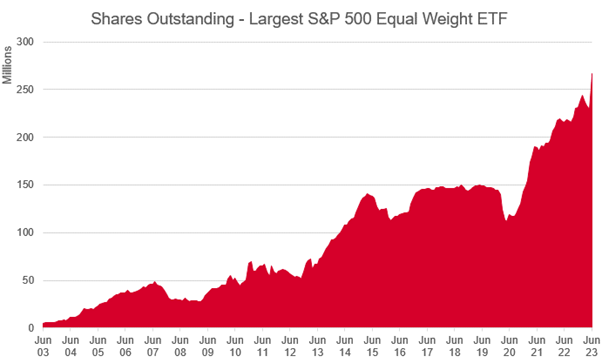
Sources: S&P Dow Jones Indices LLC, Bloomberg LLC. Data as of 7 July 2023. Past performance is no guarantee of future results. Chart is provided for illustrative purposes only.
5 – Historically the equal weight index design has lent itself to outperformance
Historically, the distribution of single company returns in the S&P 500 have lent themselves to an equally weighted strategy outperforming.
Using the 20 years to 31 January 2023 as an example, we can see below that the majority of returns fall below 3% with a long tail of companies providing much greater returns. Tim and Cameron point out that unless an investor is confident they can identify the companies that will end up in the right tail of the distribution, the most important thing is to ensure participation in all the names in the index. Without being able to identify the companies that will have the greatest returns, the optimal approach is to equal weight and not to put any more in one stock over another.
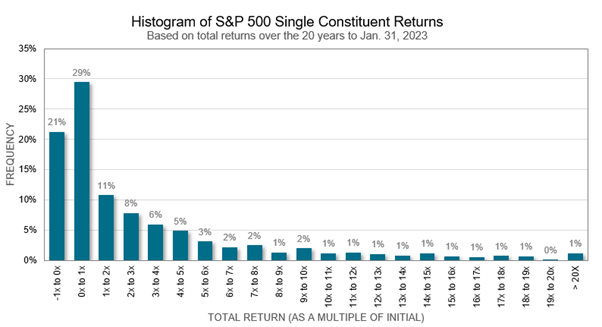
Source: “More Equal than Others: 20 Years of the S&P 500® Equal Weight Index”, S&P DJI Research, June 2023. S&P Dow Jones Indices LLC, CRSP. Data as of 31 January 2023. Past performance is no guarantee of future results.
How to gain exposure
QUS S&P 500 Equal Weight ETF aims to track the performance of the S&P 500 Equal Weight Index (before fees and expenses). The Index provides cost-effective exposure to 500 leading US companies, in a single ASX trade. Equal weighting approach reduces the risk of the portfolio being heavily exposed to a small number of ‘mega cap’ companies.
There are risks associated with an investment in QUS, including market risk, index methodology risk, country risk and currency risk. For more information on risks and other features of QUS, please see the Product Disclosure Statement and Target Market Determination, both available at www.betashares.com.au.
Explore
Markets