
Betashares Australian ETF Review: May 2026

Ilan Israelstam
3 minutes reading time
Related articles

Better investing starts here
Get Betashares Direct
Betashares Direct is the new investing platform designed to help you build wealth, your way.
Scan the code to download.
Learn more
Learn more
January 2023 Review: New Year, new all-time highs!
The year 2023 started with a bang for the Australian ETF industry, with the global sharemarket rebound and net investor inflows causing the industry to grow to a new all-time high in assets under management. Read on for details, including best performers, asset flow categories and more.
Exchanged Traded Funds Market cap
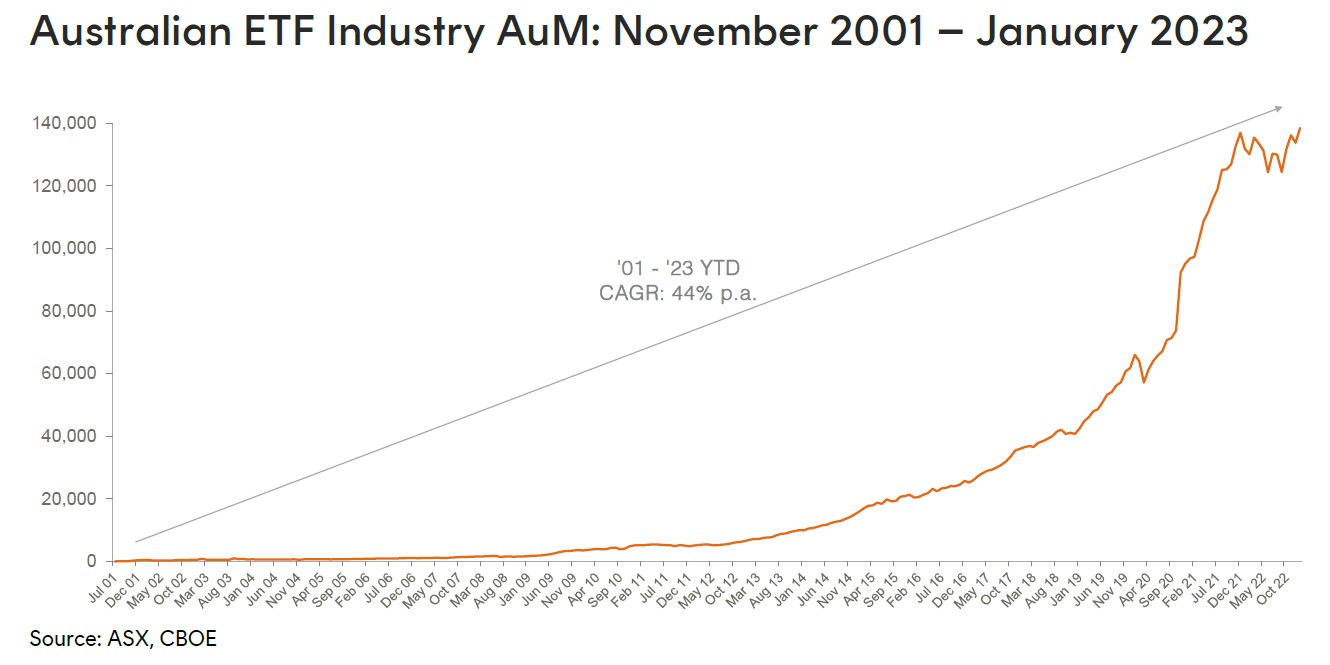
- Australian Exchange Traded Funds Market Cap(ASX + CBOE): $138.5B – new all time high
- Market cap increase for month: 3.6%, $4.7B
- Market cap growth for last 12 months: 5.1%, $6.7B
Comment: The Industry’s AuM grew 3.6%, for a total monthly market cap increase of $4.7B. Industry assets under management ended the first month of the year at $138.5B, eclipsing the all-time record set back in December 2021.
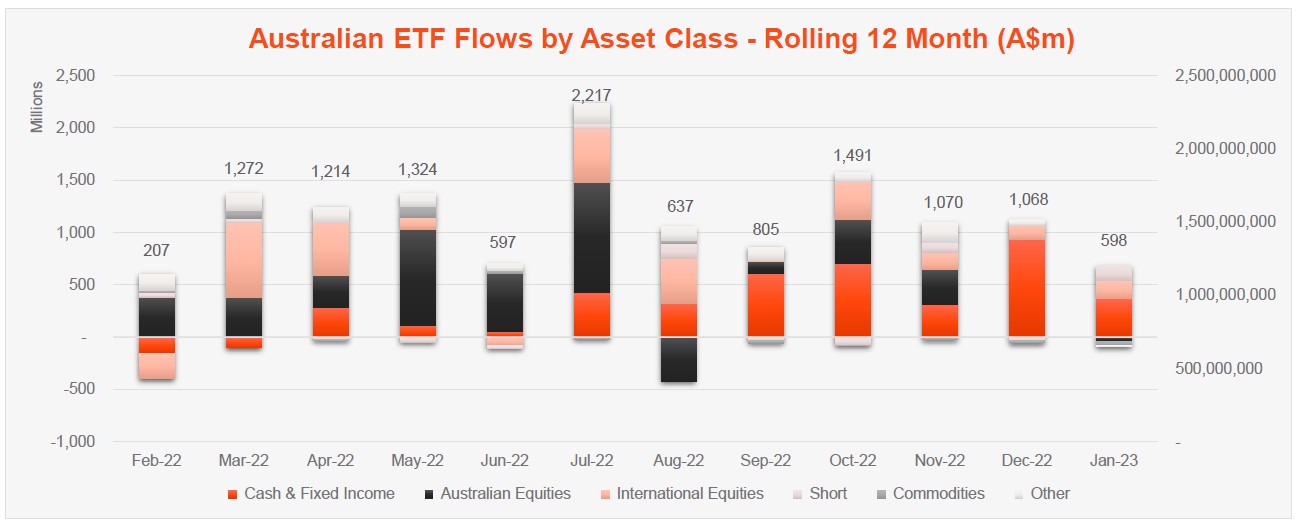
New money
- Net inflows for month: +$0.6B
Comment: The sharemarket rally contributed the bulk of industry growth this month, with only ~12% of the growth attributable to net flows (net new money), which amounted to $0.6B.
Products
- 322 Exchange Traded Products trading on the ASX
- 3 new products launched this month 3 active ETFs and 2 new issuers on ASX: Milford launched an Australian hedge fund and Alphinity launched two global equity Active ETFs
Trading value
- ASX ETF trading value increased 5.1% for the month, for a total of $7B
Performance
It was a dramatically positive month for performance in the crypto space which recorded a significant turnaround. As such our CRYP Crypto Innovators ETF was the best performer in the industry this month, returning ~48% for the month. Tech also rebounded heavily and so tech-focused exposures rallied – our , for example, returning 15% for the month.
Top 5 category inflows (by $) – January 2023
| Broad Category | Inflow Value |
| Fixed Income | $233,246,076 |
| International Equities | $169,446,625 |
| Short | $147,560,057 |
| Cash | $135,908,948 |
| Multi-Asset | $11,655,465 |
Top category outflows (by $) – January 2023
| Broad Category | Inflow Value |
| Commodities | ($42,411,808) |
| Australian Equities | ($37,916,695) |
| Listed property | ($16,002,534) |
| Currency | ($3,682,746) |
Top sub-category inflows (by $) – January 2023
| Sub-category | Inflow Value |
| Cash | $135,908,948 |
| International Equities – US | $100,372,366 |
| US Equities – Short | $98,498,916 |
| Global Bonds | $97,284,639 |
| Australian Bonds | $97,127,400 |
Top sub-category outflows (by $) – January 2023
| Sub-category | Inflow Value |
| Australian Equities – Sector | ($62,074,626) |
| International Equities – Sector | ($43,855,303) |
| Australian Equities – E&R – ESG Lite | ($43,634,390) |
| Gold | ($42,139,876) |
| International Equities – Europe | ($39,199,886) |
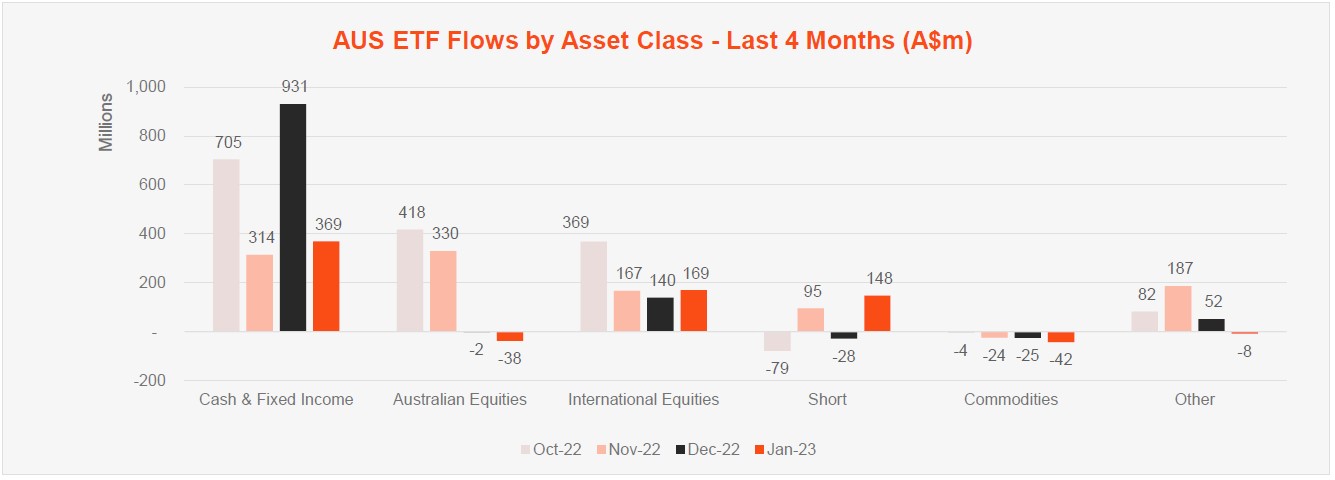
Comment: As has been the case for the last few months, we once again saw the Fixed Income category receiving the highest level of inflows ($233m) followed by International equities ($169m), with investors this month shunning the usually popular Australian equities category which received net outflows of $38m. Notably, however, and notwithstanding the strong gains for the month, investors continued to buy Short exposures which received ~$150m of net inflows – potentially illustrating that investors believe the worst is not yet over for the sharemarkets.
Finally, this month we saw a notable, and rare, change at the top end of the ETF manager ‘league table: Betashares jumping a place to become the 2nd largest ETF manager in Australia ahead of iShares as at end January.
*Past performance is not an indicator of future performance.
Explore
ETF industry