
Betashares Australian ETF Review: May 2026

Ilan Israelstam
3 minutes reading time
Related articles


Better investing starts here
Get Betashares Direct
Betashares Direct is the new investing platform designed to help you build wealth, your way.
Scan the code to download.
Learn more
Learn more
March 2023 Review: Investor flows push industry to a new high, even as markets decline
The strong rise in global sharemarkets together with continued investor flows allowed the Australian ETF industry to once again set a new all-time high in funds under management (FuM). Read on for details, including best performers, asset flow categories and more.
Exchanged Traded Funds Market cap
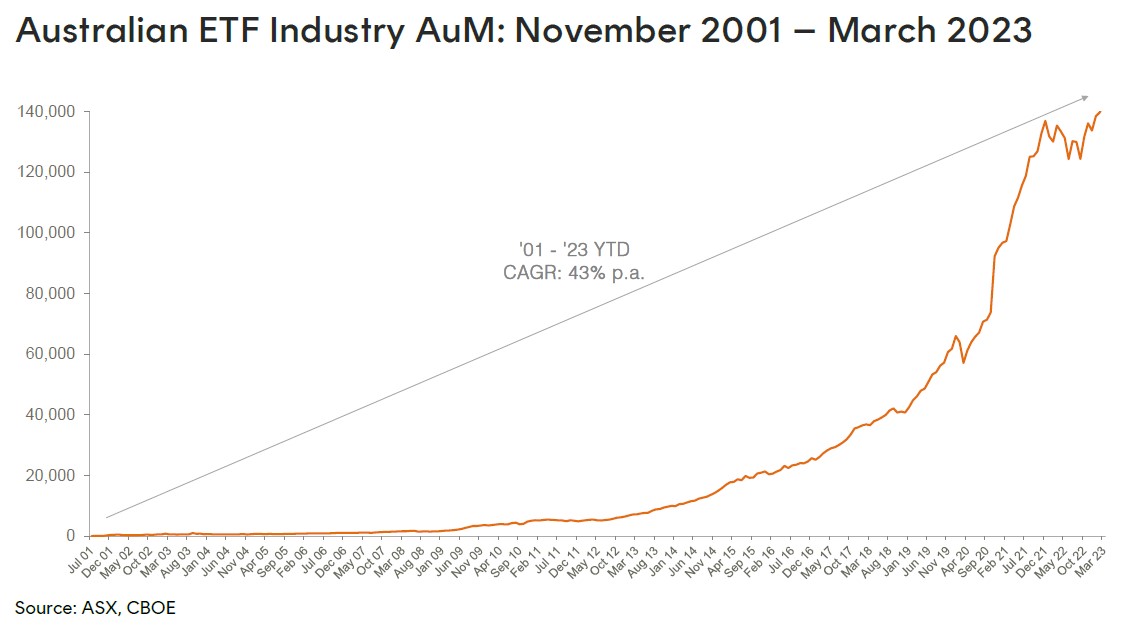
- Australian Exchange Traded Funds Market Cap(ASX + CBOE): $142.6B – new all time high
- Market cap increase for month: 2.0%, $2.8B
- Market cap growth for last 12 months: 5.3%, $7.2B
Comment: The Australian ETF Industry’s FuM grew by 2.0% month-on-month, for a total monthly market cap increase of $2.8B. Industry funds under management ended the month at $142.6B, a new record high.
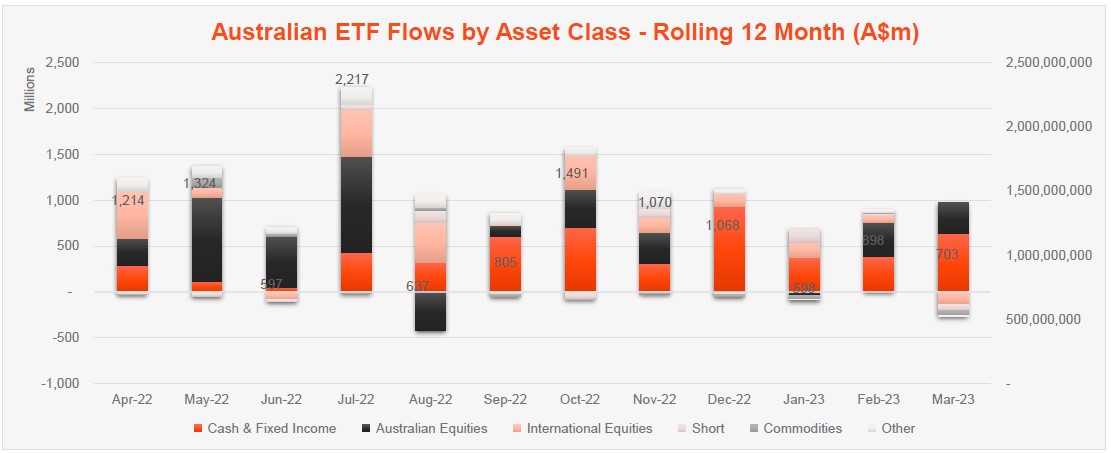
New money
- Net inflows for month: +$0.7B
Comment:The growth this month came primarily from asset value appreciation, although investor flows remained positive, at $0.7B (25% of the monthly growth).
Products
- 327 Exchange Traded Products trading on the ASX
- 2 new products launched this month, both Active ETFs, an ESG oriented credit strategy from Janus Henderson and Intelligent Investor’s Value Share Fund
Trading value
-
-
- ASX ETF trading value increased 5.3% for the month, for a total of $11.1B, the highest level since March 2022.
-
Comment: Over the last 12 months, we’ve seen the industry grow in size, albeit at a far slower pace than previous years – with an increase of 5.3% year on year, or $7.2B
Performance
Growth exposures came back into vogue in March, leading to strong gains in Bitcoin and Crypto products, as well as Technology exposures more generally. Gold Mining exposures also rallied strongly.
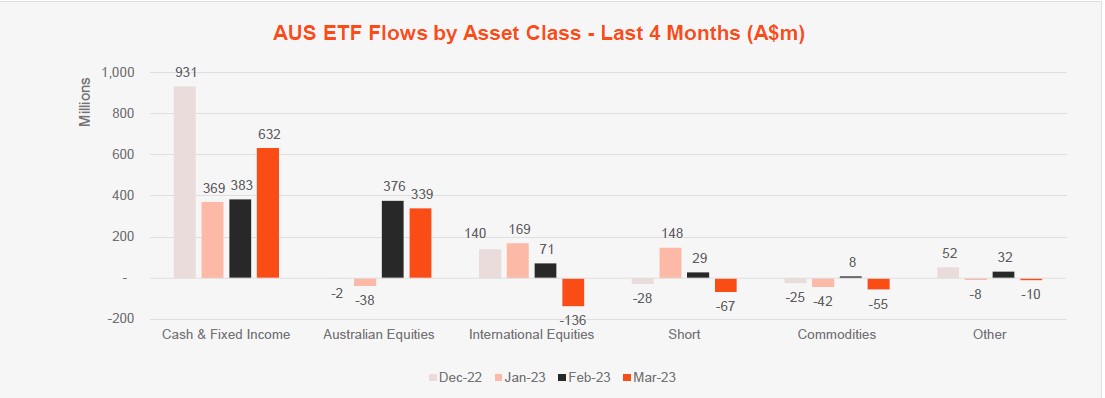
Top 5 category inflows (by $) – March 2023
| Broad Category | Inflow Value |
| Fixed Income | $350,829,488 |
| Australian Equities | $338,596,467 |
| Cash | $281,326,392 |
| Multi-Asset | $10,416,977 |
Top category outflows (by $) – March 2023
| Sub-Category | Inflow Value |
| International Equities | ($136,242,747) |
| Short | ($66,753,950) |
| Commodities | ($55,055,027) |
| Currency | ($15,146,176) |
| Listed Property | ($5,296,704) |
Comment: Fixed Income exposures lead the way in terms of flows with the category recording the highest level of net flows this month ($350m) and also in the year to date. Broad Australian equities products also continued to receive flows, as has been the case for the year more broadly.
Top sub-category inflows (by $) – March 2023
| Sub-category | Inflow Value |
| Cash | $281,326,392 |
| Australian Bonds | $185,850,873 |
| Australian Equities – Broad | $134,206,111 |
| Australian Equities – High Yield | $125,194,559 |
| Global Bonds | $115,460,449 |
Top sub-category outflows (by $) – March 2023
| Sub-Category | Inflow Value |
| International Equities – Developed World | ($108,215,705) |
| Gold | ($67,887,918) |
| Australian Equities – Short | ($63,676,009) |
| International Equities – Europe | ($40,861,619) |
| International Equities – US | ($26,873,060) |
*Past performance is not an indicator of future performance.
Explore
ETF industry
2 comments on this
Historical issues are reliable and easy to get.
What about medium to longer term best predictions. These are of interest to investors not historical matters.
Hi Leo,
The purpose of the ETF Review is to provide data on fund flows, which is by nature historical. We publish other content that provides analysis and outlooks.
Regards,
Patrick