
Chamath De Silva
11 minutes reading time
The soft landing narrative matures and ghosts from the recent past
With the January FOMC now behind us, an increasing number of asset allocators have adopted the soft landing scenario as their base case. Although there are compelling arguments supporting this outlook, I feel that it’s already largely reflected in asset prices. Nevertheless, the recent stretch of ‘good’ inflation data – echoing Powell’s characterisation of the past six months – does support US CPI and Core PCE moving towards the Fed’s 2% target.
While some uncertainty lingers around the ‘super core’ categories within CPI, it’s not the recent inflation prints that are currently of concern to the bond market and driving the recent bounce in yields, but rather, the upside surprises in activity and labour market data. Last Friday’s scorching jobs report (NFP +353k vs +185k exp and last month’s reading revised upwards from +216k to +33k, with average hourly earnings also ticking higher) and this week’s stronger-than-expected services ISM at a time when manufacturing (the weakest part of the US economy) now appears on the rebound, greatly increase the likelihood of a mid-cycle re-acceleration.
The January FOMC meeting saw Chair Powell suggest inflation remains the singular focus and rate cuts will be determined by more data affirming the disinflationary trend, rather than requiring the economy to weaken. My concern lies with the potential for a revival in inflationary pressures, driven by economic and market-related animal spirits, at a time when supply side conditions might deteriorate.
Disinflation in goods has done most of the heavy lifting in bringing down inflationary pressures. This has arguably been due to supply chain pressures normalising over the past 12 months. The New York Fed’s monthly global supply chain pressure index (GSCPI) — drawing on data from the Baltic Dry Index, Harpex Index of Container Charter Rates, and supply chain related components of global PMIs — highlights a notable relationship between supply chain pressures and headline inflation over the last two years, with the GSCPI appearing to lead selected headline CPI components by several months. The unfolding events in the Red Sea, should they significantly disrupt global shipping, could reignite goods inflation and maintain inflation levels well above the 2% target, the baseline “risk” scenario Powell outlined in the most recent Q&A.
A return of supply chain disruptions is definitely a right-tail risk for rates, while the ghosts of another recent development, regional banking stress, could have the opposite effect. The challenges in the commercial real estate sector, particularly in the US, are well-documented but have recently prompted a significant sell-off in New York Community Bankcorp shares (-40%), following unexpected loan loss provisions. This incident, alongside the distress in a Japanese regional bank Aozora (which is down over 30% since disclosing US CRE-related losses) underscores the interconnectedness of global markets and the potential for regional issues to precipitate wider market volatility.
On the flipside, the Fed’s latest Senior Loan Officer Opinion Survey (SLOOS) suggested that conditions in the regional banking sector are actually improving, with the share of US banks tightening lending standards actually declining.
It’s hard to know what to make of all this, apart from investors probably being better served in keeping their portfolios adaptable and flexible so they can take advantage of opportunities arising from market stress, rather than selecting exposures based on a particular event occurring.
Closer to home
Turning to Australia, inflation trends largely mirror those in the US, albeit with a lag of several months. The official Q4 CPI data prompted the RBA to revise its inflation forecasts downward (Dec-2024 y/y headline reduced to 3.2% from 3.5% in the November forecast and trimmed mean reduced to 3.0% from 3.3%) and bring forward the expected timing of inflation returning to the upper bound of the target band to June 2025 from December 2025. This further reinforces expectations the Bank is done with rate hikes. However, the February statement did highlight that services inflation could remain sticky and was marginally hawkish in its language.
Further to this, the Aus-US 10-year yield spread also compressed to trade around parity, consistent with the view that the risk of overheating is much lower here compared to the US.
It’s worth noting that the RBA introduced some major changes at this month’s meeting, including a post-decision press conference as standard, and timing the release of the Statement on Monetary Policy (SOMP) to coincide with the policy statement. The SOMP also saw a structural overhaul to make it more readable to the lay person.
Following the recommendations from last year’s Review, the RBA will cut the number of meetings down to eight. The Board will meet in March, May, June, August, September, November and December, similar to the FOMC’s meeting schedule.
Figure 1: Benchmark government yields
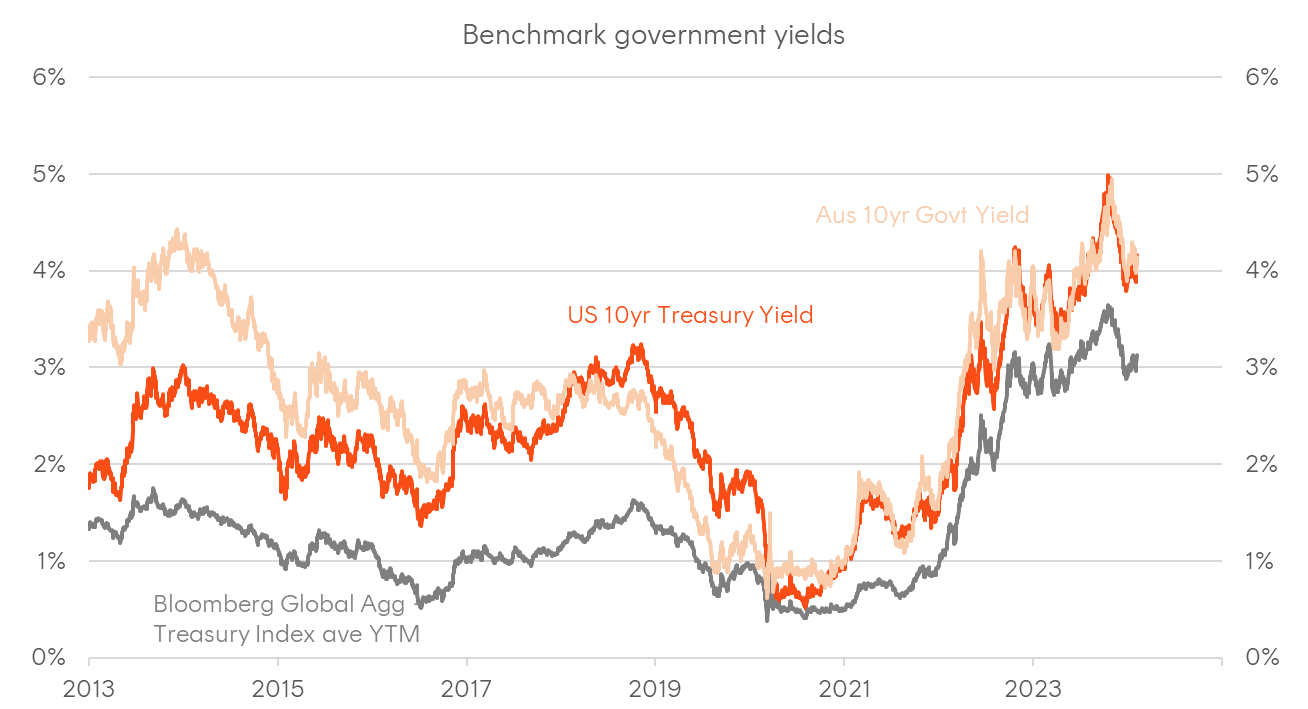
Source: Bloomberg. Past performance is not an indicator of future performance.
Figure 2: US inflation
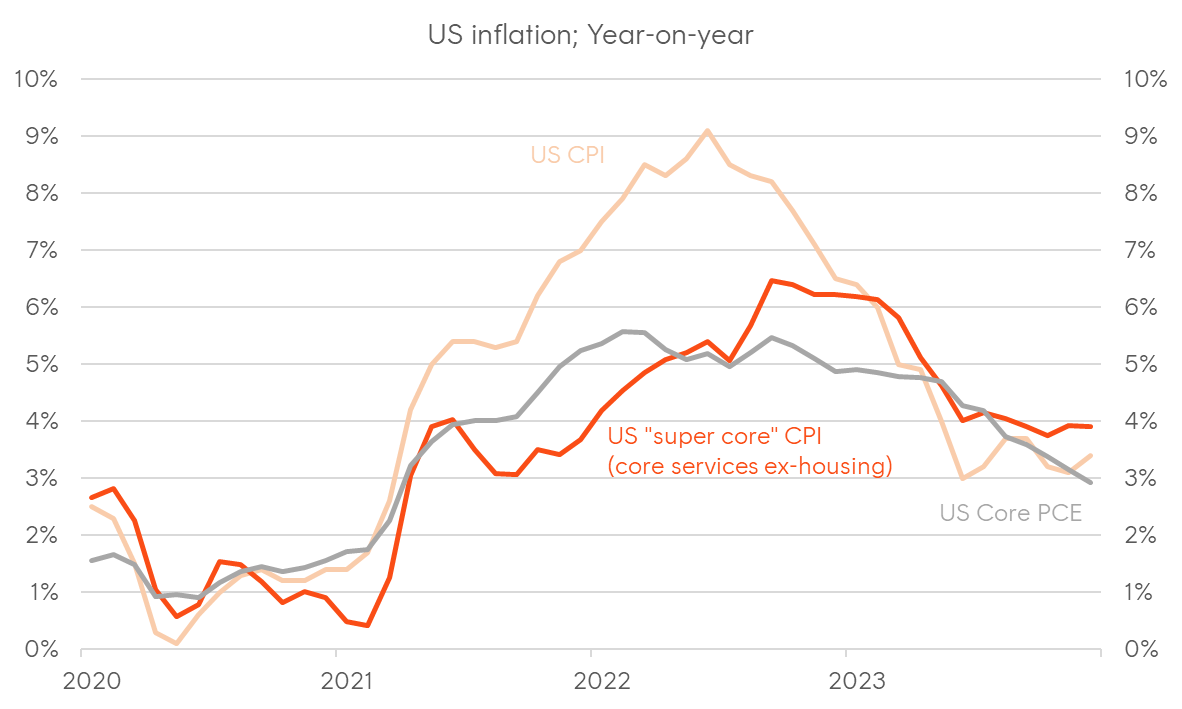
Sources: BLS, BEA, Bloomberg; as at 31-Dec-2023
Figure 3: US inflation and global Supply Chain Pressure Index
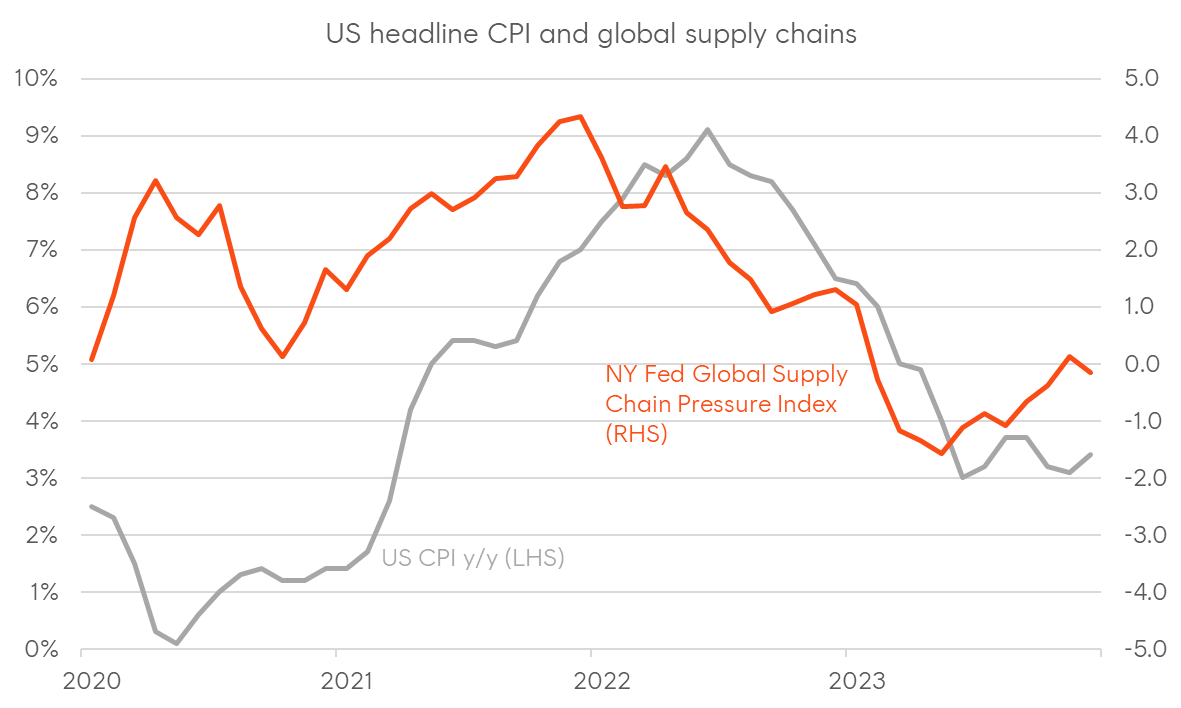
Sources: Blomberg, BLS, NY Fed
Figure 4: Citi economic surprise indices
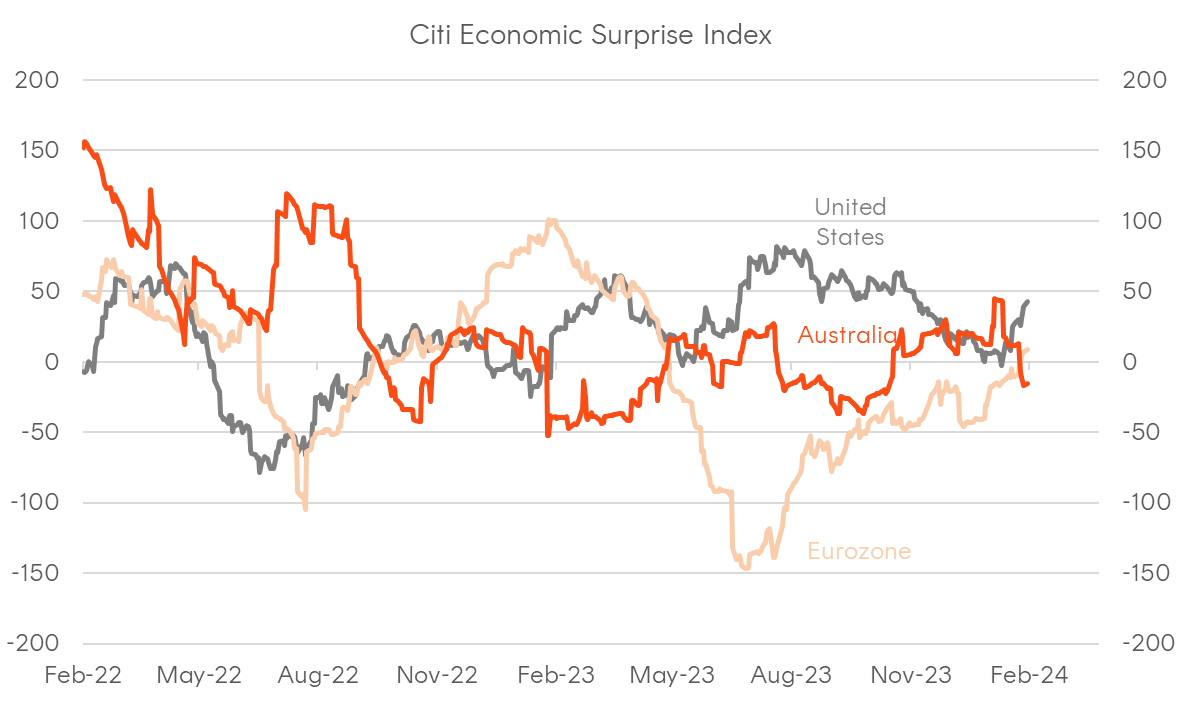
Source: Bloomberg, Citi
A deep dive into market pricing
Asset markets are forward looking, meaning it’s not necessarily ‘events’ that move the needle, but surprises and changes in expectations. I’ve said this ad-nauseum now, but what matters for bond markets and the decision to tactically add duration is not so much whether or not the RBA or Fed cuts, but rather whether their cut is more or less what’s priced in (in addition to changes in medium-term forward rate pricing).
Since the January FOMC meeting, market expectations have undergone some notable shifts. The implied probability of a March cut moved from 60% to just 17% over the past week, after being as high as 90% in late December. This move was largely on the back of the upside surprises in US data.
Looking out at the rest of the year, the forward rates markets are still pricing in an aggressive Fed easing cycle, with four to five rate cuts priced in to commence in the second half of the year, a significant paring back from the six to seven that were priced in a few weeks ago.
We can view the implied probability distribution by looking at market for options on SOFR futures. Longer term, these markets suggest short rates will bottom out at around 3.5% in late 2025, with the ‘terminal’ rate now around 4%.
Now, what’s interesting is that despite the 12-month forward rate being around 3.8% (five to six cuts), the options market suggests that the probabilities of each 50-basis point increment between 3.0% and 6.0% is broadly similar, suggesting the market is equally confident of an aggressive easing cycle (200 basis points of cuts) as a moderate one (e.g. 100 basis points of cuts).
The other interesting point to note is there is still notable hedging of right-tail risks (e.g. rates > 8%) going out two to three years, and any unwind of such hedges could support a fresh decline in long-term yields as implied medium term forward rates reprice lower. In contrast, hedging activity of a deep recession or financial crisis is minimal, based on the very low implied probability of rates falling to 1% or lower.
Figure 5: Option implied probability distributions for US interest rates (options on 3-month SOFR futures, March-2025, March 2026 and March 2027)
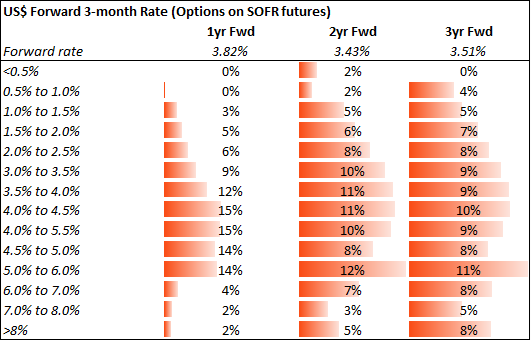
Sources: Bloomberg, Betashares; As at 5-Feb-2024
In Australia, immediately following the February RBA board meeting, we have two cuts priced in for this year, both of which are expected in the second half of the year.
Constructing a longer-term probability distribution is much harder than for the US due to the dearth of available options pricing data. One alternative approach is to use forward rate pricing (either OIS or cash rate futures) to produce a binominal probability distribution. This means taking the implied probability of a rate move/no move at each meeting and branching it out for the subsequent meeting. Now, the big disadvantage is this approach won’t capture the tails of the distribution as there can only be two possible outcomes at any meeting. But it provides an easy way to get a better handle on the belly of the probability distribution, with the modal outcome being three rate cuts.
Figure 6: Binomial model-implied probability distribution from RBA cash rate futures
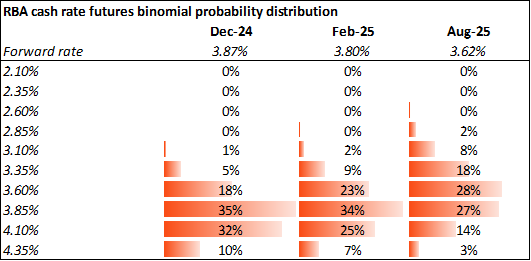
Sources: Bloomberg, Betashares. As at 6-Feb-2024
Treasury issuance, Fed’s balance sheet revisited, and the end of QT?
Supply was one of the key catalysts behind 2023’s bond market volatility, and this week saw the release of the Treasury’s Quarterly Refunding Announcement (QRA), with the composition of issuance (bills vs bonds) hitting the wires just before the FOMC decision. The issuance quantity came in below market expectations, while the duration profile was largely in line. Bills outstanding are likely to remaining near the Treasury Borrowing Advisory Committee’s upper “limit” of 20% of total Treasury debt.
Following the disruption that the July QRA caused, the Treasury is very keen to ensure that its issuance announcements pose no major problems for market function and cease becoming a risk event. However, with the US budget deficit still running above 6% of GDP, continued elevated levels of issuance are basically assured. Treasury will need to be ever more vigilant in managing the duration profile to prevent market indigestion.
That said, the elephant in the room remains QT, especially given the aggregate quantity of bank reserves in the system. Reserves are the largest component of the liability side of the Fed’s balance sheet, and are now approaching the apparent target levels of 10% of nominal GDP. This triggered expectations that we’ll soon see a taper from the current run-off pace of US$60b/month in Treasuries and US$35b in MBS.
In the post-GFC world, the Fed adopted a so-called ‘Ample Reserves’ regime, which focuses on keeping the quantity of bank reserves fairly abundant, as opposed to the prior policy where reserves were encouraged to remain at a bare minimum. The prior tightening cycle of 2016-2019 tested the floor at which reserves drop to a level that could create liquidity stresses in short-term funding markets, and it’s likely the Fed will try and avoid such a scenario repeating.
Further supporting the idea of tapering (or even ending) QT is the fact that the Fed’s reverse repo facility (RRP) has been quickly shrinking in recent months. This facility is often seen as a proxy for excess liquidity, and a reduction implies that money market funds (the main users of the RRP) are returning to the T-bill market as the preferred way of parking short-term cash.
Putting all this together, my view is that while a US soft landing remains the base case, it’s already in the price . What’s arguably underpriced is the risk of the US economy overheating again over the next couple of quarters. Employment remains strong, just at a time when manufacturing is coming out of recession, and combined with shipping disruptions working their way downstream over the coming months, there is a risk of Powell’s fears being realised.
As such, I’m still very cautious on US duration right now, even if I think long-term yields have peaked for the cycle. In contrast, I remain constructive on domestic fixed income, given the degree of rate cuts pricing is far more modest in Australia, while our economy is running much slower than the US.
Pockets of credit stress continue to pop up, but nothing appears systemic. The biggest risk to spreads blowing out over the medium term isn’t recession risk, but rather, interest rate volatility re-expanding if more rate cuts are removed from US market pricing.
Figure 8: Fed’s balance sheet
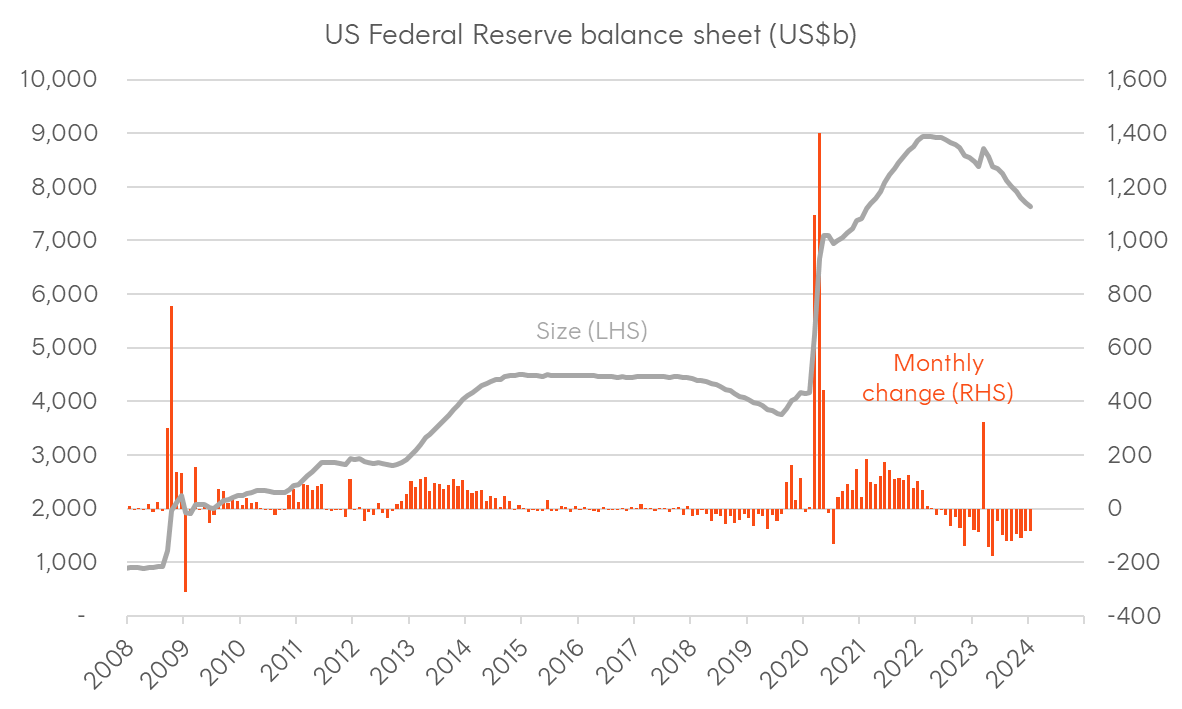
Source: Fed, Bloomberg
Figure 9: US bank reserves as share of nominal GDP
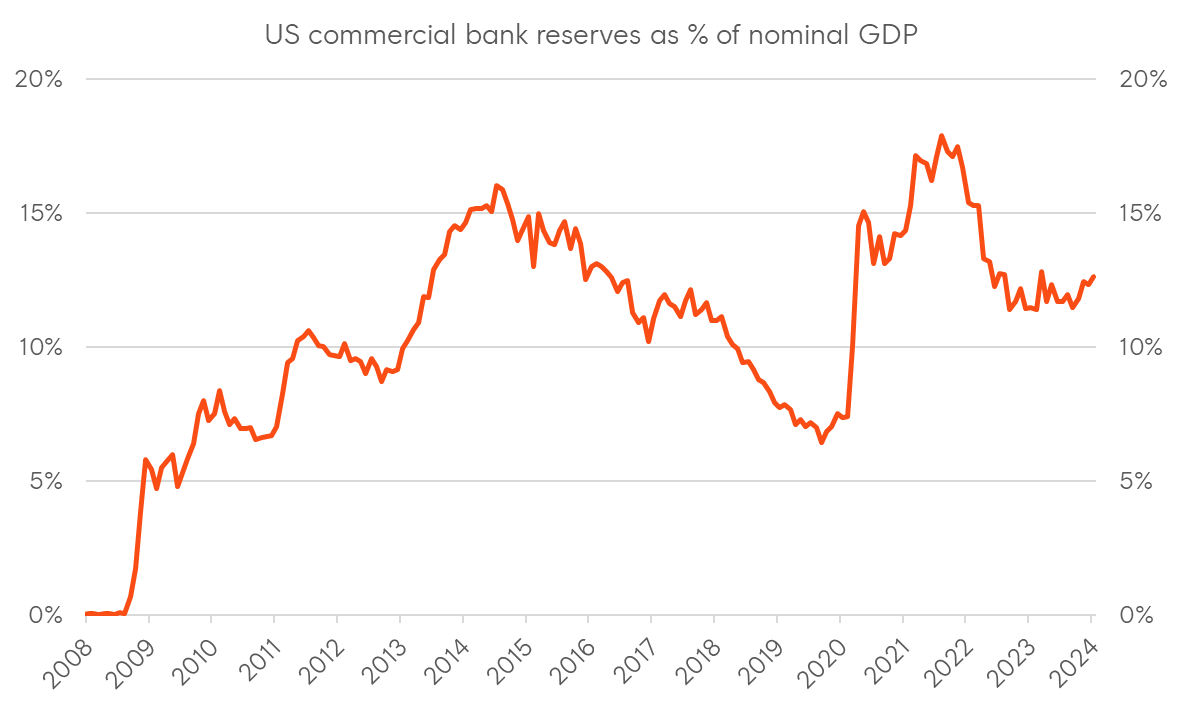
Source: Fed, Bloomberg
Figure 10: Fed’s reverse repo facility (RRP)
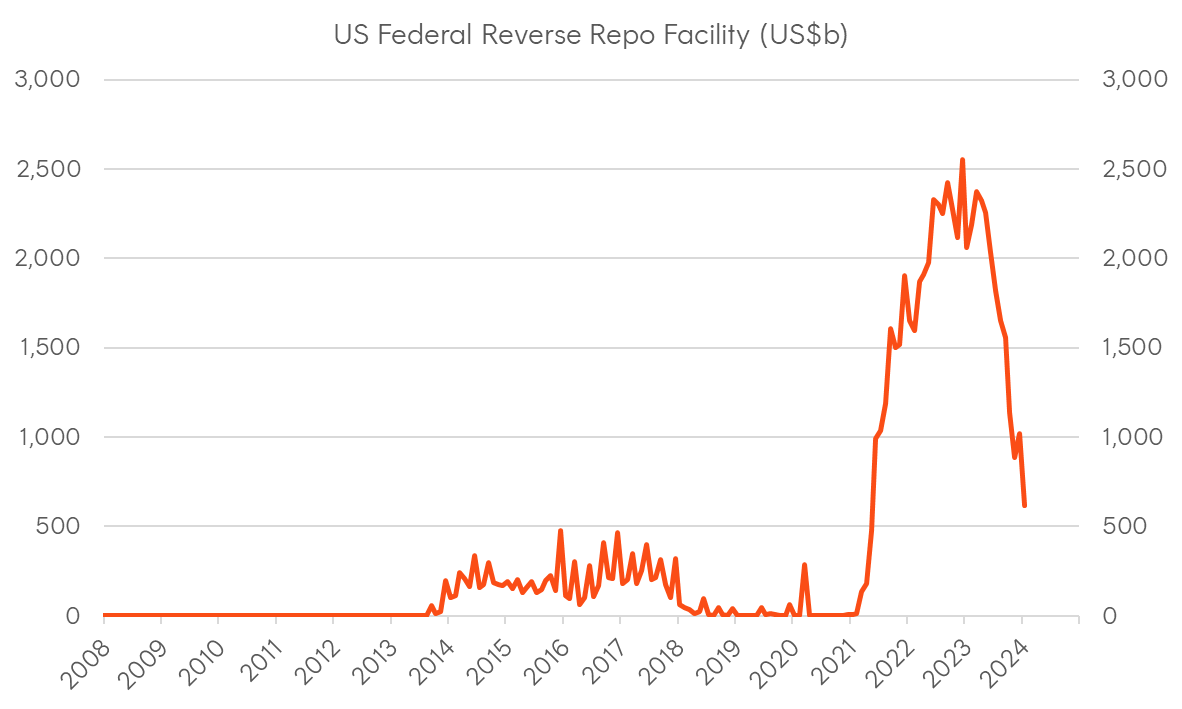
Source: Fed, Bloomberg