Investment strategy: Can gold go higher?
8 minutes reading time
- Sector & regions
- Thematic
Constructing a well-diversified portfolio has been challenging in an environment of inflation uncertainty. But what if there was an investment exposure that could not only benefit in an inflationary environment but also provide opportunity for a return profile with a lower correlation to your client’s core equity allocation?
Holding a diversified basket of global royalty companies can help dampen portfolio volatility during periods when bonds are less effective at providing equity diversification.
In this article, we explore how royalties may provide a unique investment solution that can complement an existing portfolio of shares, and some of the interesting companies in this space.
Why you should consider royalty companies within a diversified portfolio
Royalties generate a stream of payments for the royalty owner for the use of:
- a physical asset, such as an oil field to extract oil, or
- patented intellectual property (IP), that might relate to music, a drug or even semiconductor chip designs.
The unique business model of royalty companies means they have a very different return profile to broad equity market benchmarks. ROYL Global Royalties ETF , aims to track an index (before fees and expenses) of global royalty companies, an exposure that has historically exhibited a correlation to the MSCI World index of 0.481, thereby providing diversification benefits from broad market equities.
But the key to this diversification benefit is timing – specifically when royalty companies have tended to outperform. As shown in the chart below, periods of outperformance have typically coincided with rising stock/bond correlation over this period (from Nov 2018 to May 2024, shaded in blue) i.e. when bonds are less effective at diversifying equity risk.
Chart 1: ROYL’s Index 12mth excess return vs MSCI World and 12mth rolling correlation of stocks and bonds
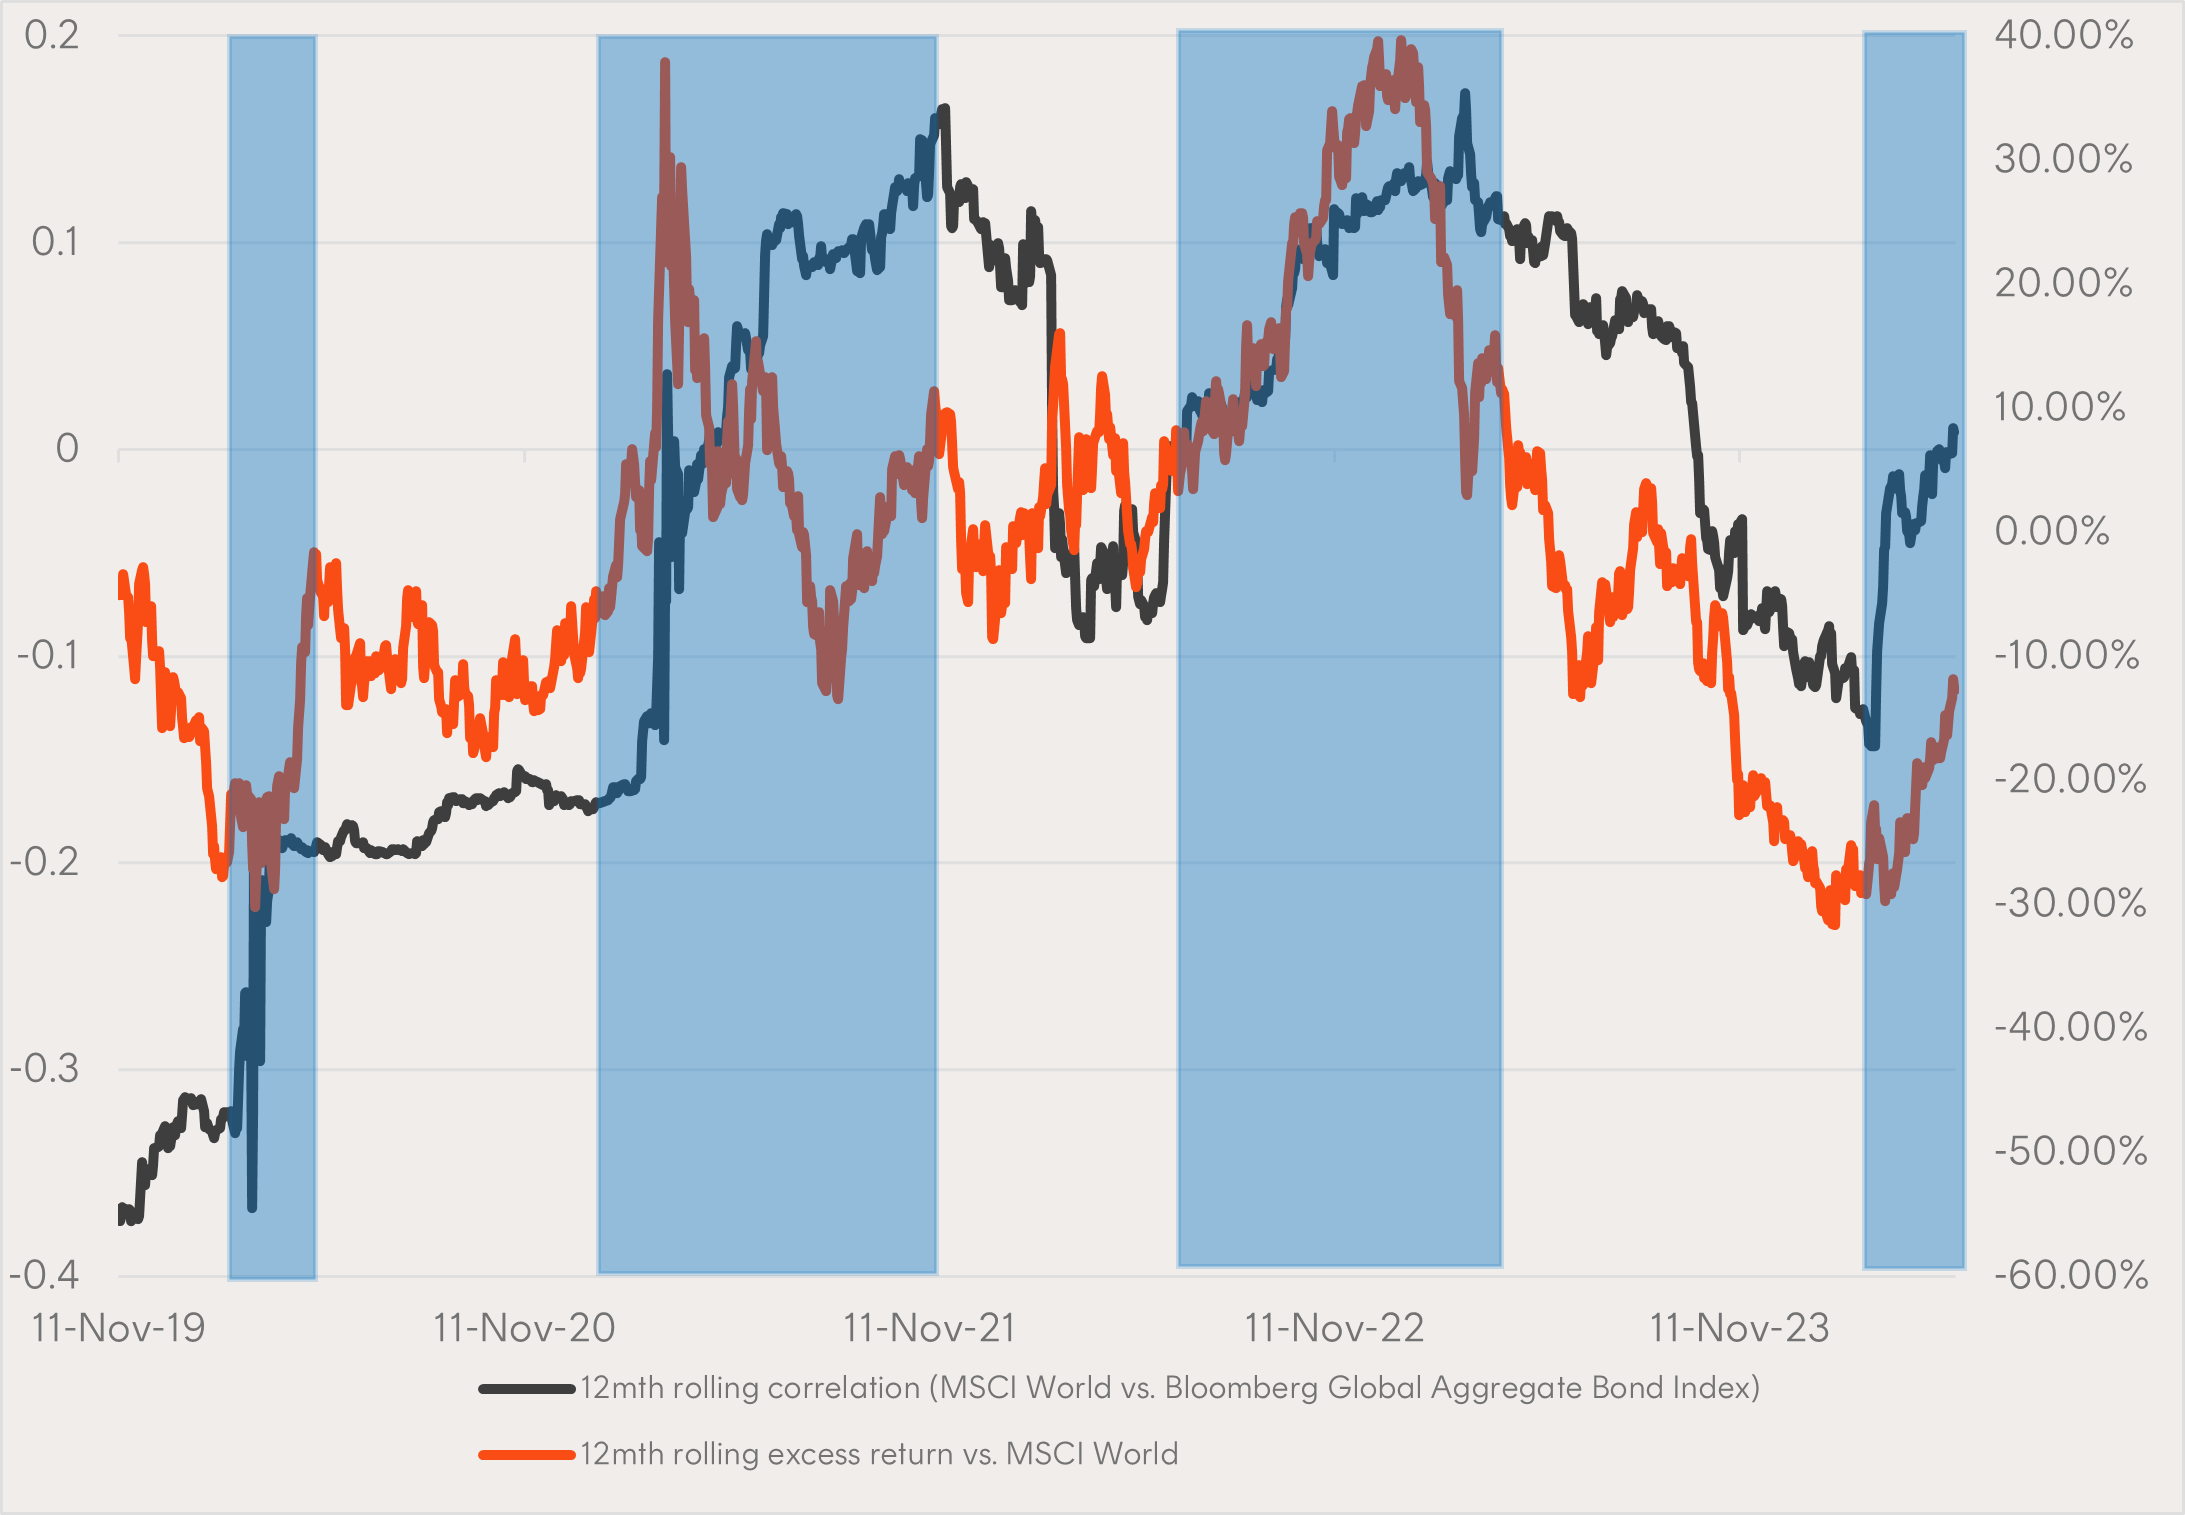
This makes such an exposure an additional potential diversifier within a typical ‘balanced portfolio’, especially at times when your traditional asset classes such as bonds (as proxied by the Bloomberg Global Aggregate Bond Index) are less effective.
Not only that, in an environment where inflation is proving somewhat stubborn, the historic relationship between the performance of the index ROYL aims to track and market implied inflation expectations has exhibited a high correlation (as shown in the chart below). This relationship becomes apparent once we understand how royalty businesses operate.
Chart 2: Solactive Global Royalties Index v US 10 Year inflation break-evens
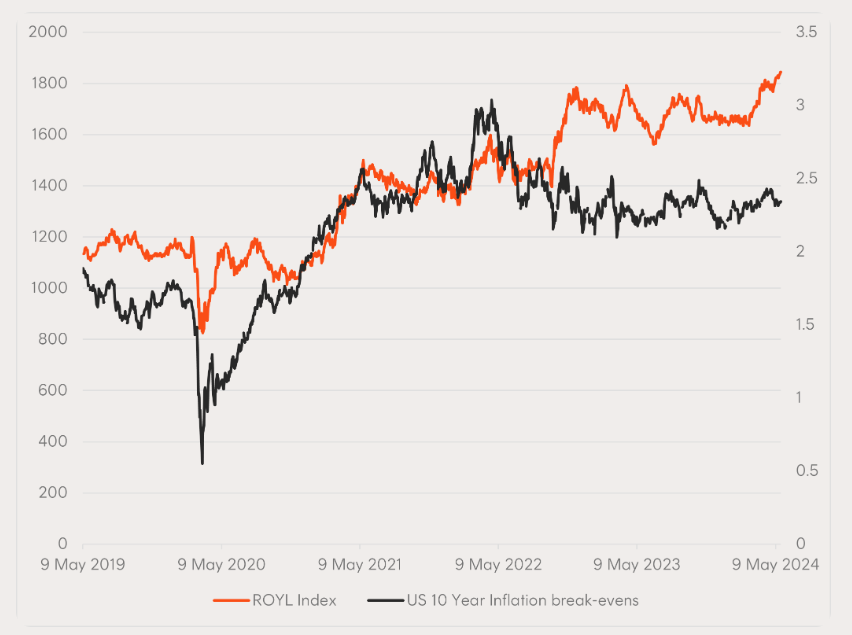
Source: Bloomberg. Past performance is not an indicator of future performance of the Index or ROYL. Chart shows performance of the index which ROYL aims to track, not the actual past performance of ROYL. Index performance does not take into account ROYL’s management costs of 0.67% p.a. ROYL’s inception date was 9 September 2022.
The Royalties business model – potential for high margins, low operational risk
One of the key advantages of many royalty businesses is their ability to earn recurring revenue streams that are directly linked to the sale prices (and hence inflation) of goods or services produced from companies using either the assets or the IP of the royalty owner.
However, the royalty company itself generally avoids exposure to the production costs and broader operational and financial risks associated with running a business using the asset or making the final goods or services.
This means that companies that own and manage royalties tend to have relatively low capital requirements and have the potential to enjoy recurring revenue streams linked to inflation with less exposure to the rising input costs from raw materials or labour.
As evident in the charts below, companies included in the index tracked by ROYL have enjoyed higher gross margins and return on capital than a global equity benchmark over the five years to 21 May 2024.
Chart 3: Average Gross Margin of Solactive Global Royalties Index versus MSCI World Index
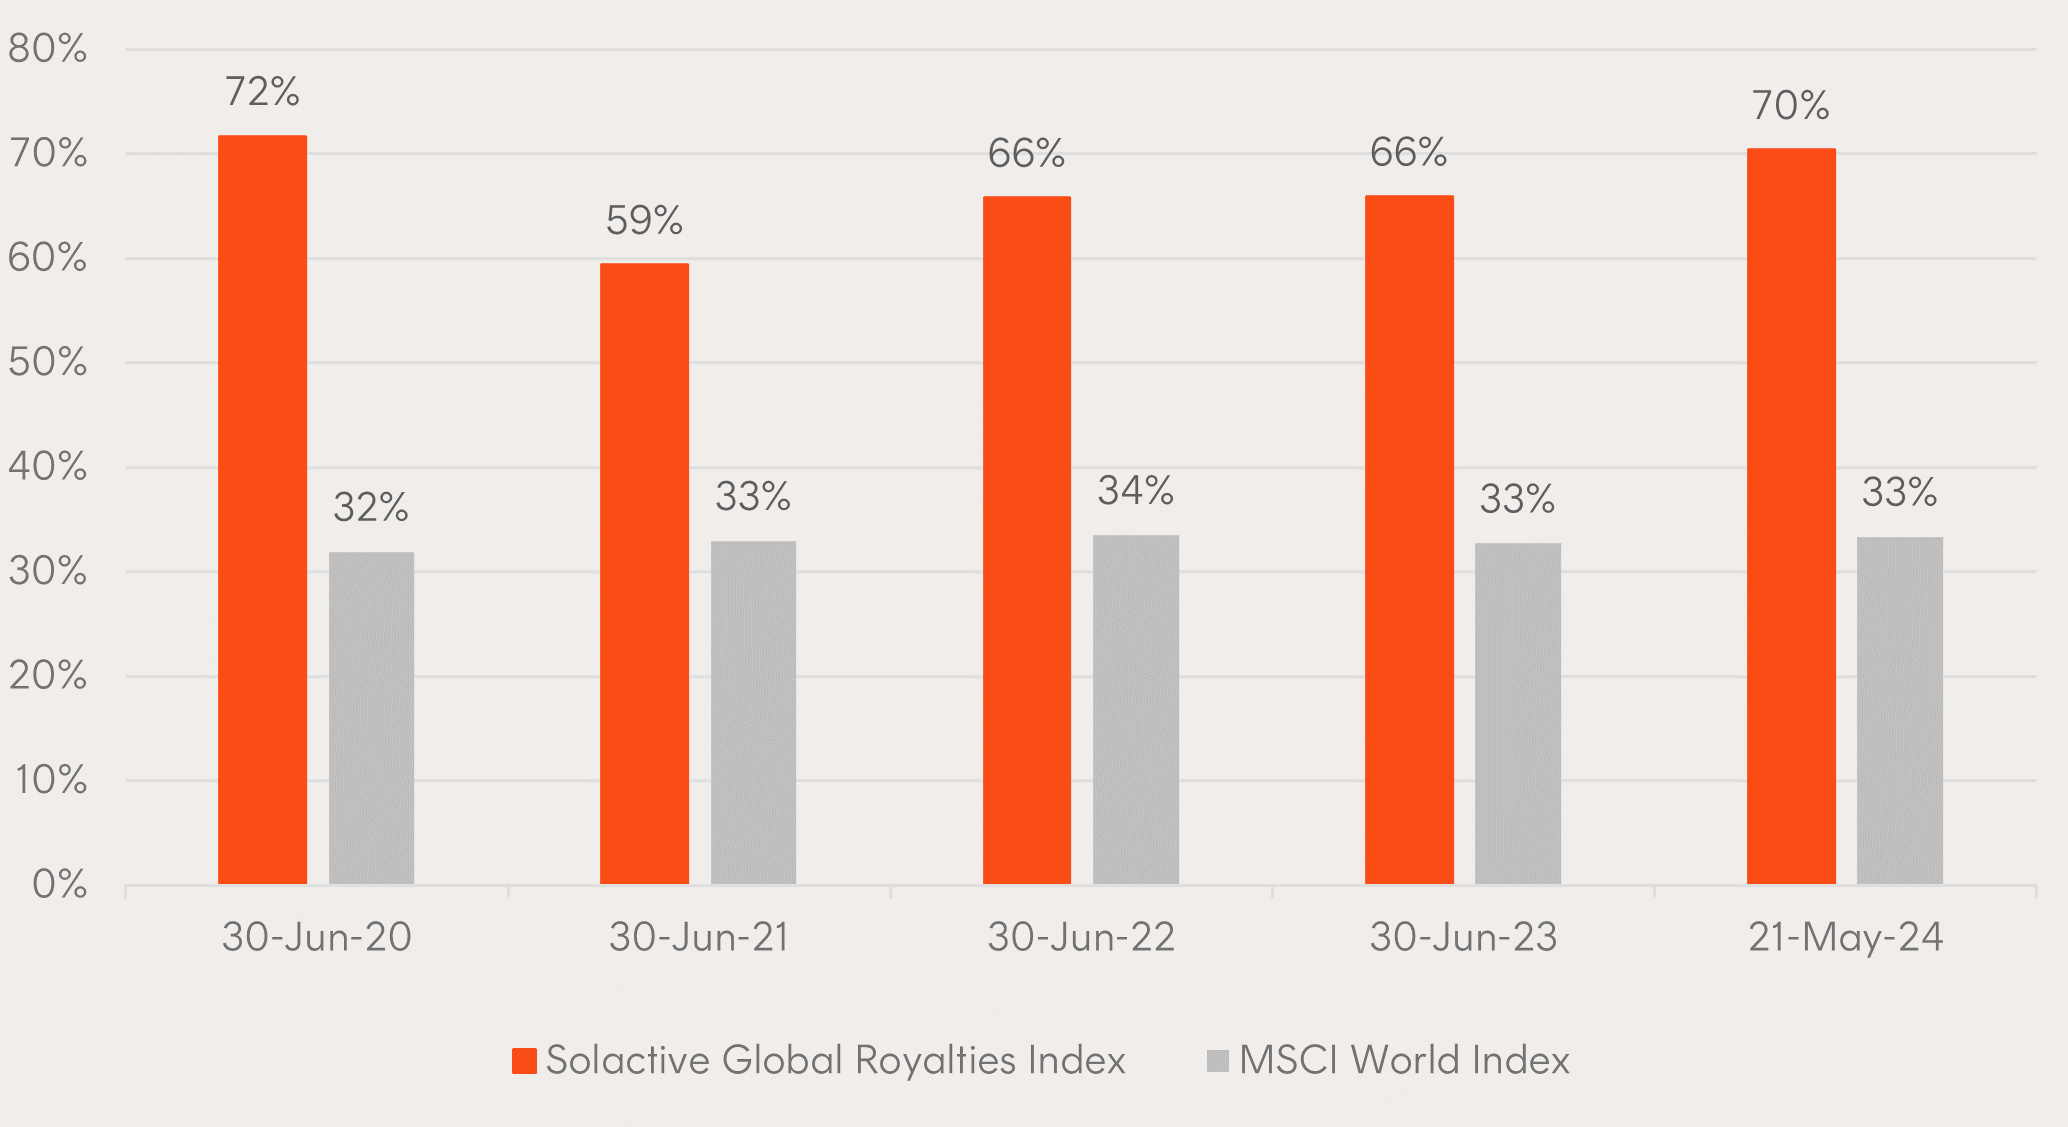
Source: Bloomberg. Past performance is not an indicator of future performance. Gross margin figures are calculated based on the companies in the Solactive Global Royalties Index (the index which ROYL aims to track). You cannot invest directly in an Index. ROYL’s inception date was 9 September 2022.
Chart 4: Average Return on Capital of Solactive Global Royalties Index versus MSCI World Index
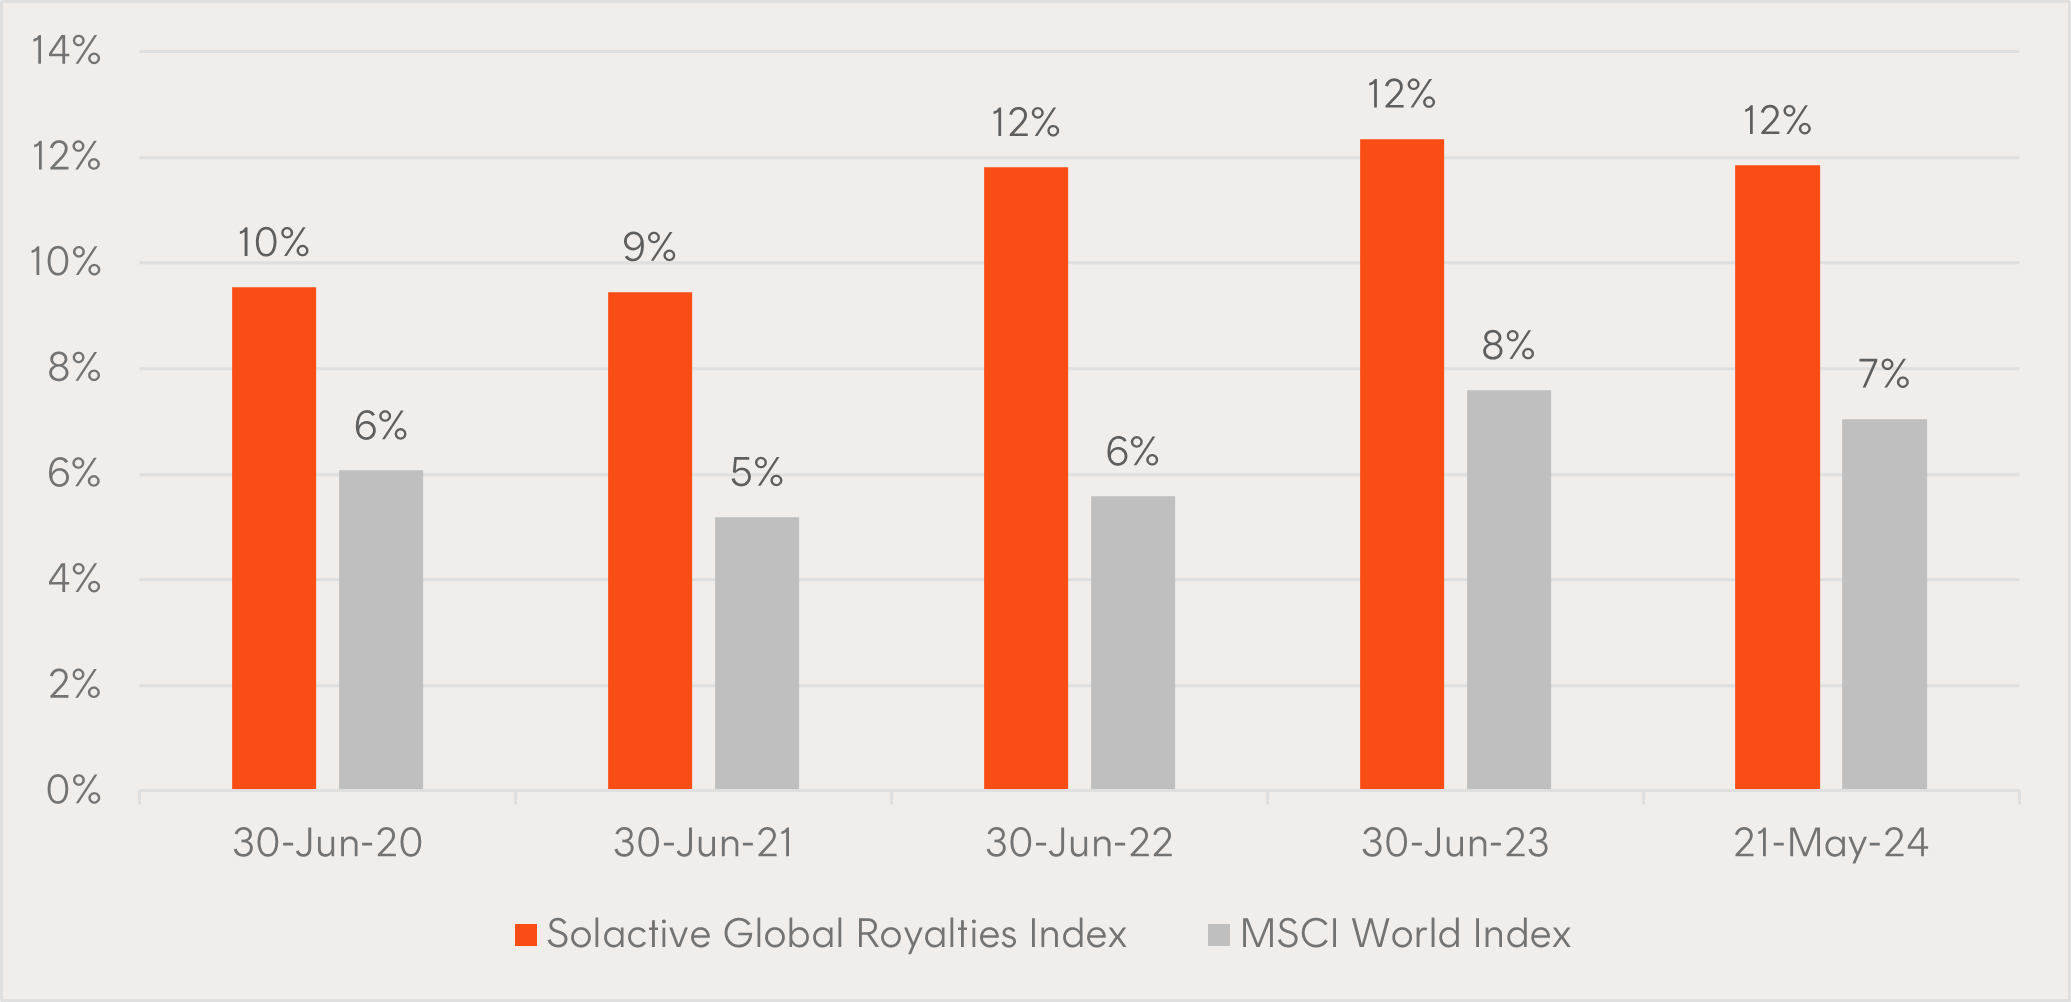
Source: Bloomberg. Past performance is not an indicator of future performance. Return on capital figures are calculated based on the companies in the Solactive Global Royalties Index (the index which ROYL aims to track). You cannot invest directly in an index. ROYL’s inception date was 9 September 2022.
What do computer chips and biotech have in common?
ROYL offers investors exposure to royalty companies operating in areas as diverse as oil and gas, precious metals, music and publishing, pharma and IT. Following the rebalance in May 2024, there were seven new companies added to ROYL’s index including ARM Holdings and Halozyme Therapeutics2.
Whilst these companies have very different business models, they both generate large amounts of royalty revenue from intellectual property rights which they licence out.
ARM holdings, the largest stock to IPO globally in 20233, is a semiconductor and software design company that earns royalties on its chip design intellectual property. When a company like Apple designs its chips, they rely on an instruction set that ARM develops which determines how the chip is run. ARM designs often use significantly less power than alternative designs, which is critical for battery-powered devices.
That means whenever an Apple iPhone is sold, ARM collects a small percentage of around 1-2% of the selling price of the chip4. On top of that, upfront licensing fees can very between an estimated $1 – 10 million5 for chip designers looking to build using the Arm architecture. Arm’s customers also include Nvidia, Google, Microsoft, Amazon, Samsung, Intel and TSMC.
We can see how important royalty revenues can be as they can continue for many years or decades. ARM is still collecting royalties on products developed in the early 1990’s and has enjoyed strong quarterly revenues from royalties more recently6.
Chart 5: ARM quarterly revenue
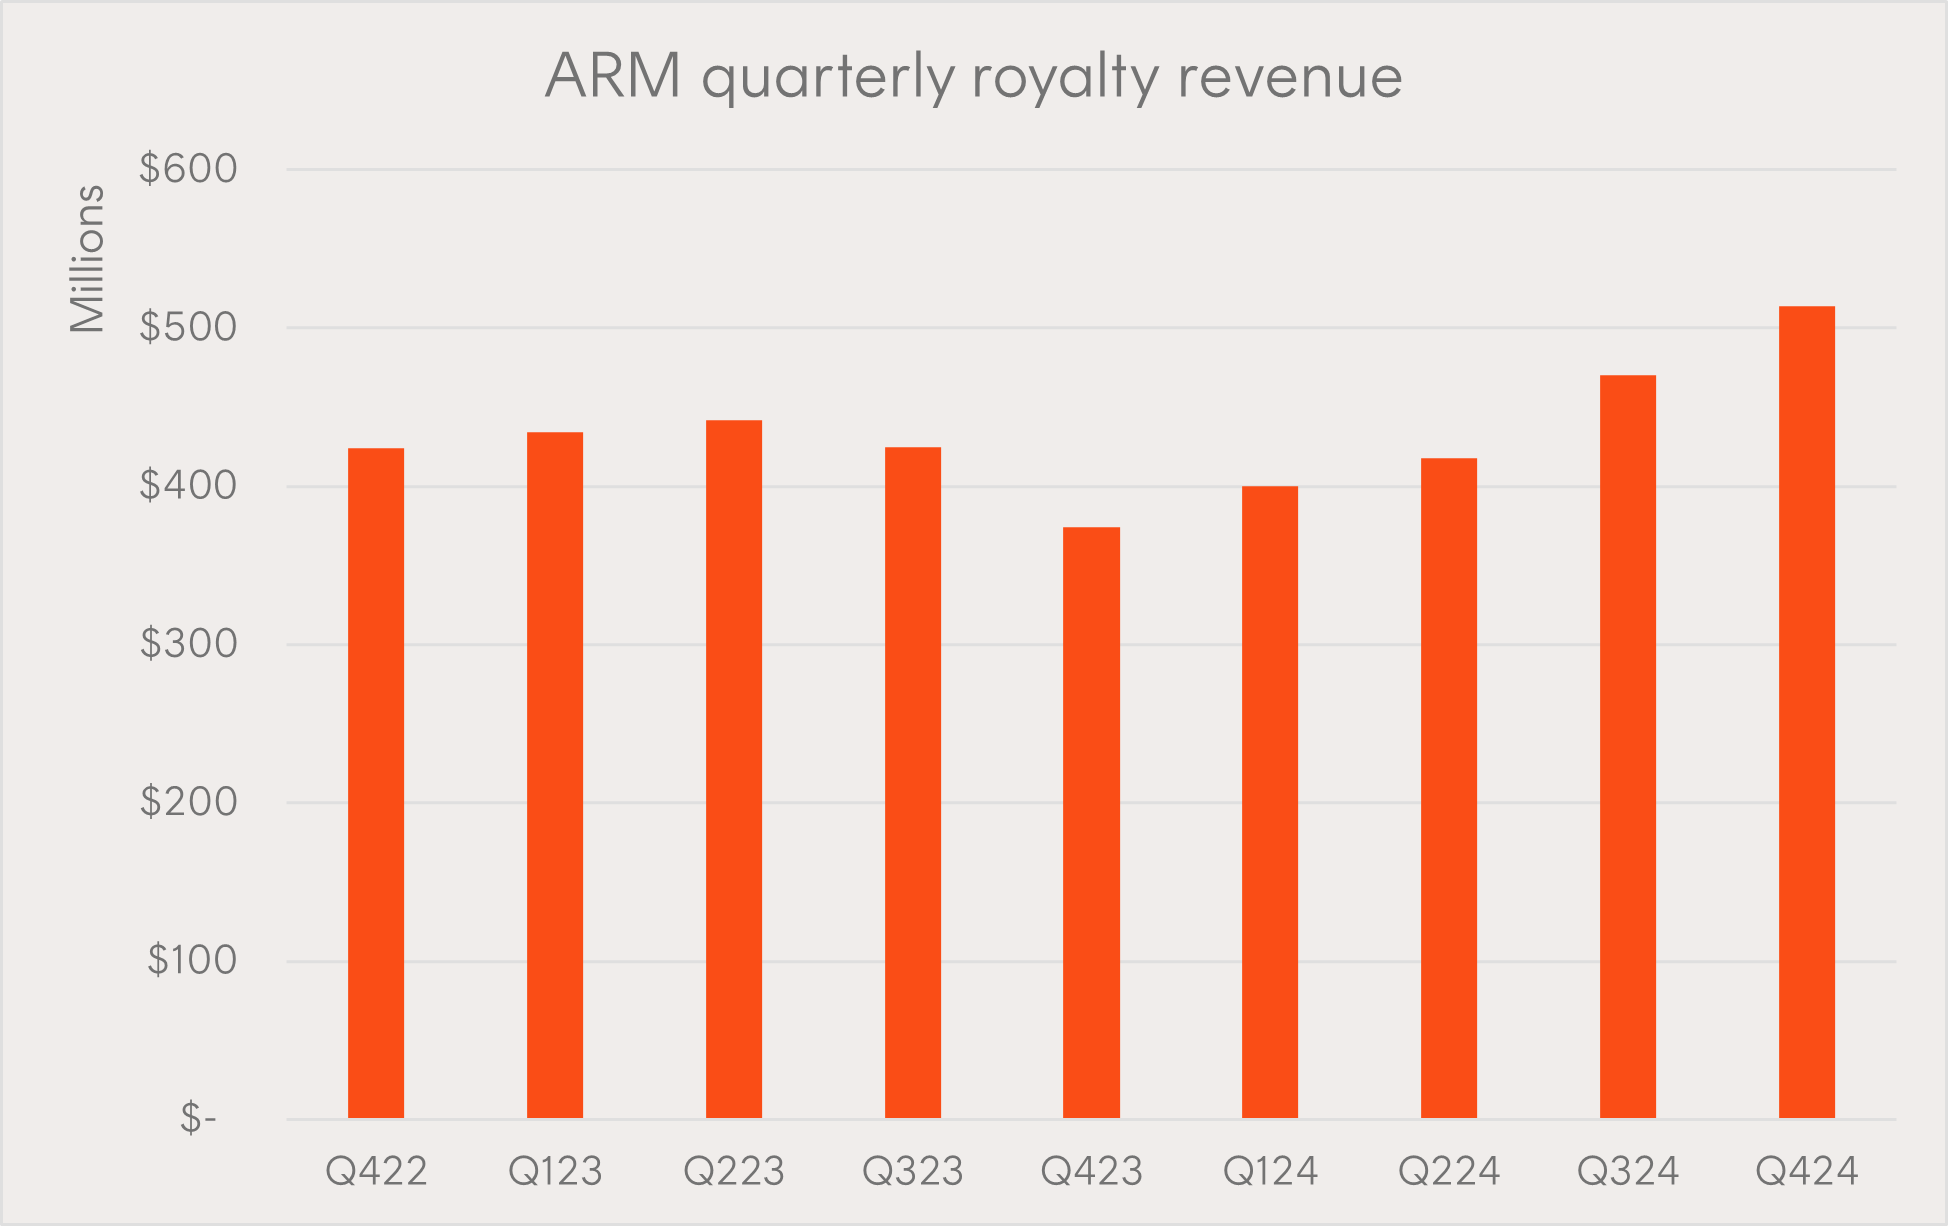
Source: ARM Holdings Q4 FYE24 Results Presentation as at 8 May 2024. Past performance is not an indicator of future performance.
Whilst Arm earns royalty revenues from the instruction set it licences to chip designers, Halozyme is a biotechnology company that earns its royalties from licensing agreements with other biopharma companies like Pfizer, Roche and Eli Lilly.
For example, Roche uses Halozyme’s technology which allows for the injection of its drug, Herceptin (for patients with early-stage breast cancer). Similarly to ARM, when Roche sells a dose of Herceptin, Halozyme collects a percentage of those sales as royalties.
Royalties have become an important part of Halozyme’s business model as it continues to grow and account for more than half of its total revenues7. As drug partners like Roche continue to build out and commercialise their products, Halozyme also benefits financially.
Portfolio construction
With the potential to benefit from inflationary environments whilst offering a strong risk-return profile and fundamentals, ROYL can be used to complement your ‘core’ equities exposures.
ROYL can also provide potential for natural diversification benefits, as it has historically displayed lower correlations with a global equity benchmark, with excess returns tending to coincide with periods when bonds have been less effective at providing a diversification benefit.
For more information, please reach out or visit ROYL’s fund page here.
There are risks associated with an investment in ROYL, including market risk, sector risk, international investment risk, royalties-related risks and concentration risk. Investment value can go up and down. An investment in the Fund should only be considered as a part of a broader portfolio, taking into account your particular circumstances, including your tolerance for risk. For more information on risks and other features of ROYL, please see the Product Disclosure Statement and Target Market Determination, both available on this website.
1. Source: Bloomberg, Betashares. Weekly returns and correlation calculated since common inception, 9 November 2018, to 27 May 2024. Chart shows performance of the index which ROYL aims to track, not the actual past performance of ROYL. You cannot invest directly in an index. Index performance does not take into account ROYL’s management costs (0.69% p.a.). Past performance is not indicative of future performance.
2. No assurance is given that these companies will remain in ROYL’s portfolio or will be profitable investments. ↑
3. https://www.forbes.com.au/news/investing/arm-holding-the-biggest-ipo-of-2023/ ↑
4. https://www.strategyzer.com/library/arm-business-model ↑
5. https://www.strategyzer.com/library/arm-business-model ↑
6. https://investors.arm.com/static-files/4f2fc46b-34a5-4bc5-94af-f13fbc348f0e ↑
7. Halozyme Therapeutics 2023 Annual Report ↑


