
Betashares
7 minutes reading time
Are active funds really a better bet in the current market environment?
There is a common perception that when volatility returns to markets investors should favour active management and stock picking over passive investing. During the 2020 COVID-19 sell-off, many active managers asserted they were better placed to provide some downside protection, yet, on average, actively managed funds underperformed passive during that period (as discussed below).
Again, in 2022, against the backdrop of elevated stock valuations, rampant inflation and a possible recession, the refrain has been that active management can provide investors with better outcomes through the market volatility.
This narrative is intuitively appealing. In this article we investigate the extent to which it is supported by the evidence so far.
What long-term performance outcomes have actively managed funds delivered?
In any investment period there will always be some active funds that outperform and some that underperform relative to an appropriate benchmark. The question is – what are the chances of any one active fund outperforming?
The SPIVA (S&P Index vs. Active) Scorecard tracks the ability of actively managed funds all over the world to beat passive benchmarks. SPIVA have generally found that, across geographies, asset classes and time periods, the majority of active managers have underperformed. As an example, the chart below shows the outcomes for Australian-domiciled actively managed global equity funds from the latest SPIVA Australia Scorecard1. Looking at absolute returns, fewer than 20% of active funds in this category outperformed over the 2021 calendar year, and only 7.3% of active funds outperformed over a 10-year investment timeframe.
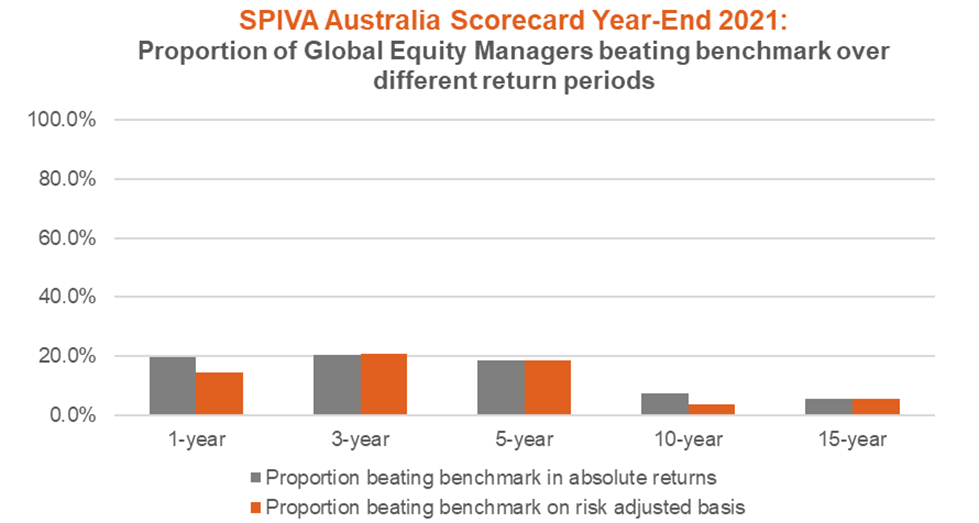
Source: SPIVA Australian Scorecard Year-End 2021. Data as at 31 December 2021. All returns in AUD. This data includes all active funds within the Morningstar Category “Australia Fund Equity – World Large Blend”, “Australia Fund Equity – World Large Growth” and “Australia Fund Equity – World Large Value”. These funds’ performance was measured against the S&P Developed Ex-Australia LargeMidCap Index, which does not take into account any fees or costs. You cannot invest directly in an index. Past performance is not indicative of future performance.
Furthermore, the risk adjusted return outcomes for these actively managed global equity funds were no better in general, and in fact worse over some investment periods.
The SPIVA chart below shows the degree to which actively managed Australian bond funds have underperformed over time. Cumulative performance versus benchmark is shown of both an equal-weighted basket of these funds and an asset-weighted basket of these funds. Critically, the periods where this active peer group’s underperformance has been most acute have corresponded to periods of equity drawdowns (as shown by the red shaded areas).
SPIVA Australia Scorecard Year-End 2021:
Cumulative Asset and Equal Weighted Average Fund Returns for Australian Bond Funds relative to benchmark
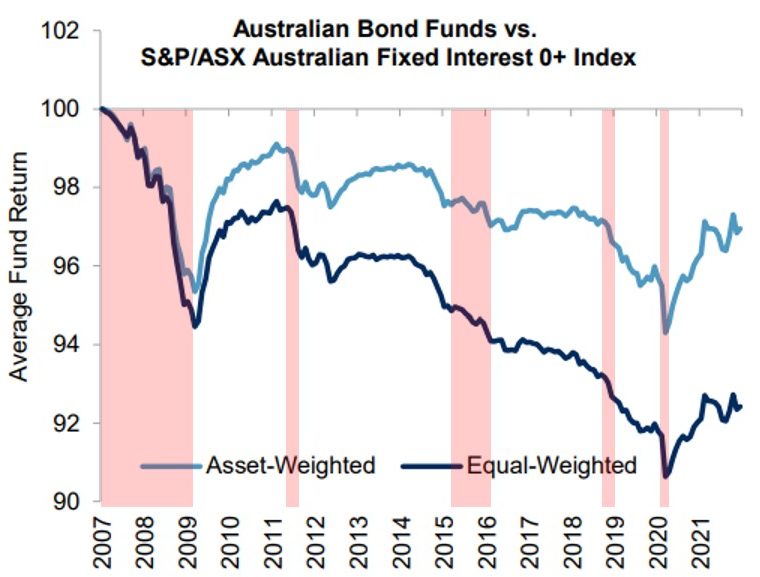
Source: S&P Dow Jones Indices LLC, Morningstar, BetaShares. Data as at 31 December 2021. All returns in AUD. Chart is provided for illustrative purposes and reflects hypothetical historical performance relative to benchmark of both an equal weighted and asset weighted basket of active funds with the Morningstar Category “Australia Fund Bonds – Australia”. The S&P/ASX Australian Fixed Interest 0+ Index was launched 5 September 2014. All information prior to an index’s launch date is back-tested (not actual), using the methodology in effect on the index launch date. Please note there are inherent limitations with back-tested performance. The areas in red (shaded in by BetaShares) are periods when the S&P/ASX200 Index has experienced a 10%+ drawdown. Past performance, whether actual or back-tested, is not indicative of future performance.
The primary role of bonds in a multi-asset portfolio is to provide diversification and stability at a time when equities are falling. In fixed income, active funds on average appear to have delivered worse outcomes compared to benchmark, increasing correlation to equities at the worst possible time, just when investors are looking for their bond allocation to be as defensive as possible.
How did actively managed funds fare during the COVID-19 sell-off in Q1 2020?
SPIVA assessed the performance of Australian-domiciled active funds during Q1 2020 across all the major asset classes. For the quarter, in all asset class categories except A-REITs, most active funds underperformed their respective benchmarks. For example, 61% of funds categorised as ‘Australian Equity General’ failed to beat the S&P/ASX 200 Index over the quarter.
The figures were better for Australian equities in the month of March 2020 alone, during the worst of the drawdown, where ‘only’ 51% of ‘Australian Equity General’ funds underperformed. However, the ability of these active managers to take a defensive tilt during a bear market appears to have had a muted effect, at best, on relative performance. The proportion of actively managed fixed income and global equity funds that underperformed in March 2020 was significantly higher.2
How have actively managed funds performed in 2022 so far?
Turning back to actively managed global equity funds, for 2022 YTD they have underperformed on average.3 But of that peer group 43% did in fact outperform, and investors often assume that the active manager they picked is better than the average. So we took a look at the funds that investors have tended to allocate their money to so far this year, the 127 active global equity funds with positive 2022 YTD net inflows as at 31 May 2022. For this select group the results were worse.
Global Active Equity Funds with positive YTD net inflows:
Histograms of relative performance versus MSCI World Index (AUD) as at 31 May 2022
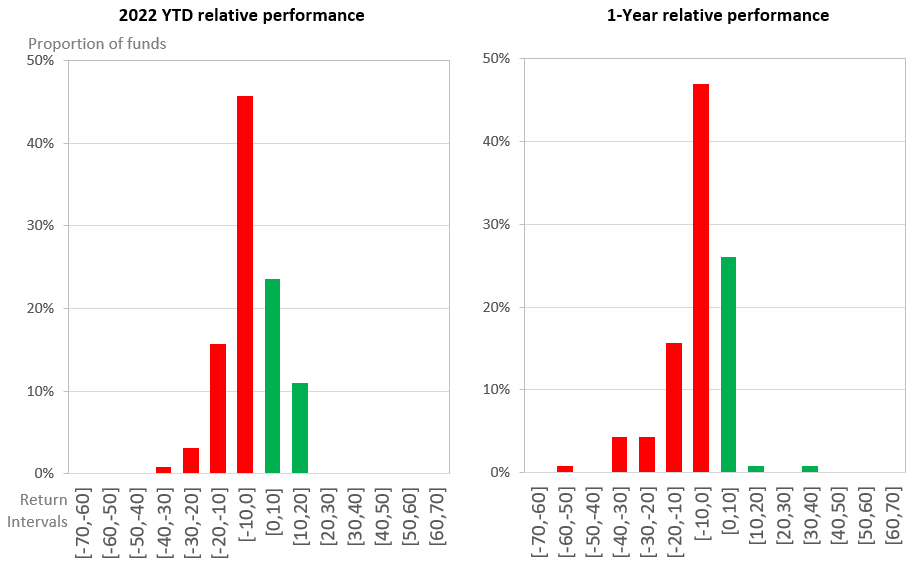
Source: Morningstar Direct, as at 31 May 2022. All returns in AUD. This data includes all active funds with the Morningstar Category “Australia Fund Equity – World Large Blend”, “Australia Fund Equity – World Large Growth” and “Australia Fund Equity – World Large Value” with positive reported net inflows for 2022 YTD, where relative performance is measured against the MSCI World Ex-Aust NR Index. Green bars represent the number of funds in each return interval that outperformed this index. Red bars represent the number of funds in each return interval that underperformed this index. You cannot invest directly in an index. Past performance is not indicative of future performance.
2022 YTD only 35% of this peer group managed to beat the MSCI World ex-Aust NR Index, with average underperformance of -2.8%. There was also a large downside skew, with the worst fund underperforming by -39.0%, and the best outperforming by +18.9%.
Going back further to assess 1-year relative performance to 31 May 2022, the proportion of outperformers falls to 28%, with average underperformance of -6.7%. One of these active managers delivered -58.7% relative to the MSCI World ex-Aust NR Index.
The role of active and passive in portfolio construction
While this performance data doesn’t support the generalised argument that actively managed funds offer better performance compared to passively managed funds in down markets, it doesn’t mean active funds should be excluded entirely from consideration. Our belief is that core allocations should generally be reserved for low-cost, well-diversified, passive exposures. However:
For investors already holding active funds, simply adding some passive exposures to complement their existing active managers may help improve overall diversification and net-of-fee performance;
If you have high conviction in a particular manager’s ability to generate outperformance, it may make sense to hold them as a satellite portfolio allocation; and
There are some asset classes and markets (such as unlisted assets) where a passive or index approach doesn’t necessarily work.
There are a number of advantages to holding passive ETFs in your investment portfolio in volatile markets. If an active manager is at risk of underperforming a benchmark, investors may be better off getting the lowest cost exposure to that benchmark available and reducing tracking error.
Passive ETFs don’t have to just be broad market beta funds. They include rules-based approaches to accessing investment styles or factors, like growth or value, which active managers often try to target to generate performance.
But, unlike actively managed funds, passive ETFs:
Tend to be much lower cost, can be traded intra-day on the exchange, and often offer better security diversification – three very desirable characteristics in a market where positive returns are hard to come by.
Passive ETFs offer full portfolio transparency. Often getting a handle on why an active fund is underperforming can be difficult, whereas all passive ETFs traded on the ASX are obligated to publish all their holdings each trading day, so you can look through to see exactly what is driving performance.
There are a wide range of passive ETFs available on the ASX from BetaShares and other ETF issuers. To consider how ETFs may complement your clients’ existing portfolios, in both good times and bad, please contact your BetaShares account manager who can assist with portfolio analytics.