

Investing in the space economy - from launch pad to commercial reality

Cameron Gleeson
9 minutes reading time
- Fixed income, cash & hybrids
Related articles

There are significant advantages to including some low-cost equity beta in client portfolios. But how do you add value beyond tracking the broad index?
The most common answer is to also include actively managed funds with the potential to deliver outperformance relative to funds that track traditional benchmarks alone. However, generating alpha is a competitive (arguably zero-sum1), high-cost game, and the growth of indexing has exposed closet “index huggers” and created a shift towards high conviction and index unaware active strategies.
While such strategies have the potential to deliver alpha, they also tend to suffer from periods of significant underperformance.
Investing is about the journey, not just the end point
Take the five largest Australian domiciled active global equity fund managers for example. By comparing these fund’s performance to the benchmark MSCI World ex Australia index we get a picture of how high conviction active strategies can deviate from market benchmark returns. The below graph charts each of these funds’ excess returns to the benchmark MSCI World ex Australia (AUD) over 12-month rolling periods.
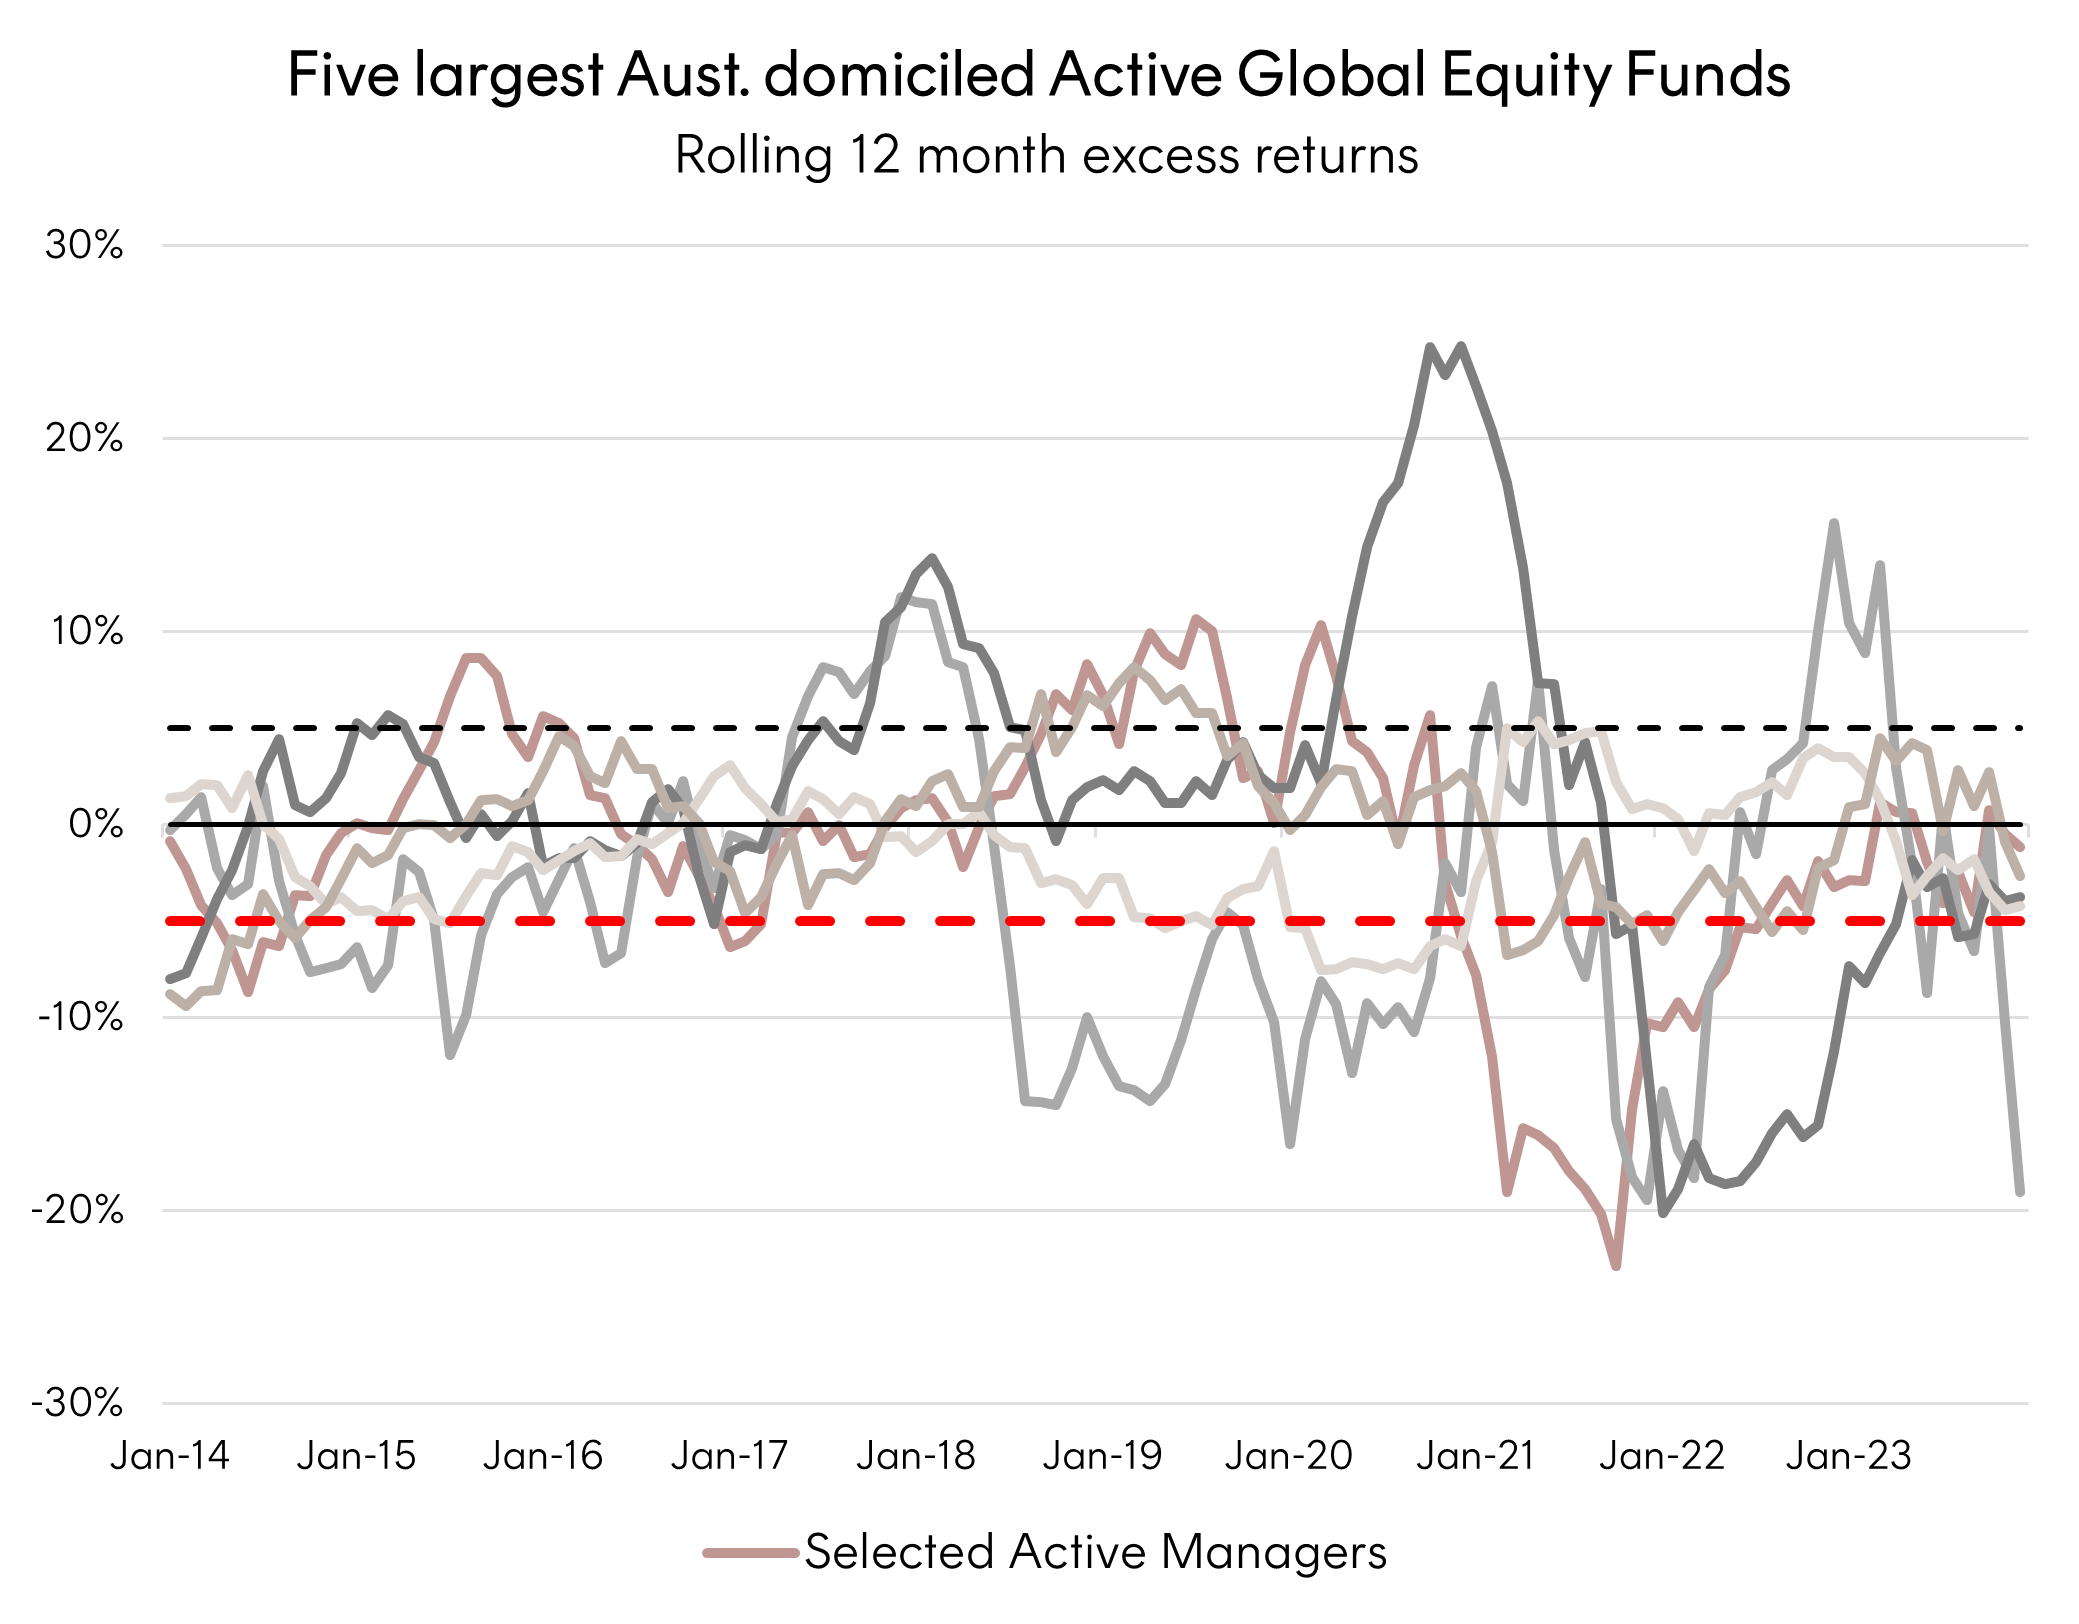
Periods below the red line indicate when these managers have underperformed the market by 5% or more – a level that can become hard to justify. Particularly when you consider that only one of these five managers beat the benchmarks’ total performance over this period.
The challenge for investors looking beyond low-cost broad market index exposures therefore becomes finding a core global equities allocation that can provide long-term net of fee outperformance whilst mitigating these periods of significant deviation, particularly underperformance, from the benchmark.
Betashares Global Cash Flow Kings ETF (ASX: CFLO)
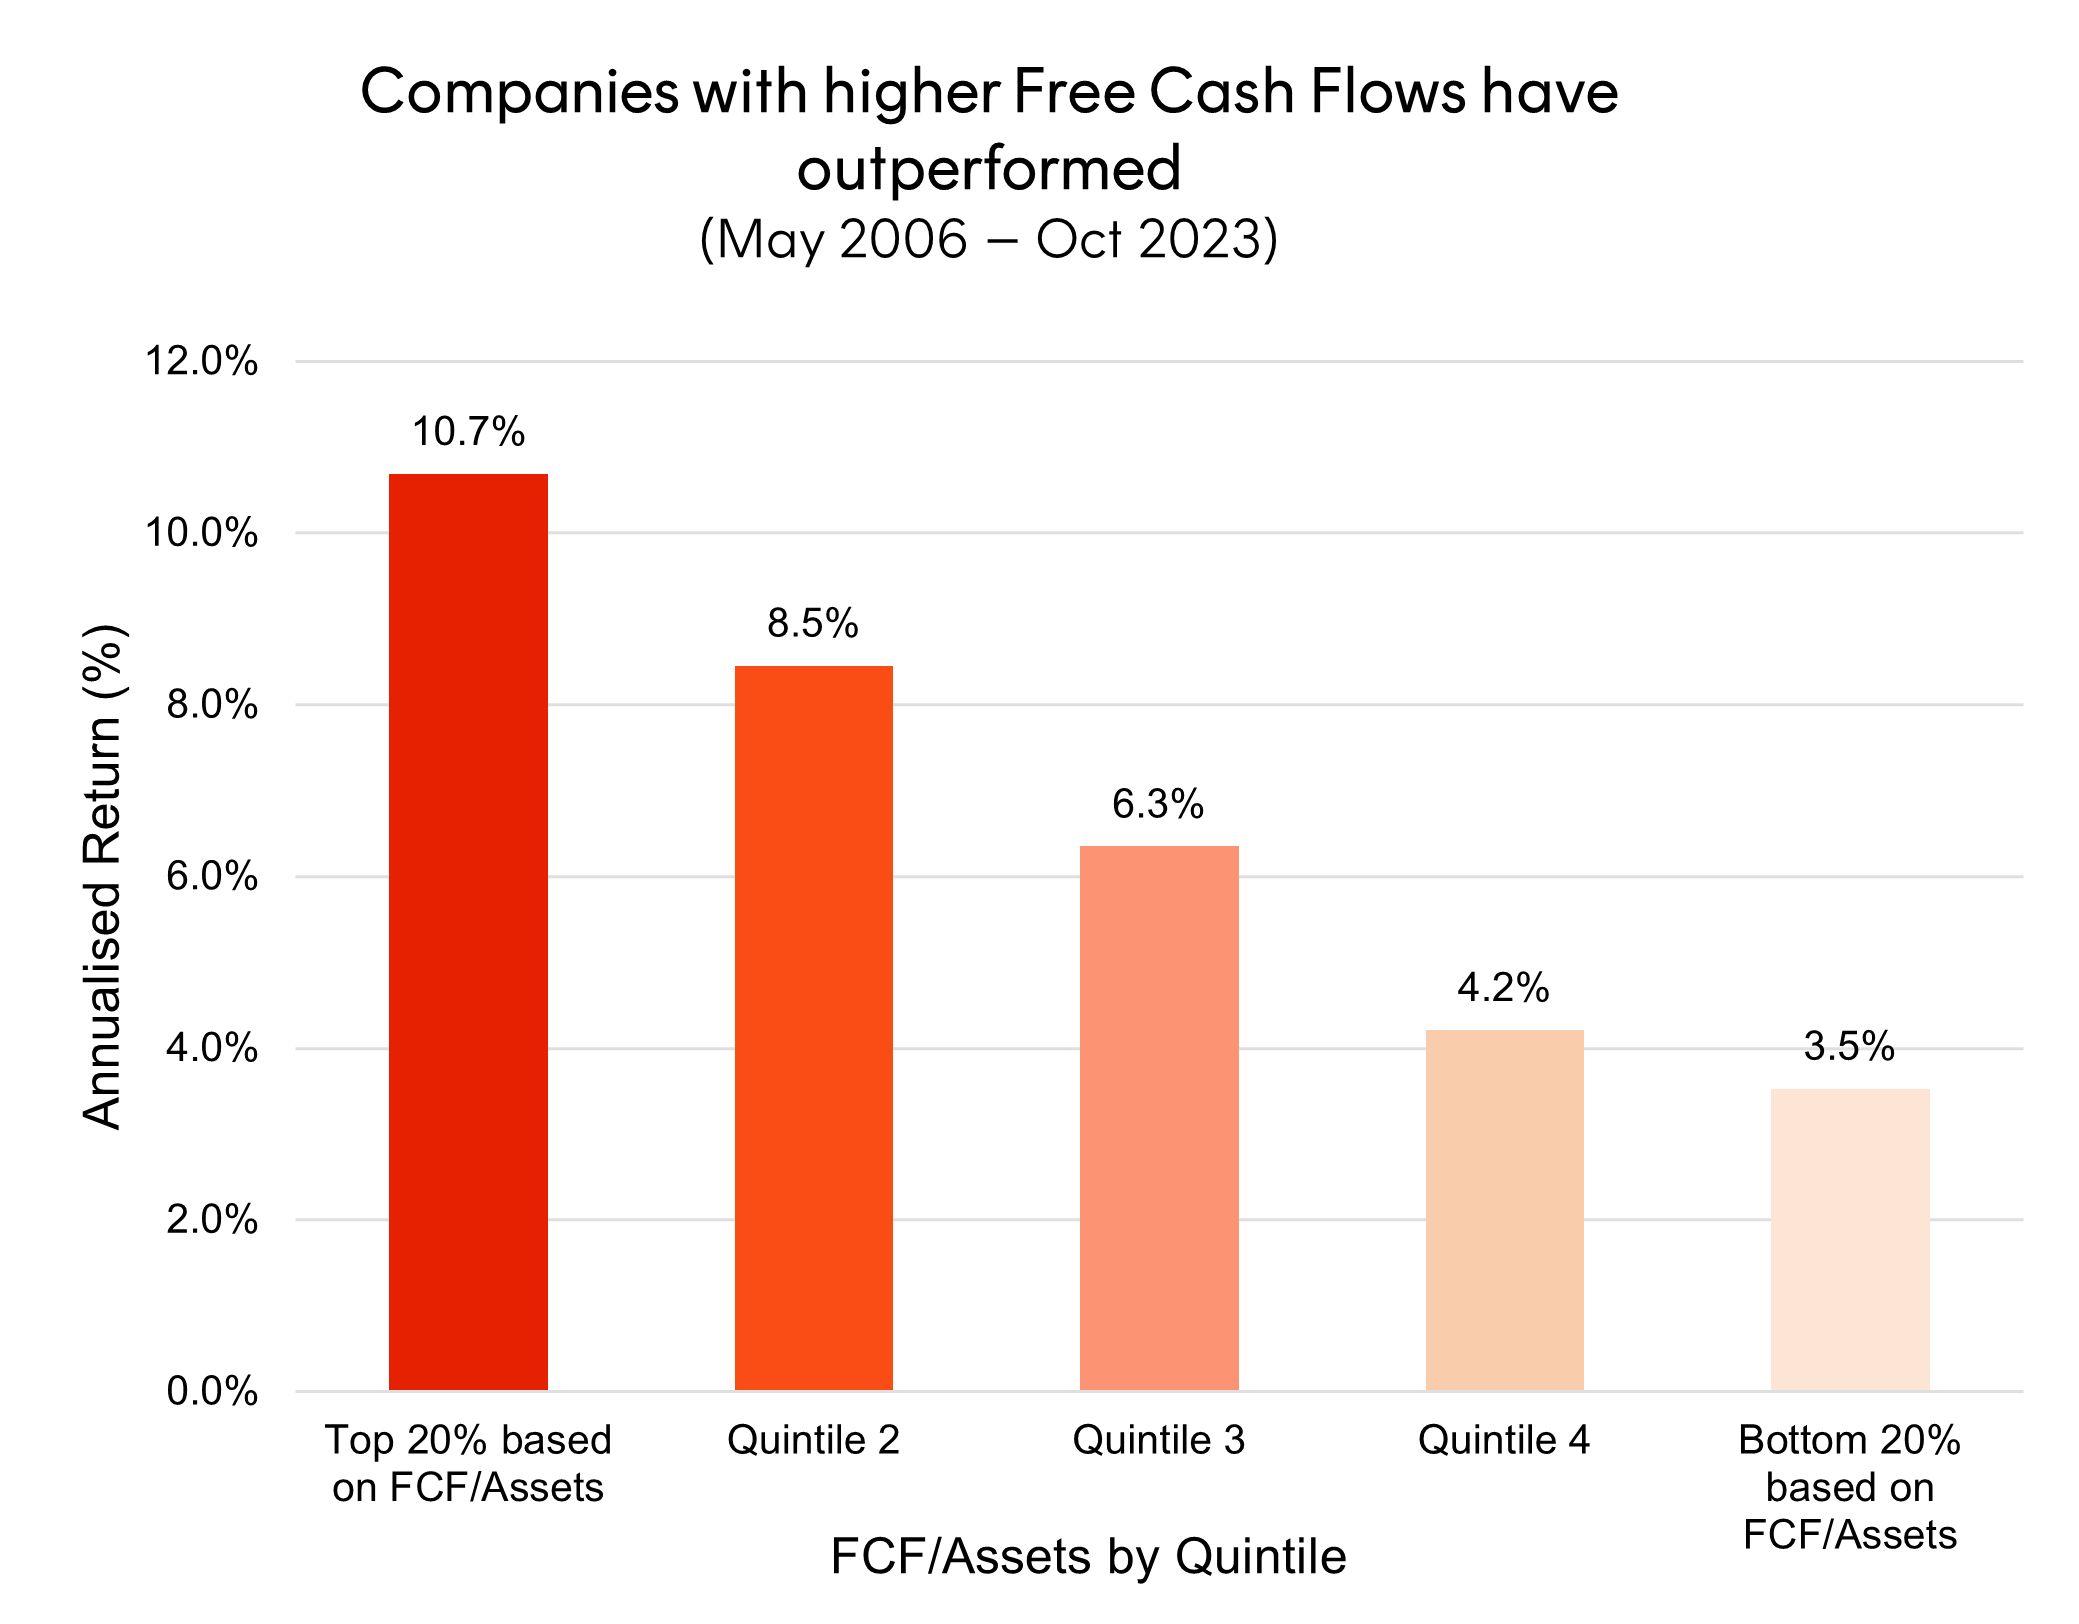
One of the central pillars of modern financial analysis dictates that an asset’s value is represented by the present value of all future cash flows.
CFLO Global Cash Flow Kings ETF tracks an enhanced index comprising a globally diversified portfolio of companies that demonstrate strong free cash flow with relatively low levels of financial leverage. Over the cycle, such companies are better placed to:
- Invest in profitable growth opportunities when the economy is strong;
- Service or pay down debt, with less reliance on funding markets or dilutive capital raising in periods of stress; and
- Outperform broad global equity benchmarks over the medium to long term
CFLO’s index uniquely neutralises sector differences to the broad market benchmark, and controls for country differences. In doing so it aims to achieve two important goals.
The first is to better control for the alpha generated by the portfolio truly being derived from the selection of companies with greater cash flows. Other funds without these measures may skew away from the market benchmark to a particular region or sector for outperformance – which risks concentration and mean reversion.
The second goal is to reduce the risk of periods of significant underperformance to the broad market benchmark – like the largest active managers have experienced.
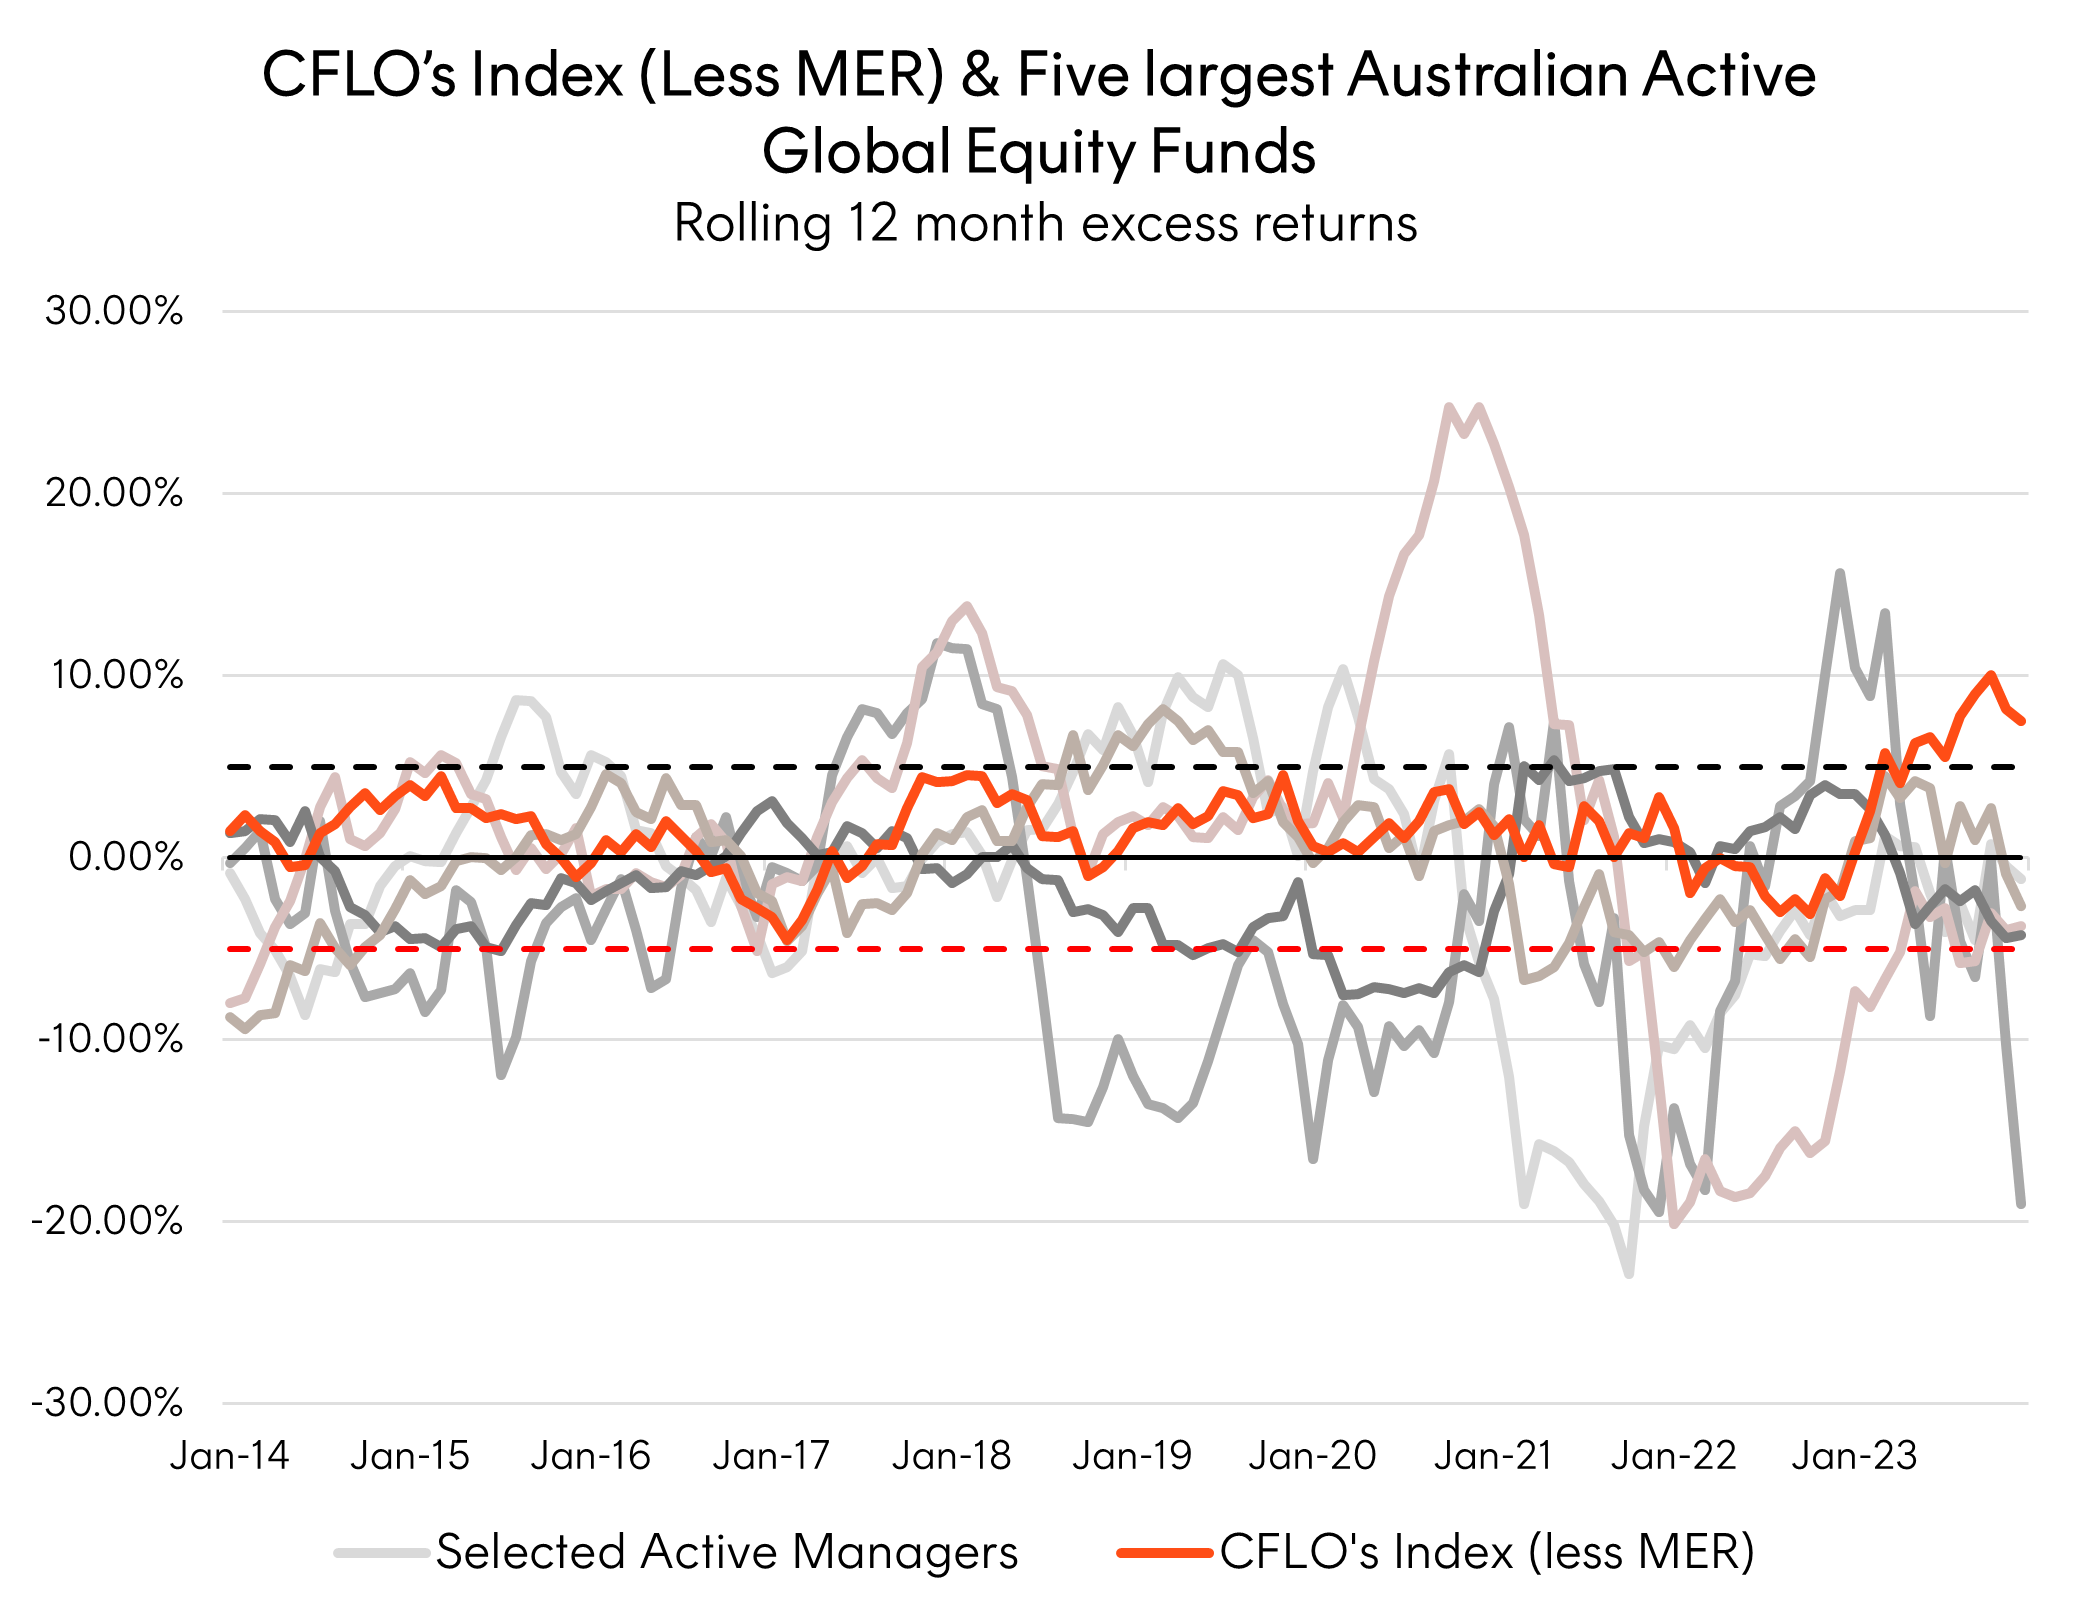
This measure has meant that CFLO’s Index’ historical performance has experienced significantly less deviation to the market benchmark than the largest active managers. Experiencing no periods of 5% underperformance or greater over the 10-year period to 31 December 2023.
Importantly CFLO’s Index also outperformed the market benchmark by an average of 2.19% p.a. over this period.
The best of both worlds
By extending our comparison to include all Australian domiciled active global equity funds and plotting their cumulative excess returns against the MSCI World ex Australia Index (AUD) we can get a picture of the compounding effect of out or underperformance across the peer group. In this chart a fund’s line will decline over a period when it is underperforming the MSCI World ex Australia (AUD) and increase in a period when it is outperforming.
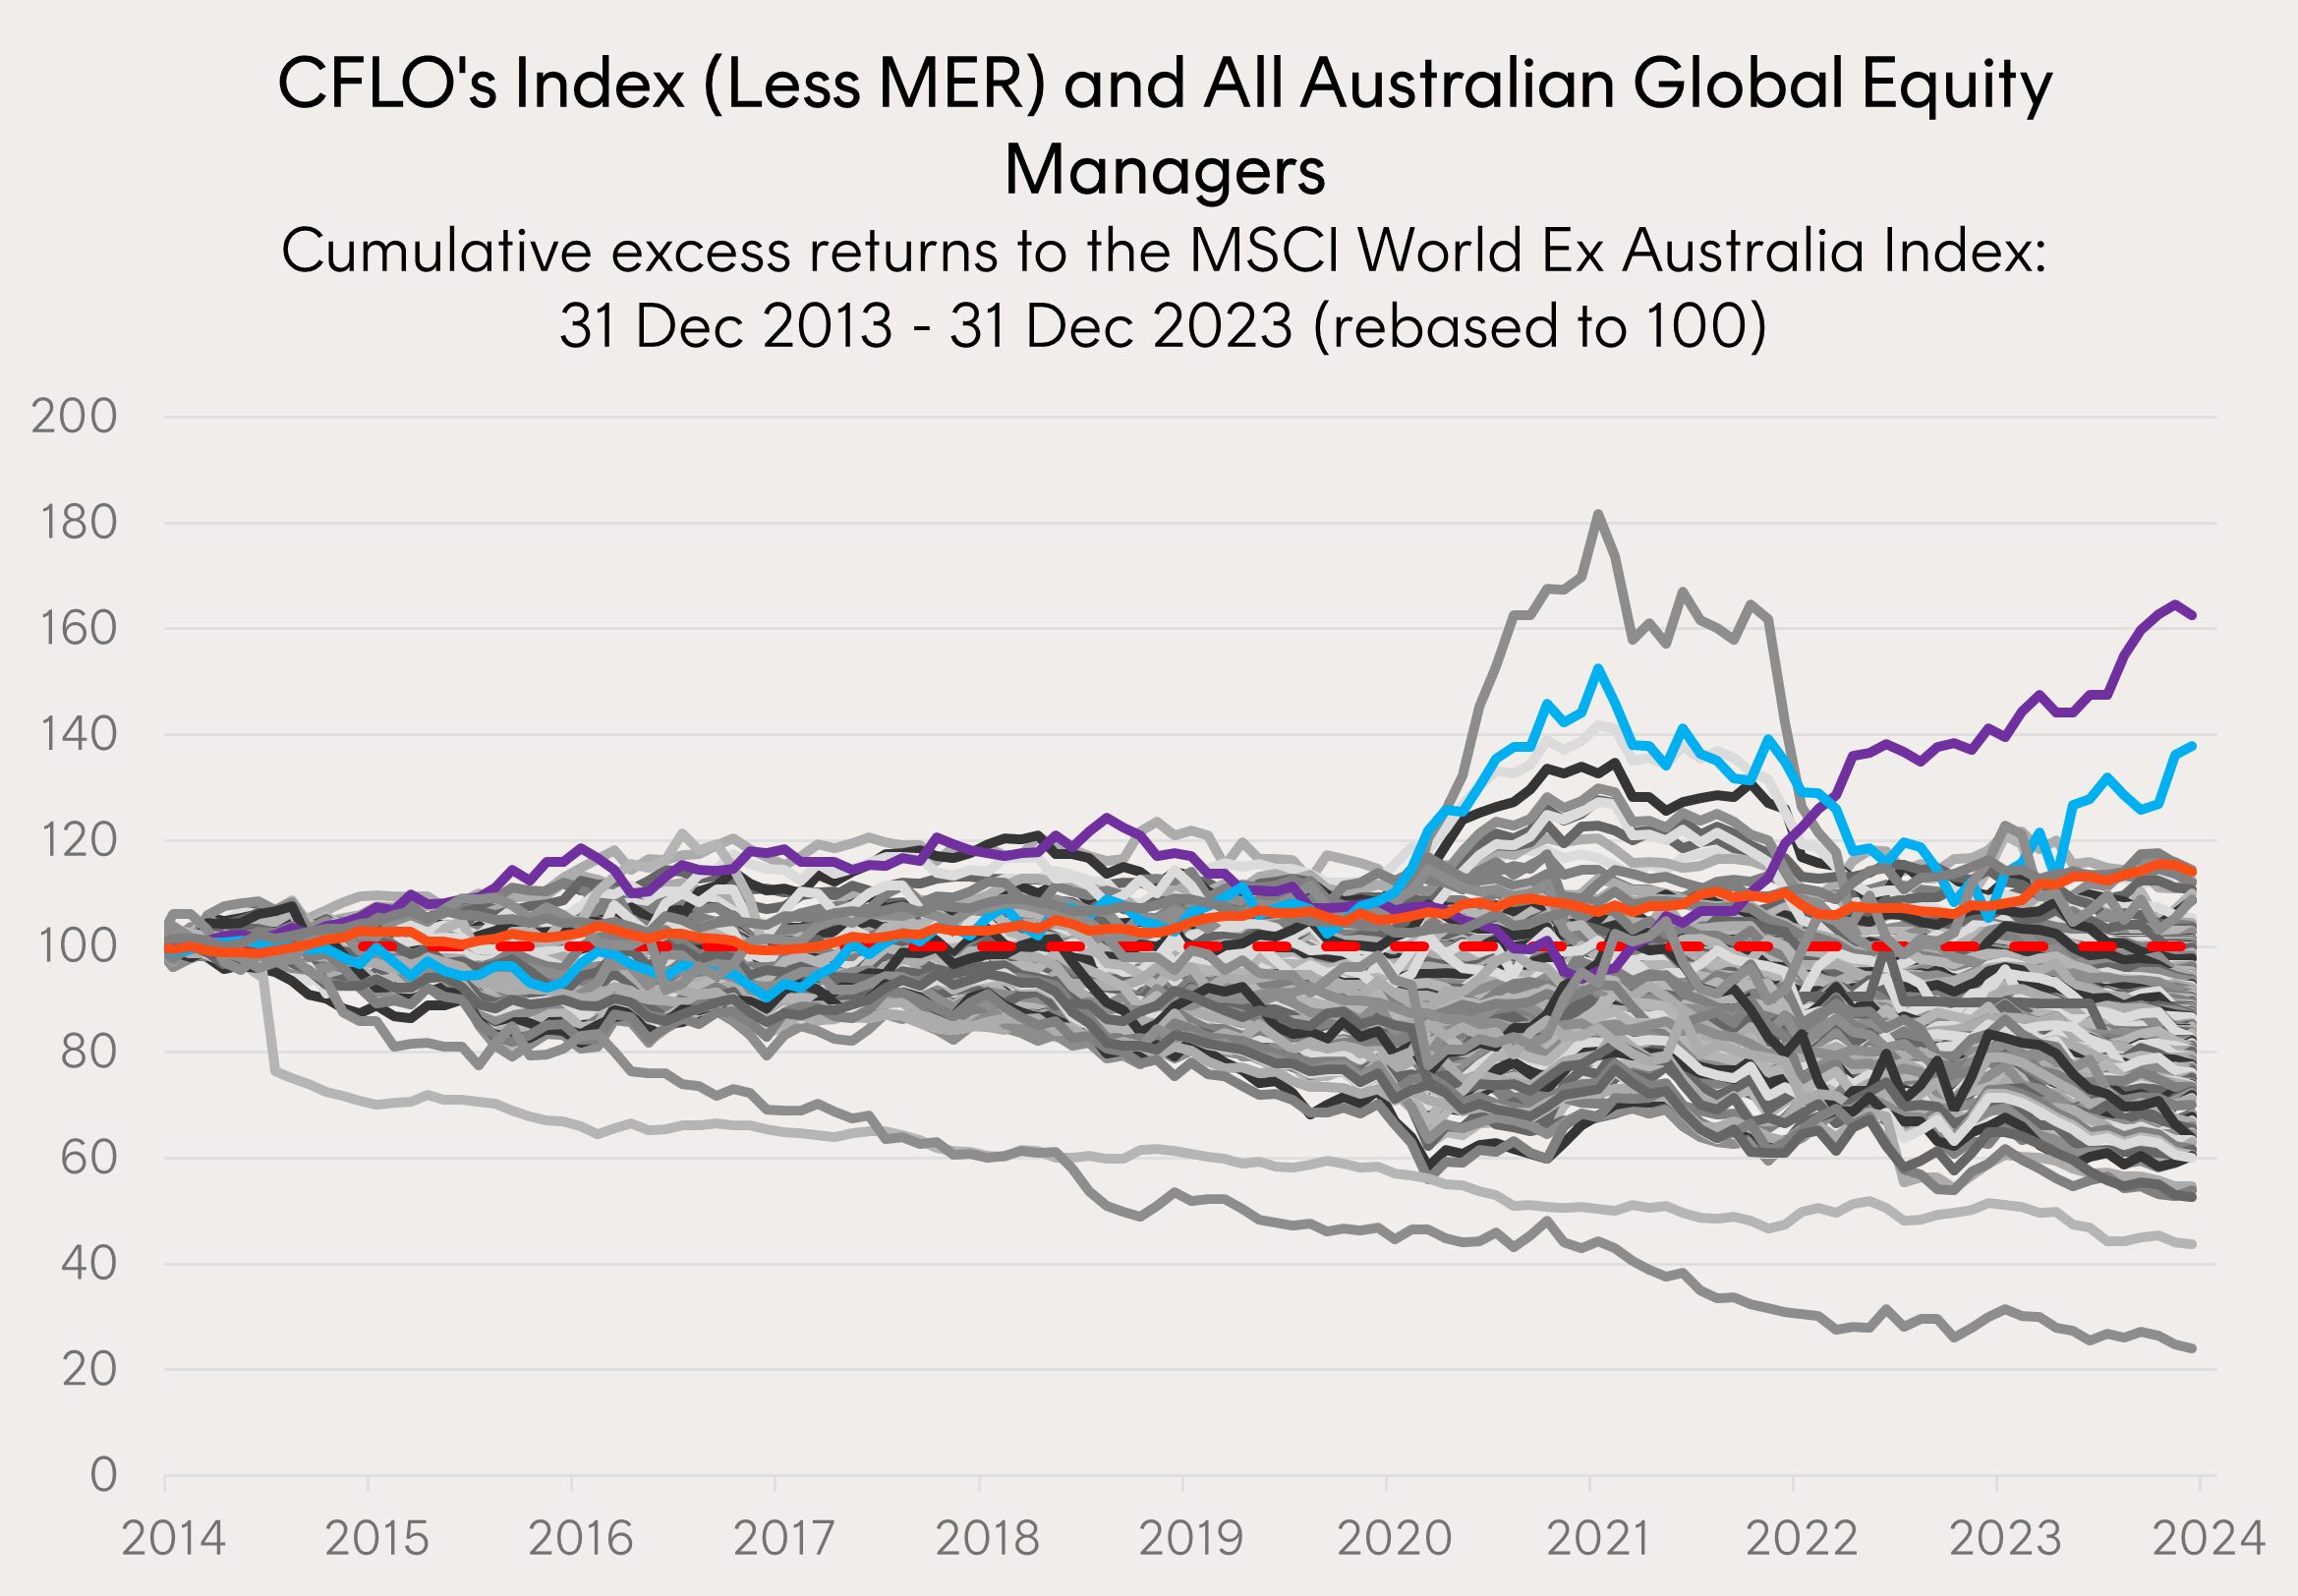
Source: Morningstar. Cumulative excess return is measured relative to the MSCI World ex Australia NR (AUD), based on monthly returns from 31 December 2013 to 31 December 2023. Funds shown are those in the ‘Australia Fund Equity World Large Growth, Value, Currency Hedged and Blend’ Morningstar categories. Chart shows CFLO Index performance (not actual fund performance) less ETF fees and expenses of 0.40% p.a. to illustrate the longer-term historical performance of global companies that demonstrate strong free cash flow. You cannot invest directly in an Index. Past performance is not an indicator of future performance.
The first conclusion drawn from this messy picture is that the majority of active global equity funds have underperformed the MSCI World Ex Australia Index (AUD) over the entirety of the 10-year period. But to reduce the noise, in the next chart we focus on just the best performing funds and CFLO’s index (less MER) to consider the persistence of each fund’s outperformance.
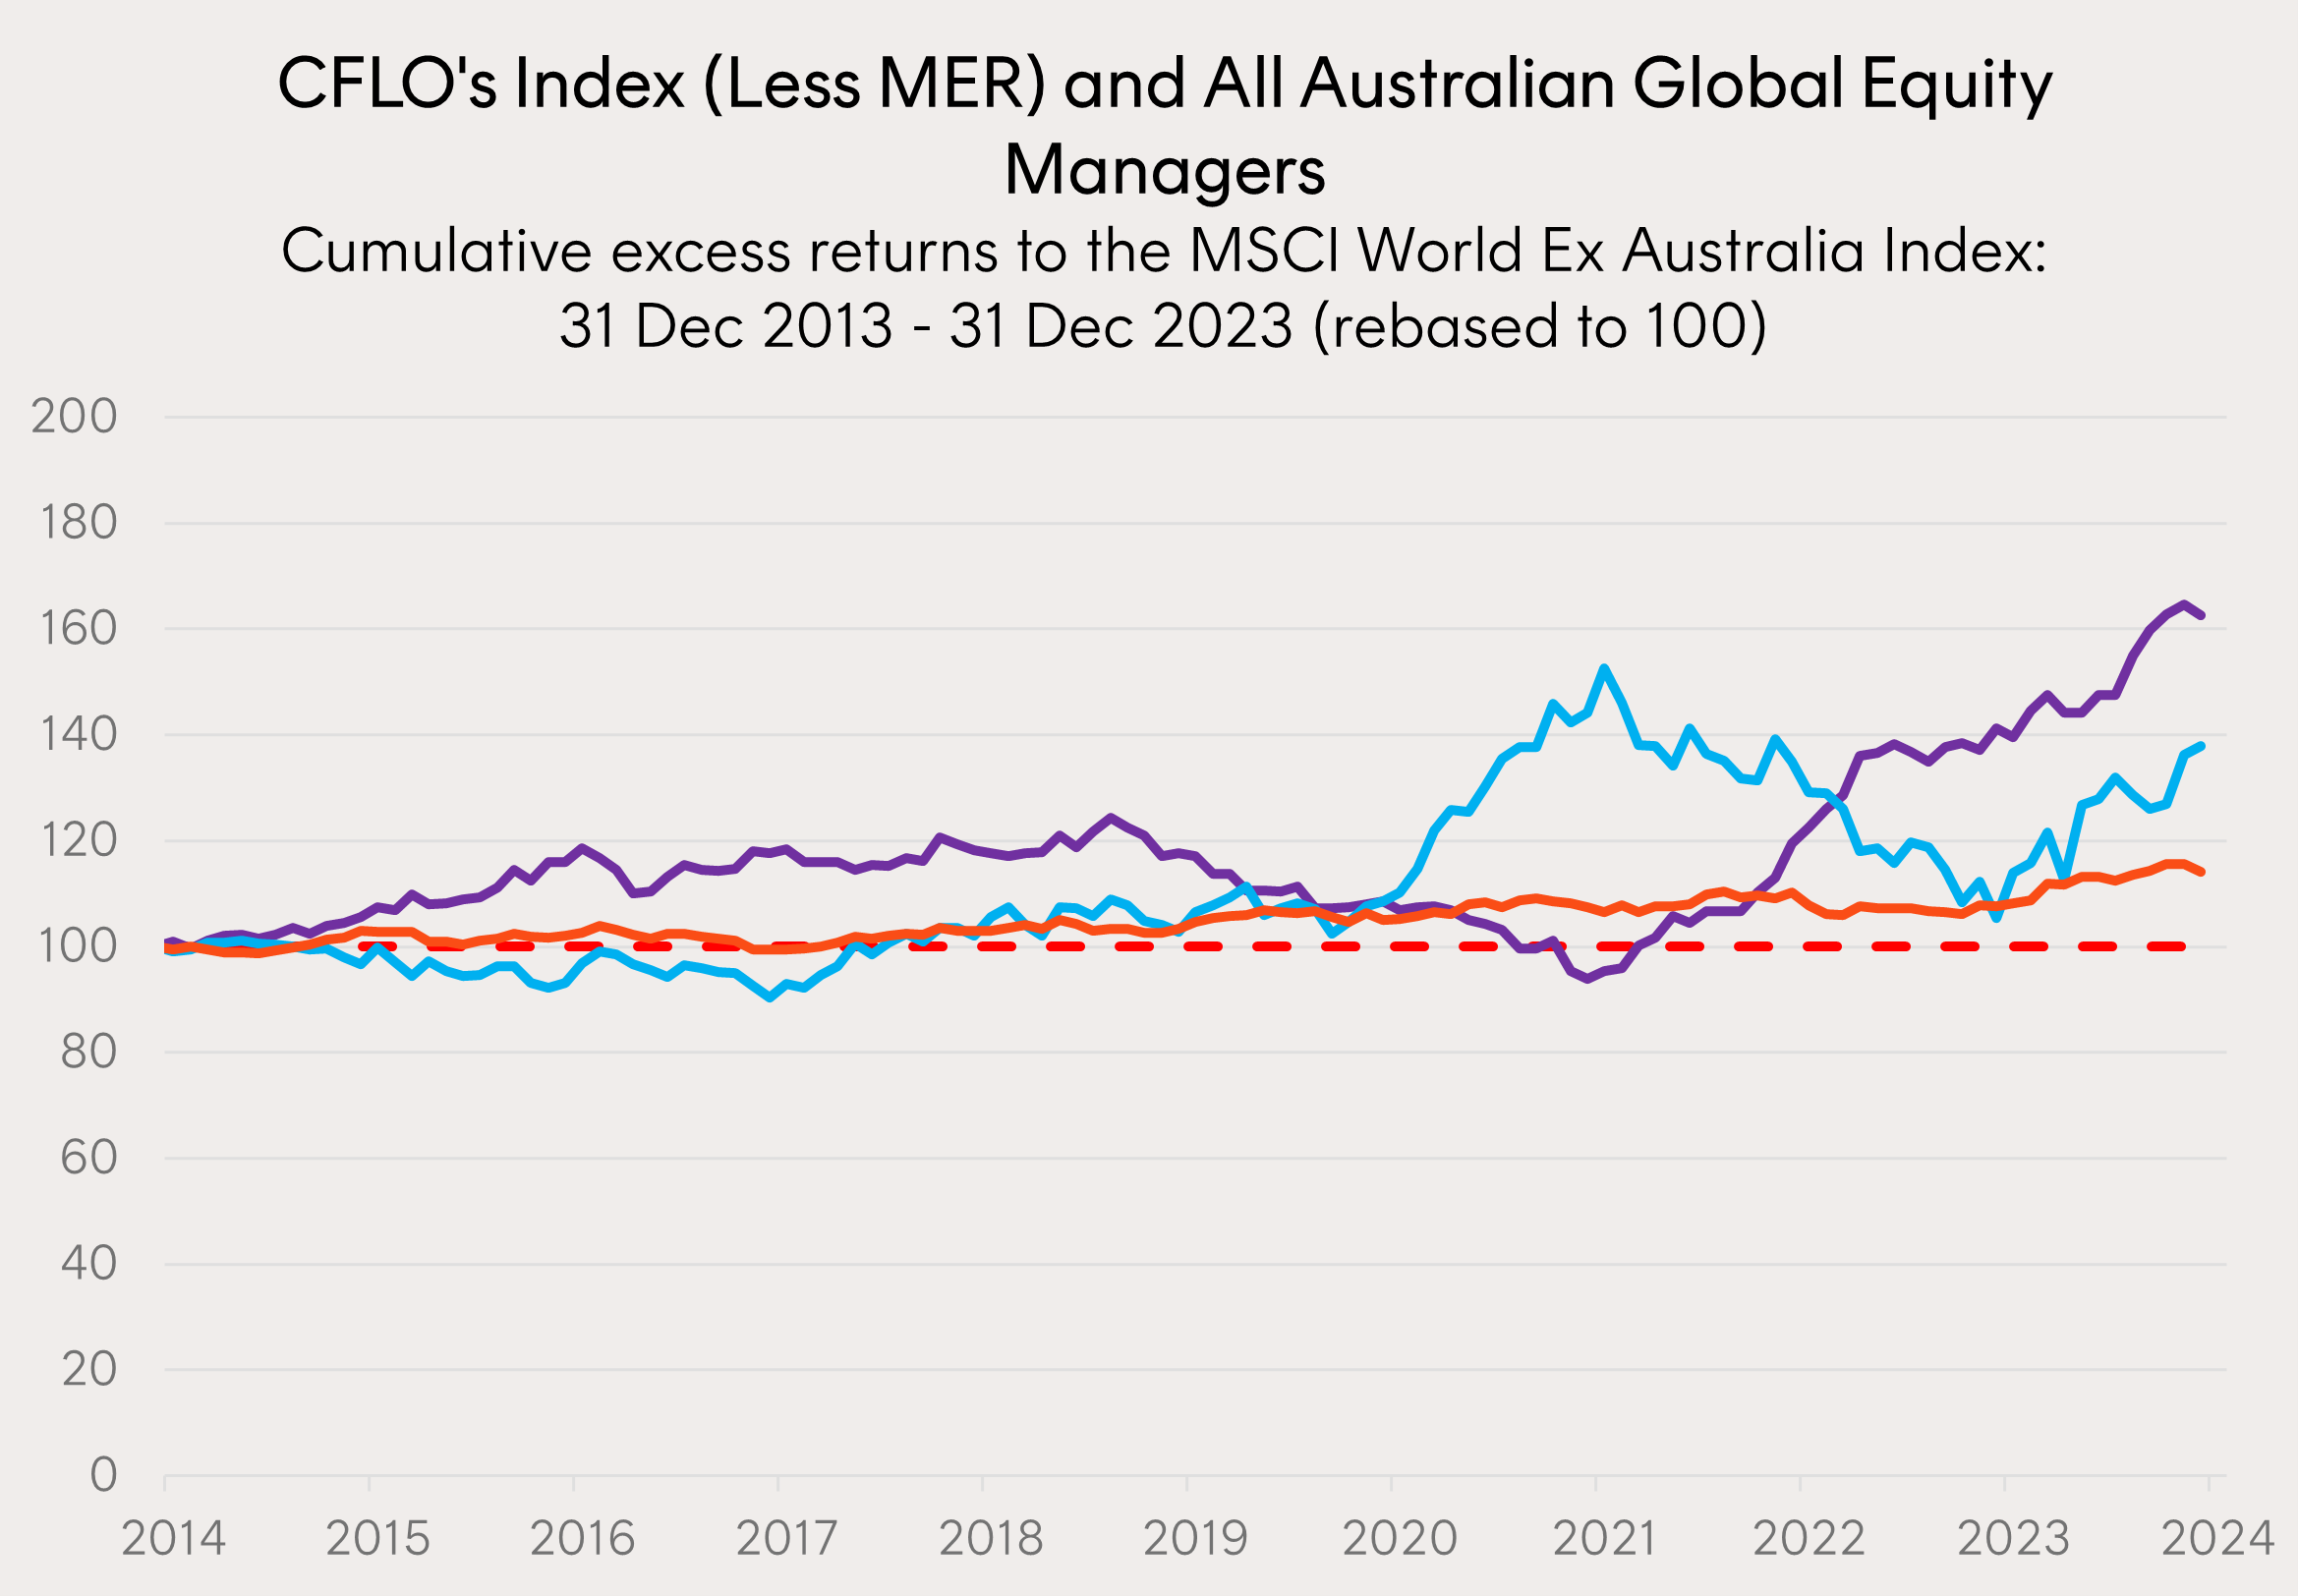
Source: Morningstar. Cumulative excess return is measured relative to the MSCI World ex Australia NR (AUD), based on monthly returns from 31 December 2013 to 31 December 2023. Funds shown are the three best performing over the timeframe in the ‘Australia Fund Equity World Large Growth, Value, Currency Hedged and Blend’ Morningstar categories. Chart shows CFLO Index performance (not actual fund performance) less ETF fees and expenses of 0.40% p.a. to illustrate the longer-term historical performance of global companies that demonstrate strong free cash flow. You cannot invest directly in an Index. Past performance is not an indicator of future performance.
Firstly, focusing on the best performing fund over the ten-year period in purple above. If an investor had chosen and held this fund over the entire 10-year period they would have been rewarded with stellar returns, far above that of any other fund. However, a question has to be asked as to whether investors would have maintained exposure to this fund over the three-year period from 2018 to 2021 when it experienced fairly persistent underperformance against the market. Only by riding out this period would investors have been rewarded with the performance from 2021 onwards.
Similarly, the light blue fund above significantly outperformed the market over the period. However, from 2021 to 2023, with the exception of a few sharp recovery periods, the fund tended to underperform the market and gave up almost all of its previous outperformance.
Finally, focusing on the orange line, CFLO’s Index. While it may appear less exciting without the peaks and troughs of the highlighted active managers the result may be exactly what investors are after. CFLO’s Index grinds steadily higher experiencing very few periods of underperformance and no periods with sharp declines compared to the chosen benchmark.
As a result, over this same time period when comparing the entire cohort’s excess returns and variability of excess returns (i.e. tracking error relative to the MSCI World Ex Australia Index (AUD)), we find that CFLO’s Index stands out against active managers as having relatively low deviations together with strong outperformance over the past 10 years.
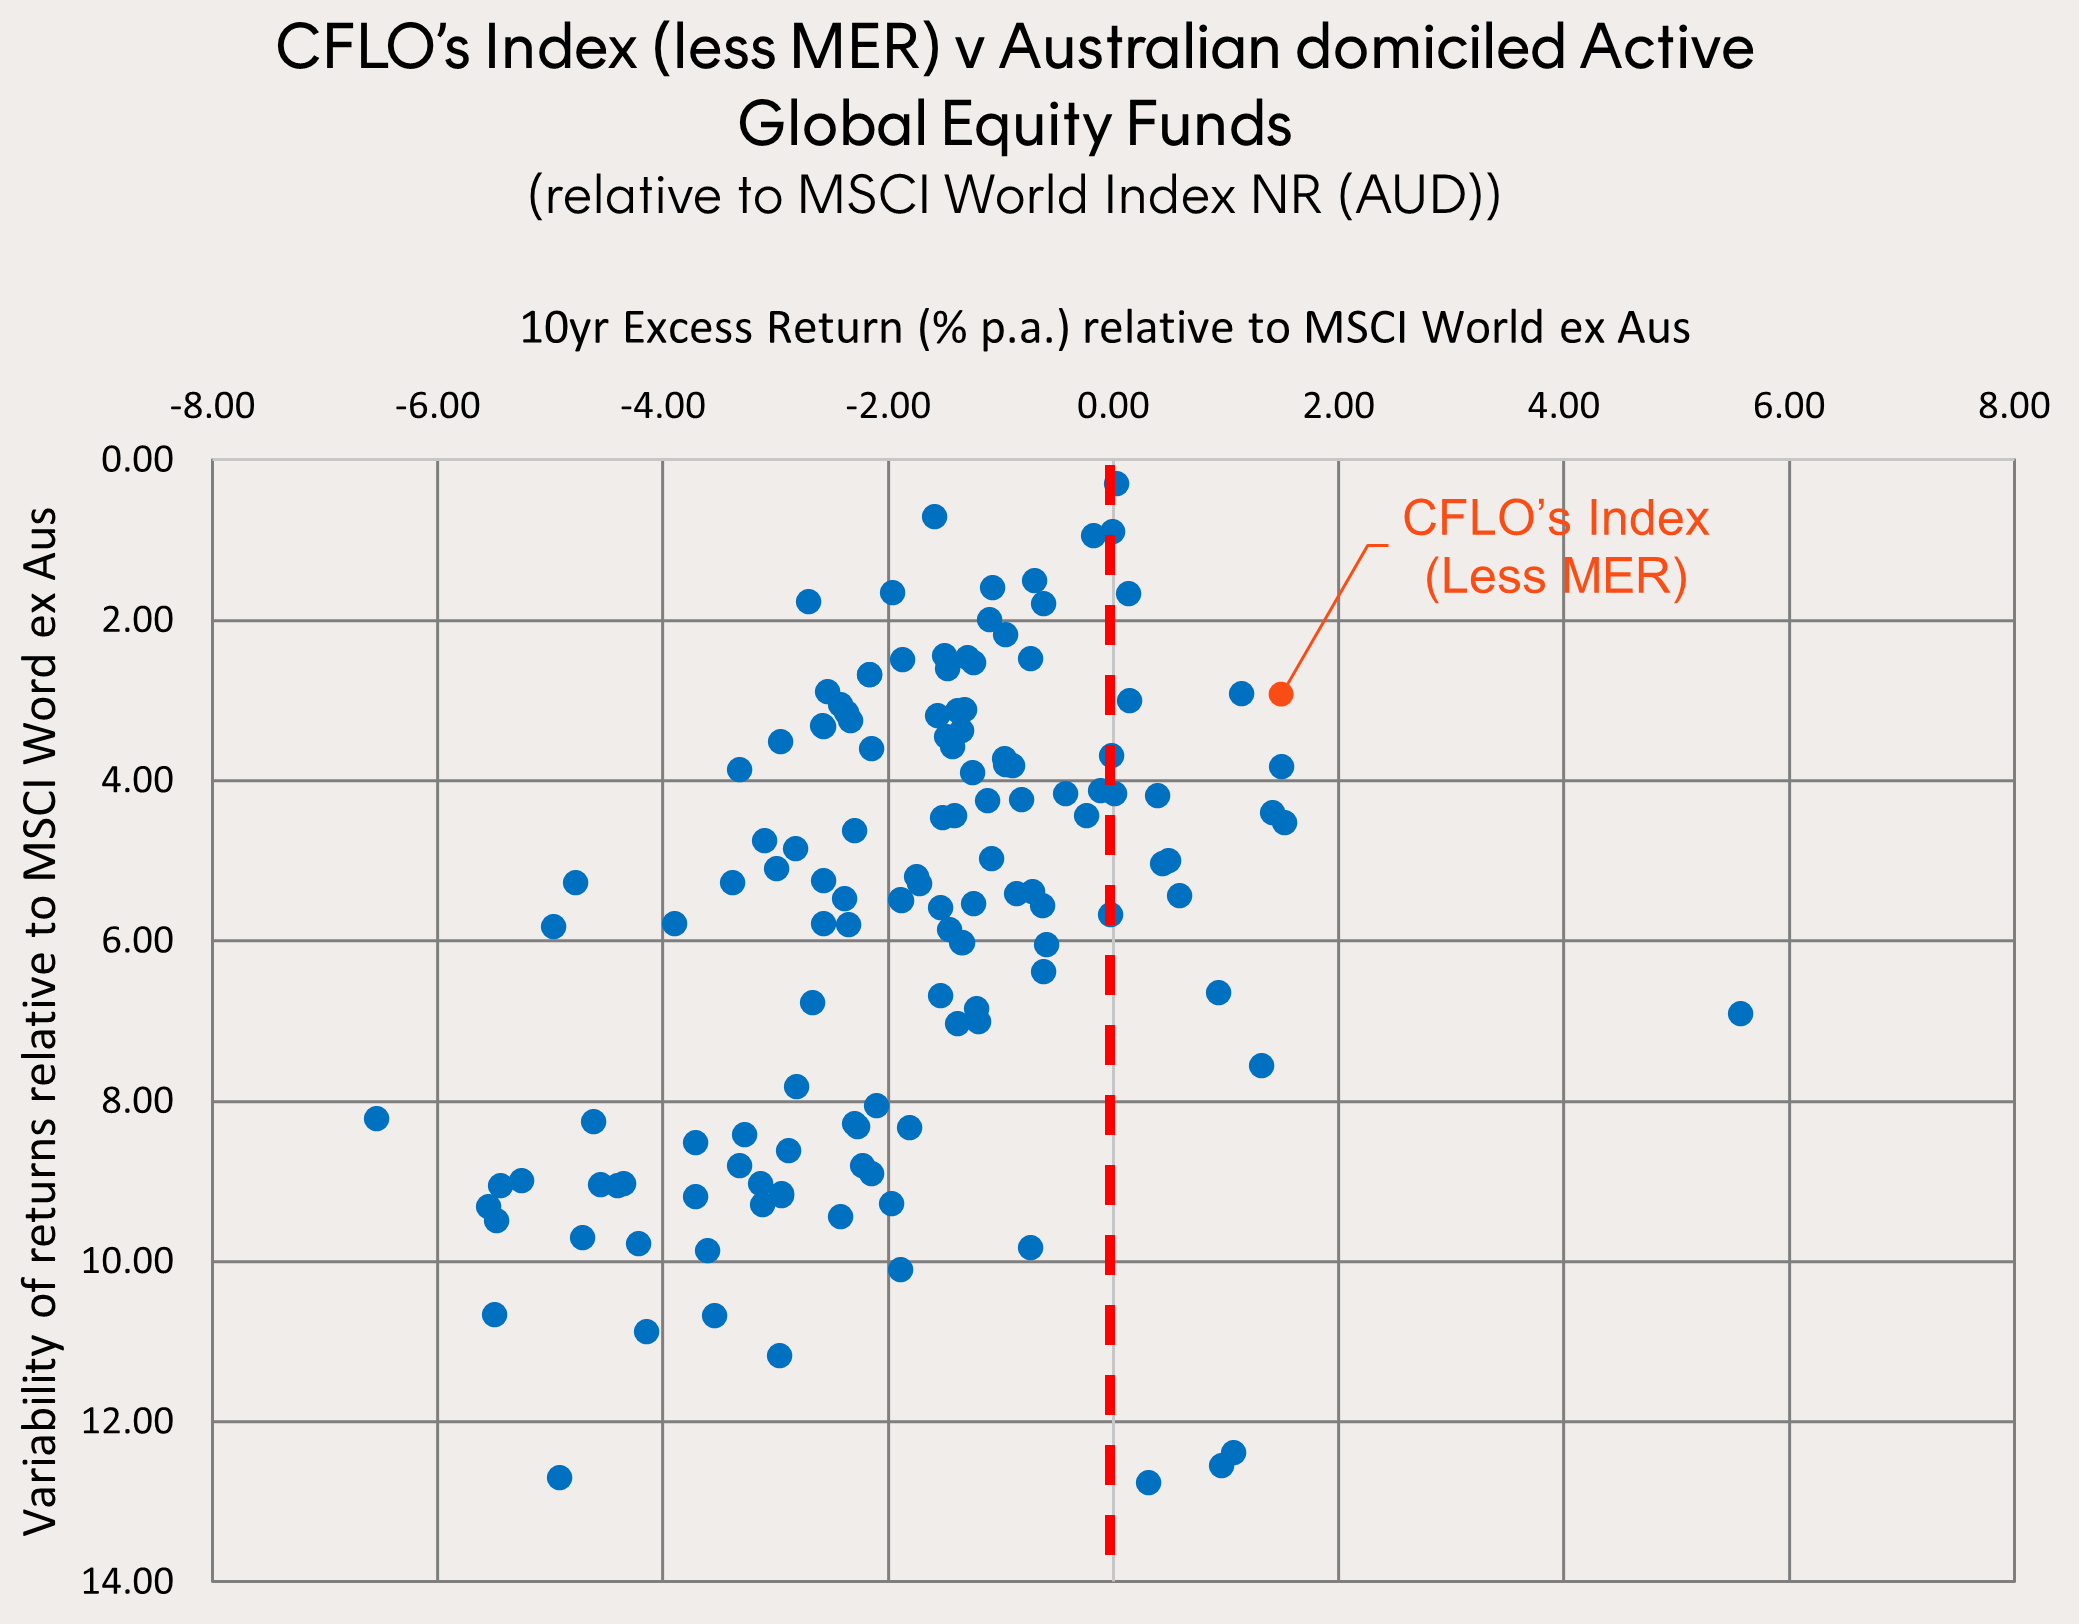
Source: Bloomberg, Morningstar, Betashares. Five largest Australian Active Global Equity Managers from Morningstar Large: growth, value and blend categories as at 31 December 2023 selected as ‘Selected Active Managers’. Monthly rolling 12m excess returns relative to MSCI World ex Australia NR (AUD), ten years to 31 December 2023. Chart shows Index performance (not actual fund performance) less ETF fees and expenses of 0.40% p.a. You cannot invest directly in an Index. Past performance is not indicative of future returns.
CFLO offers the best of both worlds – outperformance potential relative to a fund that tracks a traditional benchmark alone, with the cost effectiveness typically expected of ETFs. And because CFLO has a far lower cost drag than the average active manager, its strategy can support a more ‘index aware’ approach that reduces the risk of underperformance associated with more high conviction active strategies.
CFLO can be used in a diversified portfolio as a core global equities allocation or used alongside existing low-cost passive global ETFs to improve portfolio diversification and fundamentals.
CFLO
Global Cash Flow Kings ETF
keyboard_arrow_down
Invest in a portfolio of global companies that efficiently generate high levels of free cash flow.
For more information on Betashares ETF platform availability please use the following link.

1. Sharpe, W. F. (1991). The Arithmetic of Active Management. Financial Analysts Journal, 47(1), 7–9. http://www.jstor.org/stable/4479386
There are risks associated with investment in the Fund, including market risk, international investment risk, non-traditional index methodology risk and currency risk. Investment value can go up and down and Betashares does not guarantee the performance of the Fund, the repayment of capital or any rate of return. An investment in the Fund should only be made after considering your particular circumstances, including your tolerance for risk. For more information on risks and other features of the Fund, please see the Product Disclosure Statement and Target Market Determination, both available here.
Explore
Funds