



Due to the three official interest rate increases this year and the property tax changes in the Federal Budget, Australian property prices are under pressure.
According to CoreLogic data, national property prices fell 2.8% in the four months to July. In the major capital cities of Sydney and Melbourne, property prices are down 5.3% and 4.9% respectively from their peak levels earlier this year.
Of course this begs the question: how far might property prices fall, and what impact will this have on economic growth and inflation? This note will tackle each in turn.
How far might property prices fall?
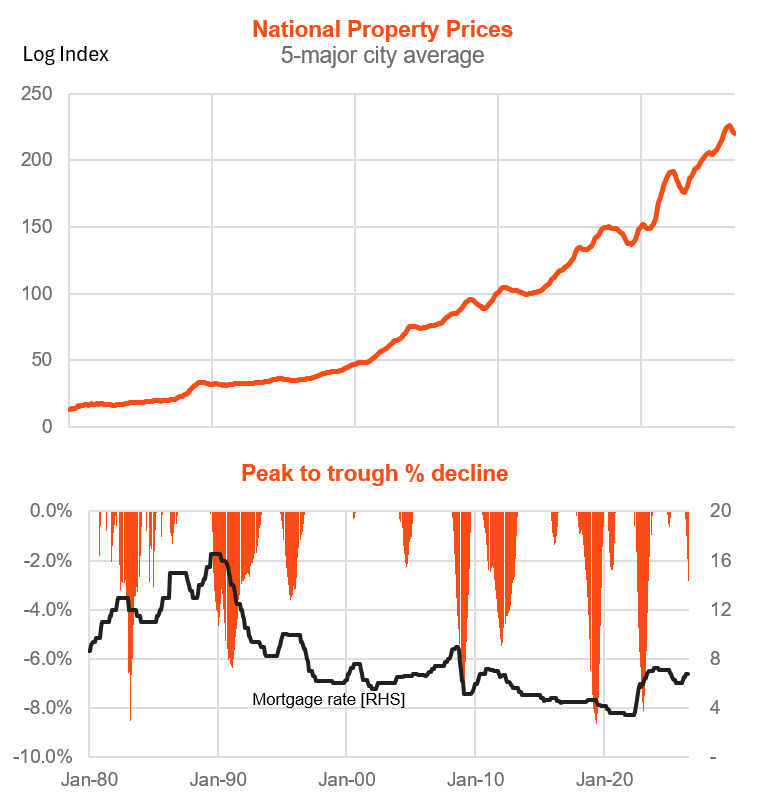
The chart below presents monthly house prices and their peak-to-trough per cent declines since January 1980.
As evident there have been six notable declines of more than 4% over this period, with the average decline over each of these episodes 7.4% and the average duration 15 months. The last two property price corrections in 2018-19 and 2022-23 were 8.6% and 8.1% respectively, with the former lasting 19 months and the latter only nine months.
Source: CoreLogic, LSEG Datastream. Mortgage rate is the major bank variable rate for owner occupiers.
All significant property price declines have been associated with rising mortgage rates, except in 2018-19 which instead mainly reflected a tightening in lending standards for property investors.
Although property price declines have been similar in nominal terms, real property price declines were greater in the 1980s due to higher consumer price inflation and deeper economic downturns. Deflating by trimmed mean inflation, the real property prices declined by 21% in the mid-1980s.
There are conflicting forces determining whether the current property price decline will be relatively large by historic standards.
Arguments suggesting a small price decline are:
- Only a relatively modest lift in interest rates in the past year and likely only modest economic slowdown over the coming year.
- Strong population growth and tight housing supply.
Arguments suggesting a large decline are:
- A major change in property taxation affecting property investors, who have accounted for around 40% of the market in recent years. The decline in investor demand is likely to be relatively larger than in past cycles, though grandfathering of existing tax arrangements for already held investment properties should at least limit their selling.
- Mortgage affordability levels are at historic lows, due to the strong post-COVID run up in house prices and relatively high interest rates compared to those of the past decade.
All up, history suggests we might expect a nominal property price decline of at least around 7-8%, lasting just over a year.
Despite tight supply, I suspect the recent Federal Budget changes and very poor affordability will likely result in a moderately larger decline than seen in recent cycles – perhaps of the order of 10-12%. This view assumes a gradual easing in inflation over the coming year, allowing the RBA to remain on hold over the remainder of 2026, with one rate cut in H1’27.
Of course, if inflation fails to ease in the coming year and the Reserve Bank is required to raise rates and slow economic growth further, then the price decline could be even larger. By the same token, a faster decline in inflation and earlier RBA rate cuts would limit the house price declines.
What impact will falling house prices have on the economy?
Falling house prices affect the economy through several channels.
For starters, there’s the wealth effect. History shows a loose negative relationship between household wealth and the saving rate – when wealth goes down, savings go up – resulting in a slowdown in consumer spending.
According to RBA Research1, a sudden one per cent decrease in the value of housing wealth will lead to a 0.16 per cent decrease in the long-run level of consumption, around half of which happens in the first two quarters.
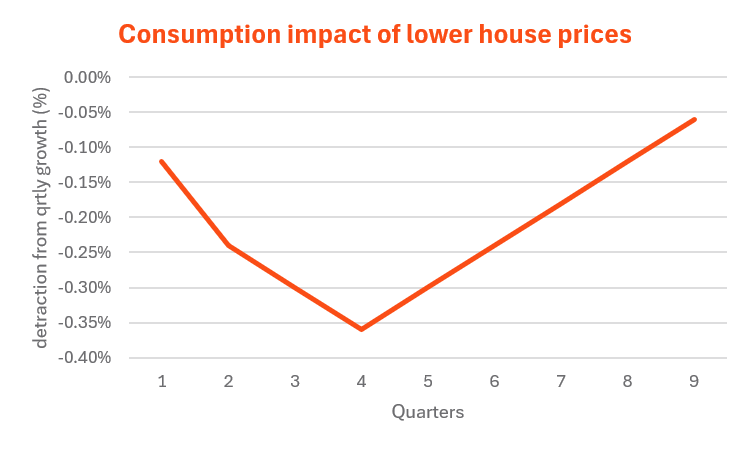
The chart below estimates the detraction from quarterly private consumer spending, assuming a gradual 12% decline in house prices over one year (i.e. 3% decline each quarter) and assuming half the impact occurs in the first two quarters and the other half is evenly distributed over the following four quarters. A 12% house price decline would suggest a cumulative long-run detraction from consumer spending of 1.9%.
Source: Betashares
As is evident, however, the detraction from growth takes place gradually – because the decline in house prices is also assumed to be gradual. The maximum quarterly impact occurs in quarter four, with a detraction from consumer spending of 0.35%. There’s around a 0.25% detraction on average in the first three quarters. The cumulative detraction from growth over the first year is 1%, with a similar detraction in the following year.
Given consumer spending grew by 2.5% over the year to end-March 2026, a 1% detraction to spending would be quite a chunk – potentially slowing spending to the subdued pace evident in 2024.
RBA research further suggests that durable goods are affected most, especially cars and home furnishings. Recreation – like travel – is also affected. Weaker house prices may make it less likely that households dip into housing wealth through a home equity loan to fund major household items or an overseas holiday.
Note consumer spending accounts for around 50% of national output, which implies weaker house prices could slow economic growth by 0.5% in each of the next two years.
Weaker house prices can also weaken new housing construction, as it squeezes the prices developers can charge for new homes and hence make a profit. That said, the recent Federal Budget change could provide an offset, given that negative gearing and the 50% capital gains discount will still apply to new builds.
Although not great news for property owners in the short-term, the weakness in house prices will be an important part of the transmission mechanism in slowing economic growth overall and so help to bring down inflation.
As and when inflation declines, the RBA will likely then move toward rate cuts, which history suggests should then see property prices bottom and their recovery begin.
But beware the inflationary risk of recent tax changes
That said, one potential risk to this scenario of easing inflation is the impact of Federal Budget changes on the rental and new housing market.
The reduction in investor demand for housing could result in fewer rental properties being made available and/or investors over time requiring a higher rental yield to compensate for the loss of negative gearing and capital gains tax concessions. By way of example, if the rental yield on a home was 3.5% and the mortgage rate on a 100% debt financed investment property was 6.0%, the pre-tax cost to an investor would be 2.5% of the value of the home. If the investor were in the top marginal tax bracket, the after-tax cost would be 1.25% (given the ability to offset losses against other income).
To achieve the same after-tax costs without the benefit of negative gearing, the rental yield would need to rise from 3.5% to 4.8%. This could be achieved by either a 35% increase in rents or a 21% decline in house prices over the long-run – or some combination of the two. Note this is not a forecast, merely an estimate of the impact of the loss of negative gearing on the after-tax return for high-income property investors. It’s likely for this reason that the Government decided to grandfather the tax changes so that existing property investors would not feel the immediate loss of negative gearing benefits.
The other inflationary risk is that the retention of negative gearings and 50% capital gains tax discount for new properties could encourage more investors to move into the new housing market, allowing developers to charge higher prices than would otherwise be the case.
Note both rents and new house prices have significant weights on the CPI of 6.6% and 7.5% respectively, whereas established house prices have a zero weight – falling established house prices only influence inflation indirectly through reduced wealth and economic demand effects.