

Hans Lee
6 minutes reading time
Even if things like leather bags, diamonds and Betty White can seem like it, nothing lasts forever. That is a particularly true sentiment in investing. The recent combination of tariff announcements, geopolitical fumbles and threats to central bank independence have caused a sizeable blip in an otherwise-solid bull market.
But given this won’t be the only blip you’ll ever experience as an investor, it’s a good time to ask if the foundations of your portfolio are set up for the long term.
In parts one and two of this series, we gave you some rules on how to assemble your ETF portfolio. In this third and final part of the series, we attempt to put these rules into practice by picking a portfolio of ETFs that we believe you can buy and hold for a very long time.
What is the ideal allocation of a ‘long-lasting’ ETF portfolio?
The answer to this question is that it really depends on your goals, your time horizon and your risk tolerance. But to get you started, let’s look at a couple of model portfolio allocations that professional investors often use.
One traditional approach is the 60/40 portfolio. That is, 60% stocks and 40% bonds in whatever currency you choose.
The premise for this strategy assumes that share prices and bond prices tend to move in opposite directions. When shares have a bad year, bonds can provide a buffer and vice versa. But that isn’t always true – as 2022 demonstrated, when both shares and bonds fell sharply in the same calendar year.
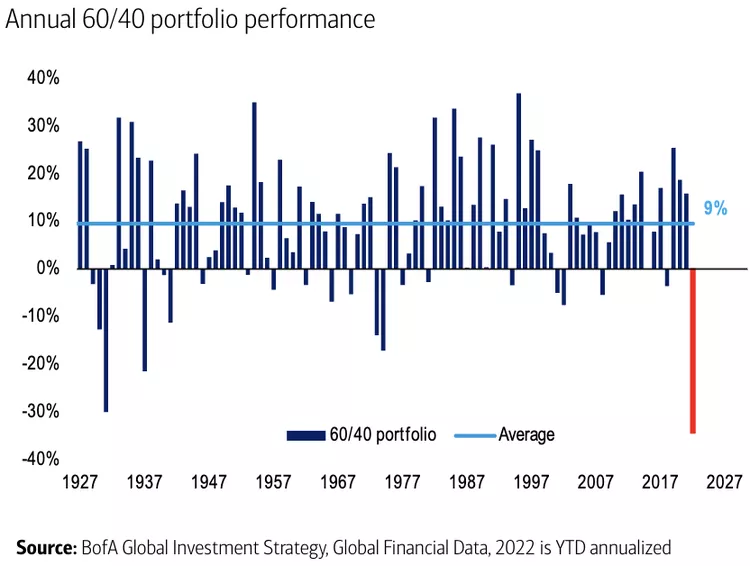
Source: BofA Global Investment Strategy
Historically the 60/40 portfolio has performed best when growth accelerates and inflation decelerates. However, it has tended to perform worse when inflation accelerates and economic growth declines at the same time. As the table from Morgan Stanley Investment Management below demonstrates, a traditional 60/40 US portfolio declines 5.5% in these situations.
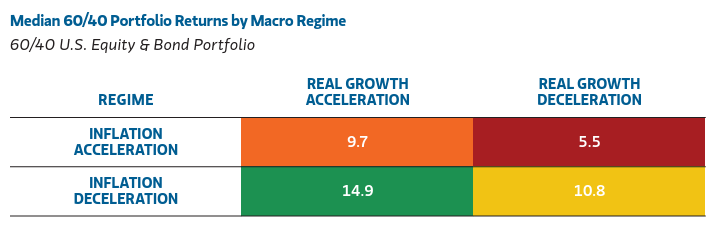
Source: MSIM, Bloomberg, FactSet. Data range for all regimes from 1946 through November 29, 2023. U.S. equities are represented by the S&P 500 Total Return Index (1946-2023) with data provided by Global Financial Data (GFD); U.S. bonds are represented by 10-year U.S. Treasury Total Returns (1946-2023), with data provided by GFD. Index definitions can be found in the disclosure section. Index definitions can be found in the disclosure section. The indexes do not include any expenses, fees or sales charges, which would lower performance. The index is unmanaged and should not be considered an investment. It is not possible to invest directly in an index.
A different potential allocation option is the 40-40-20 approach, championed by such hedge funds as AQR Capital Management and Guggenheim3.
This strategy involves an allocation of 40% in shares, 40% in fixed income and 20% in alternative investments. In Guggenheim’s case, that alternative allocation is commodities, but you can broaden this to include any other alternative assets of interest.
Alternative investments may serve as a hedge against moments when both shares and bonds are each flashing cautionary signals4. Alternatives have traditionally performed well during periods of high inflation and low growth5.
These are just two examples of an asset allocation model, of which there are many you could use to construct a very solid core portfolio. But again, your allocation should be aligned with your investing ambitions and personal circumstances as well as being mindful of the rules we mentioned in the earlier articles of this series.
A model portfolio of long-lasting ETFs
Let’s look now at six ETFs that could fit the brief we set ourselves at the beginning. For the purposes of this exercise, we are constructing a hypothetical model portfolio of ETFs which could be used by a beginner/novice investor. The model in this article will use the 40-40-20 allocation we just talked about but, again, the right allocation should be the one that works for you.
|
ETF |
Type |
Weighting |
Management Fee (p.a.)6 |
1-Year Return |
5-Year Return |
| UMAX S&P 500 Yield Maximiser Complex ETF |
Stocks/Shares |
20% |
0.29% |
13.46% |
14.78% p.a. |
| A200 Australia 200 ETF |
Stocks/Shares |
20% |
0.04% |
13.3% |
12.31% p.a. |
| CRED Australian Investment Grade Corporate Bond ETF |
Fixed income |
20% |
0.25% |
9.69% |
1.93% p.a. |
| AGVT Australian Government Bond ETF |
Fixed income |
20% |
0.22% |
7.39% |
-1.63% p.a. |
| QAU Gold Bullion Currency Hedged ETF |
Alternative investments |
10% |
0.59% |
38.12% |
11.41% p.a. |
| AAA Australian High Interest Cash ETF |
Alternative investments |
10% |
0.18% |
4.45% |
2.48% p.a. |
Source: Betashares, management fee and returns data is accurate as of 30 May 2025. All fund returns data is after fees. Past performance is not an indicator of future performance.
On this sample scenario using a 40-40-20 structure, your weighted average management fee would be 0.237% per annum and, over the past year, you would have seen a hypothetical 13.03% net return (that is, returns minus fees and costs).
Over the past five years, this portfolio would have returned approximately 6.9% p.a. (as at 30 May 2025). This contrasts with a standard Morningstar Australian Dollar denominated 60-40 portfolio, which has produced a 5-year net return of 7.28% p.a. (as at 31 May 2025)7 and the Morningstar Global 60-40 portfolio (USD-denominated) which has a 5-year trailing return of 7.26% p.a. (as at 10 Jun 2025)8.
All this is to say that a) a 40-40-20 portfolio allocation performs just as well as a 60-40 allocation and that b) a diversified portfolio backed by a strong core makes all the difference in setting your portfolio up for long term success.
Set up a strong core and insure your investing future today
While there are no certainties in financial markets, there are many ways to set up a strong core portfolio that gives you both solid returns as well as access to high quality asset classes and investments. Furthermore, whether you choose to apply a 60-40, a 40-40-20, or any other combination of assets, you can build a solid core portfolio as long as you follow the rules we’ve given you in this series.
Investing involves risk. The value of an investment and income distributions can go down as well as up. An investment in a Betashares Fund should only be considered as a part of a broader portfolio, taking into account your particular circumstances, including your tolerance for risk. For more information on risks and other features of each Betashares Fund, please see the Product Disclosure Statement and Target Market Determination, both available on this website.
Sources:
1. Ruth Porat, Alphabet President and CIO (then speaking as the company’s CFO), quote sourced from her commencement address YouTube clip: https://www.youtube.com/watch?v=dGdugTS_RR8
2. Bank of America Global Research, as published in Investopedia: https://www.investopedia.com/60-40-portfolios-face-worst-returns-in-a-century-6751333
3. Morgan Stanley Investment Management, Return of the 60/40, Q2 2024, https://www.morganstanley.com/im/publication/insights/articles/article_bigpicturereturnofthe6040_ltr.pdf
4. https://www.guggenheiminvestments.com/uit/trust/efft001#criteria
5. https://www.cnbc.com/2024/10/30/heres-the-case-for-a-50/30/20-portfolio-allocation.html
6. Other costs, such as transaction costs, may apply. Refer to the relevant PDS for more information.
3 comments on this
Where did you get that Management Fee for A200 ? A bit high
Hi David, my error when editing the piece! It is indeed 0.04%, which is now reflected in the piece. Thanks for catching it!
Is that 5.5% return in the morgan stanley table really -5.5% as implied in the text?