

Cameron Gleeson
8 minutes reading time
Australia boasts one of the highest yielding share markets in the world, but the dividend yield on the ASX200 has fallen significantly and is now below 3.5% p.a.
Aside from the Covid dip, we haven’t had another time in the last 50 years where both the ASX dividend yield and RBA cash rate were below 4% at the same time.
This has massive implications for Australian investors, particularly those that rely on investment income.
In this article, we look at the opportunities and risks of investing for dividend income. We also introduce the HYLD S&P Australian Shares High Yield ETF , which seeks to offer a higher yield than the broader market and can be used as an investor’s core Australian shares allocation.
Dividend sustainability called into question
Australia’s reputation as a high dividend-market rests heavily on the shoulders of the big banks and miners. Recently, this dependence has started to threaten the sustainability of the overall market dividend yield.
Over the last two years, dividends at an index level have been falling as the earnings yield has taken a hit. For example, in February Rio Tinto announced its smallest dividend in seven years, after earnings fell due to both higher production costs and lower commodities prices. Macquarie’s dividends have fallen from their 2022/23 year high, while CBA’s dividend growth has not kept up with its stock price, resulting in an underwhelming dividend yield of 2.73% p.a.1
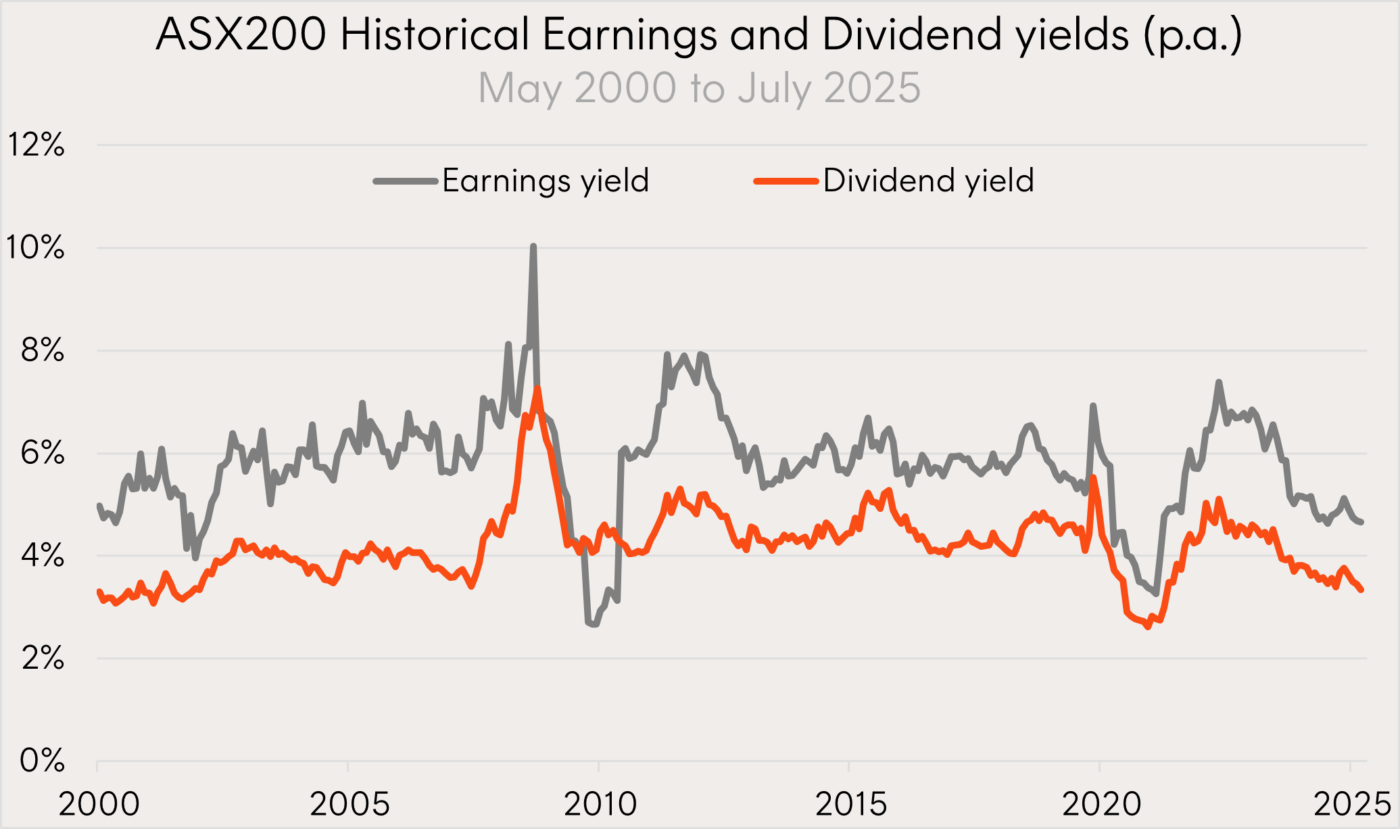
Source: Bloomberg. May 2000 to July 2025. Dividend yield is cash yield before franking, based on trailing 12 months of dividends and the current index level at the time. Past performance is not an indicator of future performance.
As a result, the trailing cash dividend yield of the S&P/ASX 200 is currently 3.34% p.a. – a figure well below its long-run average.
If the broad Australian share market is no longer paying the sort of reliable high yield it used to, how can investors make up for that drop in dividend income today?
Options for earning more dividend income than the market
One option available to Australian investors is to select a portfolio of stocks that have historically paid high dividends, or more specifically have a high trailing yield2. This method is relatively simple to implement, however it implicitly assumes that historical dividends are sustainable, and ignores the market signal provided by the stock price.
As a result, it can leave an investor exposed to ‘dividend traps’ — situations where a company appears attractively priced on historical yield, but in fact future dividends are under threat due to earnings pressure, deteriorating fundamentals or cyclical downturns. Investors chasing yield in companies like Lendlease (ASX: LLC) or The Star Entertainment Group (ASX: SGR) over the past few years have seen both dividend cuts and capital erosion.
Alternatively, investors may screen based on forecast future dividend yield, which uses analysts’ dividend estimates over the next 12 months. Many dividend focussed ETFs rely on forecast dividend yield to select stocks; and this approach, coupled with diversification across a large portfolio of individual names, can be effective.
But while this method provides a more refined view than looking for dividends in the rearview mirror, it introduces a greater reliance on analyst estimates, which may prove inaccurate — especially in sectors with earnings volatility (e.g. resources, cyclicals) or where there is not a deep pool of analysts providing coverage. Moreover, it doesn’t eliminate dividend trap risk entirely, as consensus forecasts may be slow to reflect a deterioration in fundamentals.
A dividend ETF that goes the extra step
Betashares S&P Australian Shares High Yield ETF (ASX: HYLD) goes beyond just relying on analyst dividend forecasts, by also aiming to screen out potential ‘dividend traps.’
HYLD aims to track the S&P/ASX 200 High Yield Select Index, providing diversified exposure to a portfolio of 50 of the highest-yielding Australian companies. This index utilises market-based signals seeking to screen out potential ‘dividend traps’ and stocks where the higher dividend income contribution comes with an unnecessary increase in volatility. More specifically:
- Stocks with a forecast dividend yield over 12% are excluded, as a very high dividend yield may be a signal of dividend sustainability risk.
- Stocks in the bottom 10% for price momentum are excluded – a falling share price may be a red flag which can help investors avoid ‘catching a falling knife’;
- The group of highest forecast yield stocks that pass these initial filters are re-ranked by forecast yield divided by volatility, with the bottom third removed, resulting in a portfolio of 50 companies.
Below are two historical examples of high yielding stocks that were screened out of HYLD’s Index at a time when they were retained within other Australian High Dividend Yield Indexes that rely on forward looking analyst dividend estimates.
Example 1: AMP Limited (AMP) was excluded from HYLD’s Index in July 2018 based on the momentum screen. Despite six years of dividend growth to that point, AMP subsequently cut its dividend in September 2018, and has significantly underperformed the market from that point.
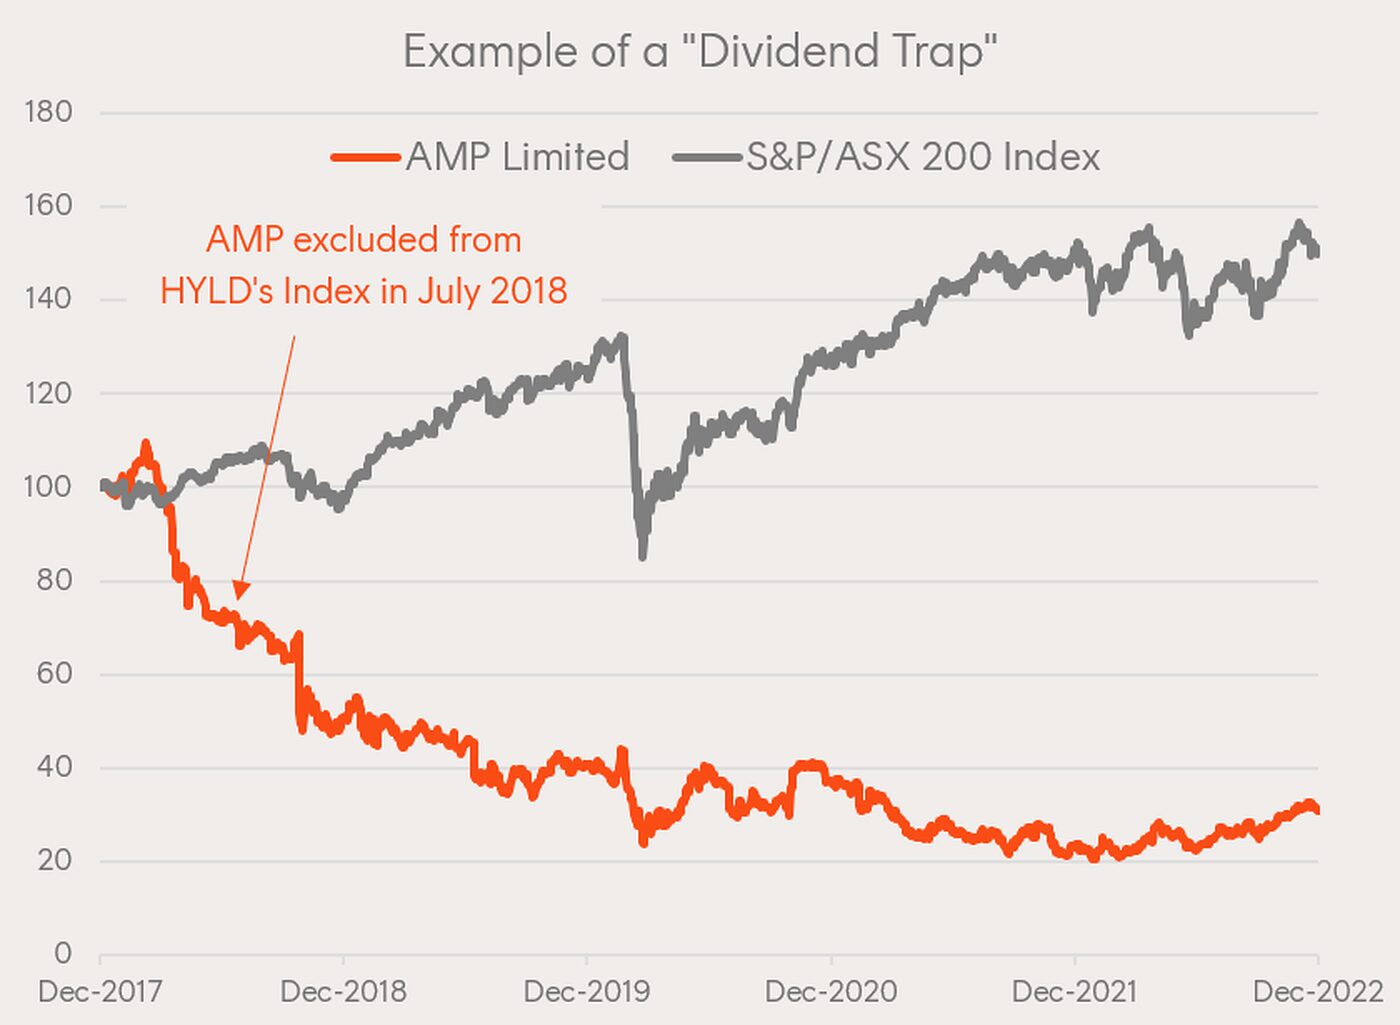
Source: Bloomberg. Total returns from 31 December 2017 to 31 December 2022. Please note the S&P/ASX 200 Index is not HYLD’s index. You cannot invest directly in an index. There is no assurance that HYLD’s Index will screen out all potential dividend trap companies. Past performance is not an indicator of future performance of any index or ETF.
Example 2: Star Entertainment Group (SGR) stopped paying dividends during Covid. Analysts continued to forecast that dividends would be turned back on for a number of years. These forecasts proved overly optimistic, and the company has been close to collapse for much of 2025. SGR was excluded from HYLD’s Index in July 2020 based on a number of screens.
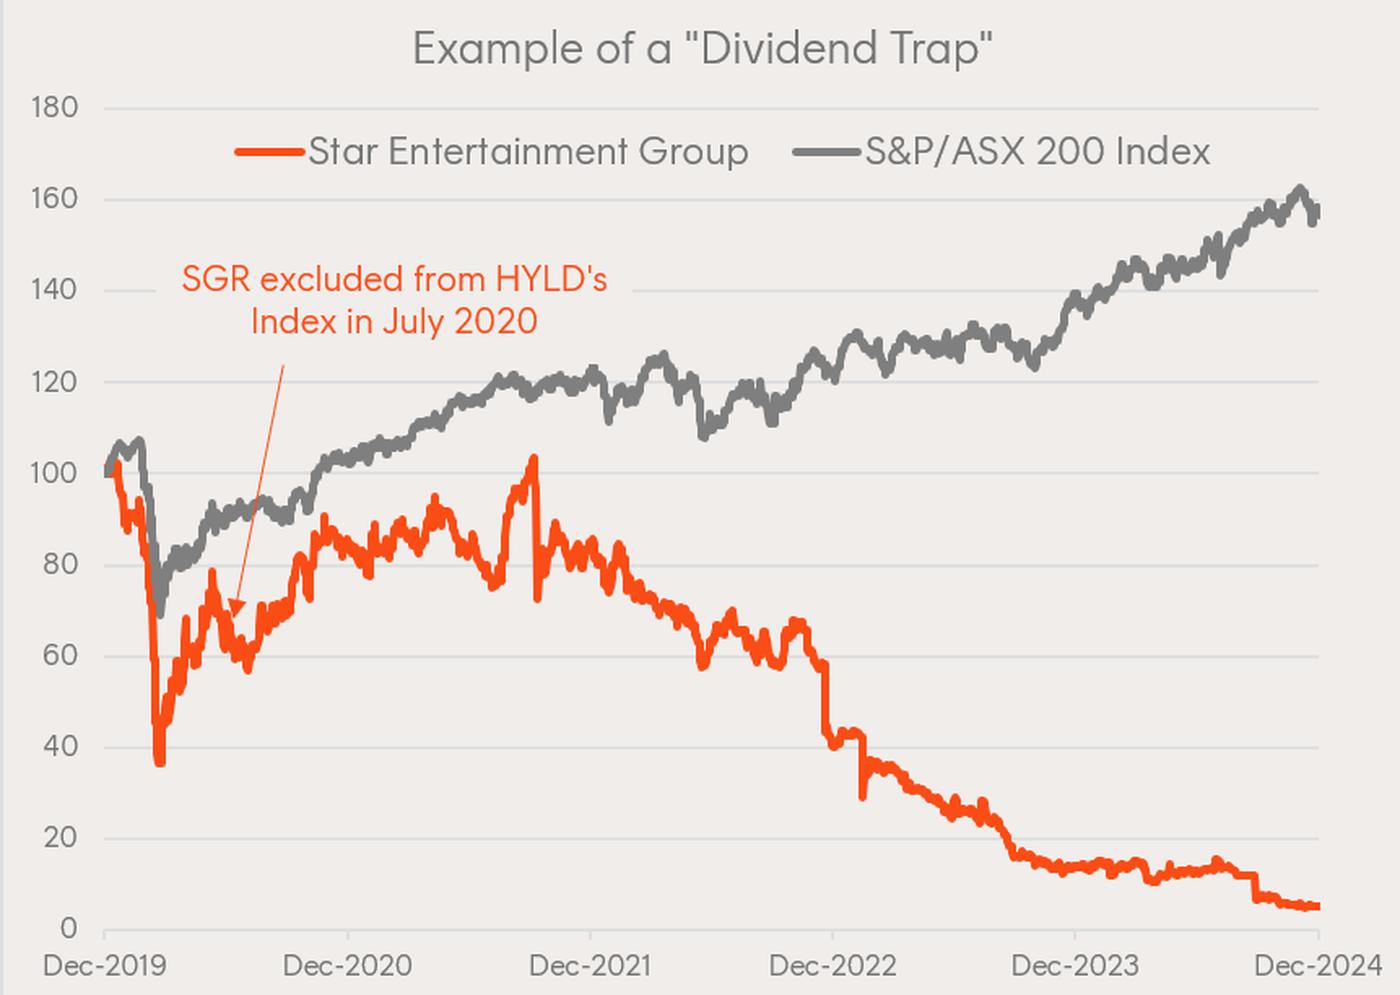
Source: Bloomberg. Total returns from 31 December 2019 to 31 December 2024. Please note the S&P/ASX 200 Index is not HYLD’s index. You cannot invest directly in an index. There is no assurance that HYLD’s index will screen out all potential dividend trap companies. Past performance is not an indicator of future performance of any index or ETF.
Potential for strong income and performance
It’s important to note the HYLD’s exclusionary screens will not catch every high dividend stock that underperforms, but even screening out a small number of such stocks can positively contribute to performance. HYLD’s Index has outperformed the S&P/ASX 200 Index by 1.69% p.a. (net of HYLD’s management fee) from HYLD’s Index inception date in July 2011 to 31 July 2025, at a slightly lower level of volatility.
|
S&P/ASX 200 High Yield Select Index (less 0.25% MER) |
S&P/ASX 200 Index |
|
|
Annualised Total Return (%) |
||
|
1-Year |
12.10 |
11.80 |
|
3-Year |
13.78 |
12.31 |
|
5-Year |
14.66 |
12.23 |
|
10-Year |
8.24 |
8.62 |
|
Since Index Inception (31 Jul 2011) |
11.12 |
9.43 |
|
Annualised Volatility (%) |
||
|
Since Index Inception (31 Jul 2011) |
15.01 |
15.03 |
Source: Bloomberg. Total return and volatility data to 31 July 2025. For HYLD’s index (the S&P/ASX 200 High Yield Select Index) the figures are net of HYLD’s 0.25%pa management fee. You cannot invest directly in an index. Past performance is not an indicator of future performance of any index or ETF.
HYLD’s index minus management fee performance is shown above to illustrate the strategy’s performance over various time periods, since HYLD itself was launched on 1 August 2025.
Importantly, HYLD’s Index also delivered a dividend yield that has been 30% higher on average than that of the broad S&P/ASX200 Index for the period 31 July 2011 to 31 July 2025.
With management fees of only 0.25% p.a.3, distributions paid monthly and outperformance potential from a diversified portfolio of 50 high yielding Australian companies, HYLD can be used as an investor’s core Australian share allocation.
Instead of building and monitoring your own portfolio of dividend paying stocks, you can buy HYLD in a single trade on the ASX today.
There are risks associated with an investment in HYLD, including market risk, concentration risk, index methodology risk and index tracking risk. Investment value can go up and down. An investment in the Fund should only be made after considering your particular circumstances, including your tolerance for risk. For more information on risks and other features of the Fund, please see the Product Disclosure Statement and Target Market Determination, both available at www.betashares.com.au.
The S&P/ASX 200 High Yield Select Index (Index) is a product of S&P Dow Jones Indices LLC or its affiliates (SPDJI) and ASX Operations Pty Ltd (ASX) and has been licensed for use by Betashares. S&P® is a registered trademark of Standard & Poor’s Financial Services LLC (S&P); ASX® is a registered trademark of ASX and these trademarks have been licensed for use by SPDJI and sublicensed for certain purposes by Betashares. The Fund is not sponsored, endorsed, sold or promoted by SPDJI, S&P, their respective affiliates, or ASX, and none of such parties make any representation regarding the advisability of investing in the Fund nor do they have any liability for any errors, omissions or interruptions of the Index.
Footnotes:
[1] 12 month trailing cash dividend yield, as at 29 July 2025.[2] Trailing yield is a backward looking measure which is typically calculated as the total dividends paid by a stock over the past 12 months divided by its current share price.[3] Other costs, such as transaction costs, may apply. Please refer to the PDS.
8 comments on this
When will you realease your holdings within the fund?
Hi Nick, the holdings are now available on the fund’s page https://www.betashares.com.au/fund/australian-shares-high-yield-etf/#holdings-and-allocation
Regards,
Betashares Customer Support
Hi Cameron,
Congrats on the release of a new dividend product. The one thing that keeps befuddling me is why do the product managers continue to choose methodologies that uses all forms of mechanisms to attempt to avoid dividend traps but avoid the incredibly obvious methodology that captures quality companies with growing dividends.
Products like SCHD, SCHY, DGRO, and IGRO from the US have shown that those sort of methodologies provide a sustainable and growing dividend, which is far superior than using arbitrary mechanisms like momentum (market sentiment dependent). Not to mention that the AUM for each of those products show a huge interest.
Is it a lack of imagination from Aussie fund managers or that Aussie investors are just interested in the short term hits?
Thanks.
Hi Zach, Thanks for your feedback and support on the new product.
You’ve highlighted a strong point. Strategies like SCHD and DGRO have clearly proven popular for their focus on quality, growing dividends. In fact, we’ve adopted a similar approach globally with our INCM ETF, which follows a Dividend Aristocrats-style methodology.
In the Australian market, however, applying that same approach is more difficult due to the smaller and more concentrated ASX, which limits the number of suitable companies. That’s why alternative factors, like momentum or yield, are sometimes used locally.
We genuinely appreciate insights like yours as they help shape future product development.
Regards,
Betashares Customer Support
just looked hyld and there is no data going back more than a month. but this article says it’s been going for years?
Hi Steve, the HYLD ETF was only launched on the 1st of August 2025, whereas the index was created back in 2011. You can view a summary of the index performance on the HYLD fund page under “Performance” https://www.betashares.com.au/fund/australian-shares-high-yield-etf/#holdings-and-allocation
Regards,
Betashares Customer Support
Zach: What Cam missed in his response is that Australia cannot be compared to the US market and it simply isn’t possible to start products like SCHD or DGRO here. You simply can’t. Outside of companies like SOL, CBA and MQG Australian management teams cannot for the life of them create sensible capital management policies where they pay a “decent” dividend with a moderate payout ratio of say 40-60%, and keep room for growth in future years or have the capital for rainy days.
Australian companies typically sneeze out all their dividends based on the year’s income because shareholders and management teams are addicted to franking credits. That means you get 5,6, 9% dividends in one year, but because management teams don’t keep much money in the kitty, next year that yield is cut to 1% because of some economic calamity.
Whereas in the US, companies typically start at 0.5-2% dividends… yes they’re low, but they reinvest more back into their business to grow that dividend often by 10-20% each year, but importantly the dividends are sustainable.
how does HYLD compare to YMAX, which I laready have.