
Chamath De Silva
9 minutes reading time
- Fixed income, cash & hybrids
This information is for the use of licensed financial advisers and other wholesale clients only.
Commentary from the Betashares portfolio management desk by head of fixed income Chamath De Silva, providing an overview on fixed income markets.
Given the fireworks we had in global bonds last week and with US CPI fast approaching, it’s a good time to take stock.
Over the past couple of weeks, we’ve seen a fairly aggressive bear steepening sell-off (i.e. long-term yields rising by more than short-term yields) across developed bond markets, with the move led by higher real yields most recently, driving some profit-taking in tech stocks and reawakening both rates and equity volatility following a period of moderation. At the time of writing, the US 2s10s and 5s30s yield spreads have steepened +40 basis points from the July lows, with the latter now back out of inversion.
We know narratives had been in flux throughout this hiking cycle, constantly moving between ‘recession,’ ‘soft landing’ and ‘higher for longer,’ but this latest move in yields is quite different.
First of all, it’s a bear steepening of global curves with little change in short-to-medium term policy rate expectations, whereas the bear flattening on rising terminal rate expectations had been the dominant yield curve dynamic throughout the hiking cycle.
In addition, the catalysts behind the move were largely technical in nature I’d argue, with three notable developments all emerging within the span of a week:
- Fitch downgrading the US credit rating to AA+ from AAA.
- The US Treasury’s Quarterly Refunding announcement and auction schedule.
- The Bank of Japan’s (BoJ) yield curve control (YCC) tweak.
It’s likely that the moves are a confluence of several catalysts, but I’m personally downplaying the impact of the Fitch decision. Firstly, following the S&P downgrade in 2011, credit ratings arguably lost relevance for developed market sovereign bonds, with such paper getting automatic inclusion in institutional mandates. In addition, much of the G7 universe was already trading below AAA, namely Japan, UK, France and Italy, with the remaining AAA universe aside from the US actually very small in size, accounting for only 7% of sovereign debt outstanding today (based on Fitch ratings).
Technical and fundamental catalysts
While the Fitch decision got the most headlines, the view among traders was that the Treasury’s Quarterly Refunding announcement of more ‘coupon’ issuance than expected was far more impactful (see link to statement).
For much of Q2, there had been concerns around Quantitative Tightening (QT) finally biting on the back of pent-up issuance following the passage of the debt ceiling bill. What participants had originally underestimated was just how much of the most recent issuance wave would be skewed towards T-bills, which had a wall of ‘stored demand’ via the Fed’s reverse repo facility. However, with the Treasury bumping up against its own bill issuance limit, it’s forced now to issue longer-term debt in size, potentially creating a duration imbalance in the market, with this indigestion compounded by the Fed running off its balance sheet.
Given the US fiscal deficit has grown in recent quarters (in contrast to expectations of fiscal contraction as the US economy rebounded post-Covid) and the Congressional Budget Office’s economic outlook suggesting this isn’t likely to change any time soon, this leads many to ask the question of who will buy all this long-term debt? This question naturally segues to Japan, the world’s largest creditor and currently the largest holder of US Treasuries.
The BoJ’s YCC tweak had initially been written off as a non-event (despite a fair bit of fanfare the day prior following a reveal in the Nikkei newspaper). Ultimately, the early view was that the new ‘soft band’ (at -/+0.5%) won’t see any major changes, with the ‘hard’ upper bound of +1.0% unlikely to be tested anytime soon.
While it’s clear the BoJ will be very incremental in its policy normalisation, the JGB market still sold off heavily by its standards in the days following the decision. It bears repeating that YCC in Japan entails de facto YCC in the rest of the developed world, given Japan’s role as the world’s largest creditor and the fact that Japanese investors typically hedge a good portion of their global bond exposures.
This policy-induced steepening makes JGBs all the more attractive on an FX-hedged basis vs foreign bonds (including Australian bonds, which are now yielding around 150bps below 10yr JGBs on a JPY-hedged basis), being one of the few yield curves to offer meaningful carry and roll-down. The BoJ’s heavy hand in the JGB market has crowded out domestic private sector participation for as long as most can remember, and as the Bank’s presence finally recedes over the coming years, a void will be created, allowing for repatriation flows in size.
Amid these technical moves, it’s worth noting that there are some signs that US economic growth is inflecting higher over the coming months, with both real output and headline inflation potentially re-accelerating. A couple of weeks ago, we saw inflation breakevens and inflation swaps jump alongside strength in commodity prices, while the Atlanta Fed’s GDPNow nowcast model recently surged to 3.9% (real GDP, annualised), implying that nominal growth might be picking up again.
Technical-led sell-offs are to me dip-buying opportunities, as it’s the ‘macro fundamentals’ of growth, inflation, and policy that move the needle over the longer term. I maintain the worst thing for the bond market isn’t necessarily Japanese investors repatriating capital or even inflation remaining stubborn over the medium term, but rather growth showing resilience in the face of the most aggressive hiking cycle in a generation, driving estimates of the long-run neutral real rate much higher, which truly justifies a further bear steepening.
Fear the steepener?
While a lot of ink has been spilled discussing the US yield curve inversion and its historical success as a leading recession indicator, it’s worth remembering that it’s not the inversion itself that risk assets dislike, but rather the re-steepening from inversion.
So, should we be worried now?
The curve can steepen for several reasons, including, but not limited to:
- Growth and inflation expectations re-accelerating.
- Policy becoming more accommodative.
- Increased supply of duration to the market.
- Growing inflation risks and longer-term policy uncertainty, raising the term premium on bonds.
- Growing risk aversion, raising the risk premium on all forms of duration.
- Forced liquidations of all leveraged carry trades.
Although a steepening of the curve per se isn’t bad for equities, the worst equity drawdowns historically occurred during steepening moves. The bear steepening we’re currently experiencing reminds me a little of the taper tantrum, and provided the outlook for growth remains constructive, equities overall might be ok, although we could see a fair bit of rotation between sectors and styles and continued profit-taking in the YTD winners – namely US megacap tech and Japanese stocks.
Generally, it’s the bull steepening we have to worry about, and we saw signs of it immediately post-SVB before the emergency liquidity injections helped put in a floor. What I’m personally keeping an eye on are breakevens, and if they start plunging during a steepening move, then that’s the time for risk assets to worry as that would point towards a larger deleveraging move supported by deteriorating nominal growth. We’re not there yet and a moderate pickup in volatility isn’t cause for panic, but the bond market should still command our attention over the coming weeks, as risks for yields remain pretty well-balanced in my view, including the possibility that the market increasingly prices out the cuts that are still priced in for 2024.
Chart 1: US Treasury Yields
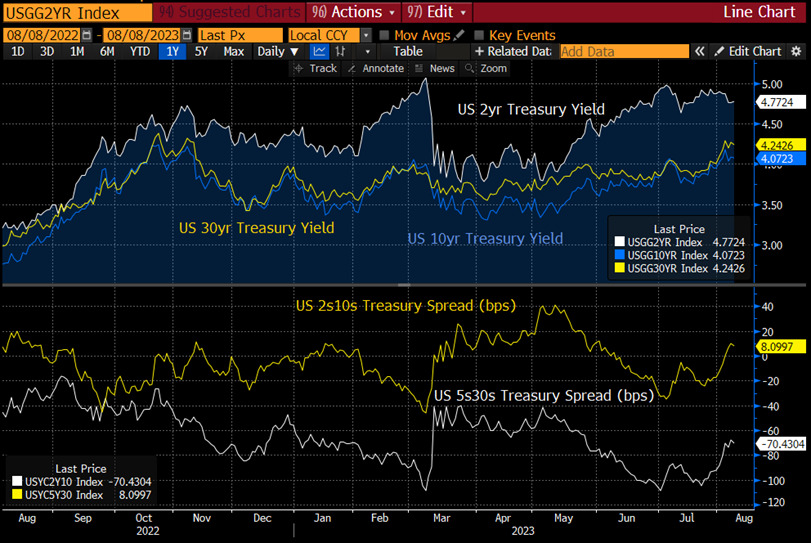
Source: Bloomberg
Chart 2: US Real yields ad breakevens
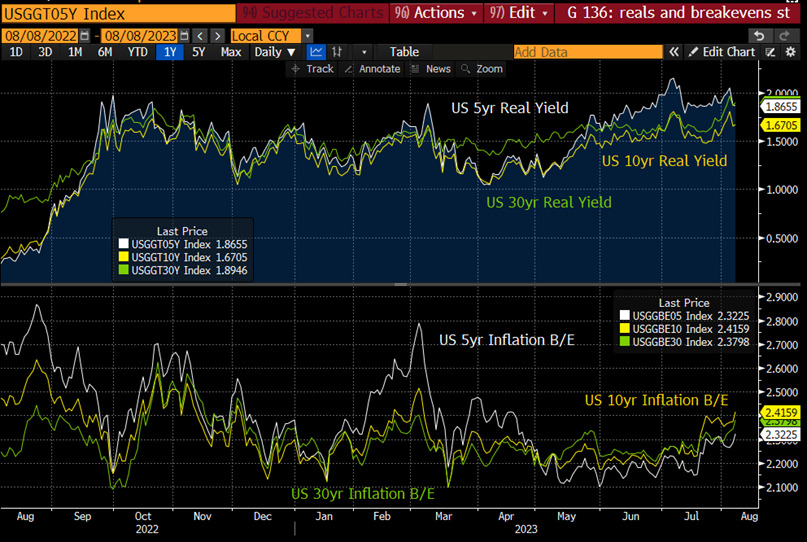
Source: Bloomberg
Chart 3: Japanese 10yr and 30yr Yields
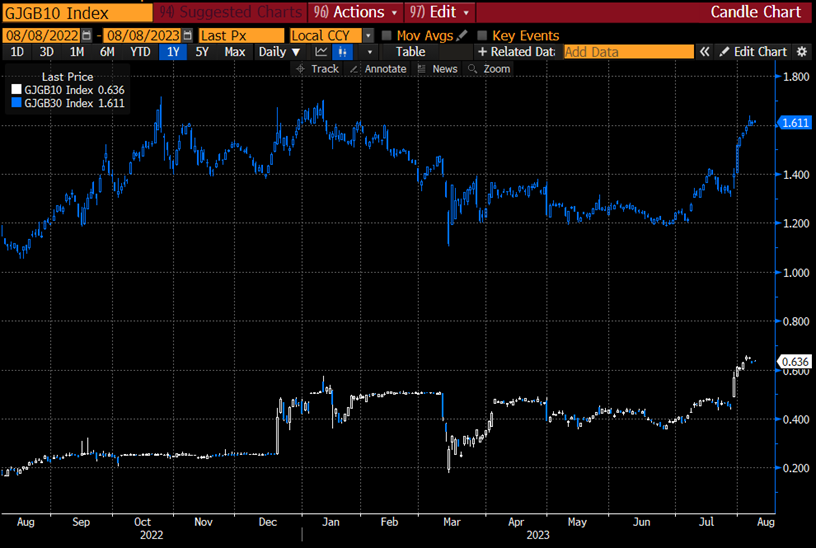
Source: Bloomberg
Chart 4: BoJ’s YCC “explainer” slide
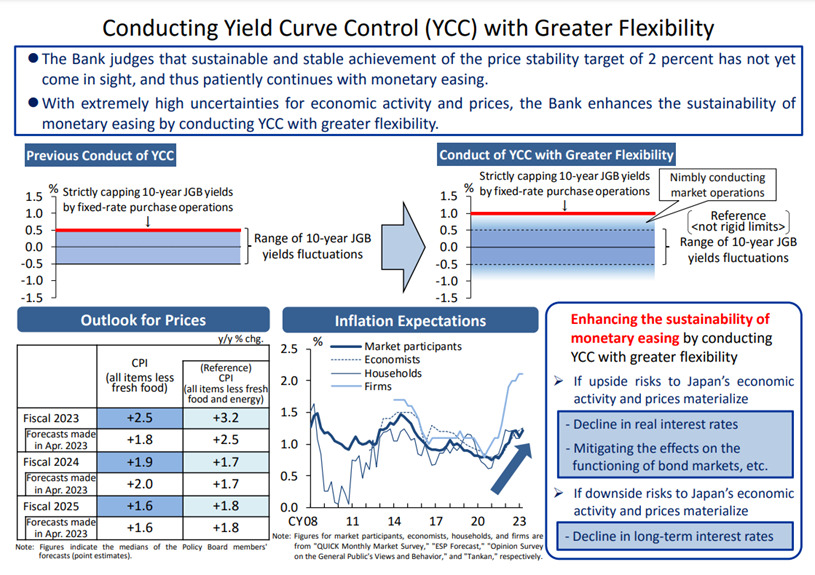
Source: BoJ
Chart 5: Australian government bonds and JPY-hedging
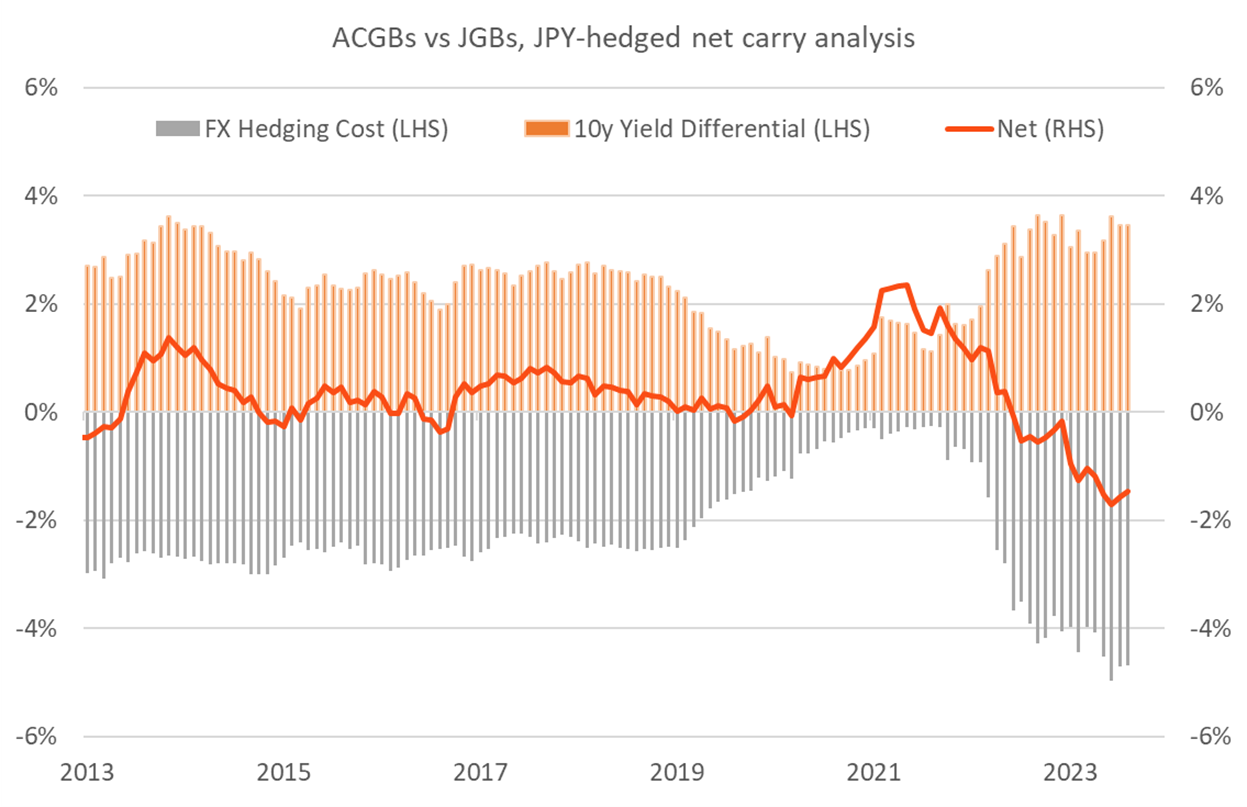
Source: Bloomberg, Betashares
Chart 6: US budget balance as % of GDP
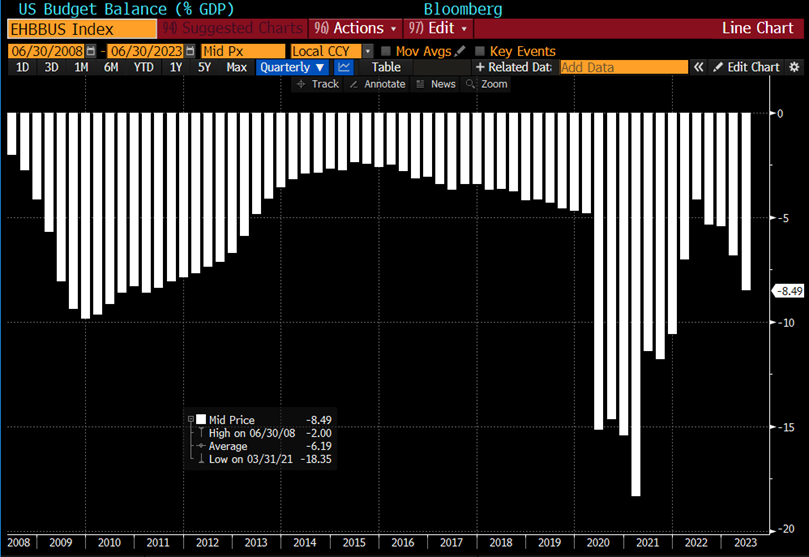
Source: Bloomberg
Chart 7: Atlanta Fed GDPNow (Q3 real GDP nowcast, annualised)
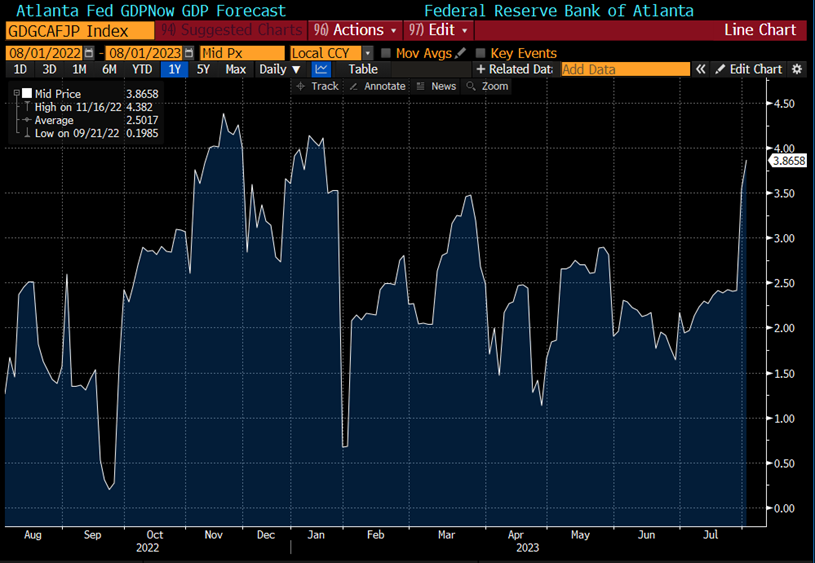
Source: Bloomberg
Chart 8: S&P 500 drawdowns (top panel) and historical UST curve re-steepening (3m10y) from inversion (lower panel) over the past 50 years
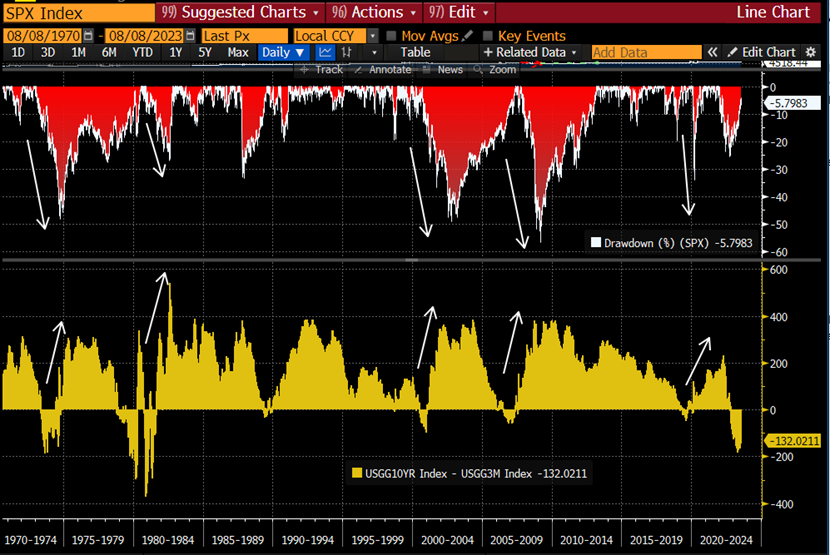
Source: Bloomberg
Important
This information is for wholesale client use only. It is not intended for retail clients.
Betashares Capital Ltd (ACN 139 566 868 AFS Licence 341181) (“Betashares”) is the issuer.
This is general information only and does not take into account any person’s particular circumstances. It is not a recommendation to make any investment or adopt any particular investment strategy. You should make your own assessment of the suitability of this information.
Future outcomes are inherently uncertain. Actual outcomes may differ materially, positively or negatively, from those contemplated in any views, opinions, estimates, projections or other forward-looking statements given in this document. Readers must not place undue reliance on such statements. Betashares does not undertake any obligation to update forward looking statements to reflect events or circumstances after the date such statements are made or to reflect the occurrence of unanticipated events.
The author’s views do not necessarily reflect those of Betashares and are subject to change without notice.
Any past performance information shown is not indicative of future results.
To the extent permitted by law Betashares accepts no liability for any loss from reliance on this information.