
Chamath De Silva
10 minutes reading time
This information is for wholesale client use only.
Commentary from the Betashares portfolio management desk by head of fixed income Chamath De Silva, providing an overview on fixed income markets.
With just over a week to go until the June FOMC and Fed officials now in their blackout period for making public comments, the global macro backdrop has taken yet another intriguing turn. As US inflation fears continue to recede and leading indicators of activity point towards elevated recession risk, price action across assets classes might seem a bit surprising. While the market might be positioned for a US recession, it’s arguably now priced for a soft landing. Bond yields have generally risen (US 10y +35bps since the May FOMC) as terminal rate pricing has been re-calibrated higher amid the persistent resilience of the hard data, particularly on the labour front and fears over the banking sector now in the rear view mirror. Perhaps there’s been no better illustration of this than US non-farm payrolls, which once again exceeded expectations on Friday night. Of the past 12 monthly jobs reports, 11 payroll prints have beaten the median estimate.
What’s been puzzling is not necessarily that risk assets have been buoyant, but rather the strength in US equities has been led by so-called “duration proxies” despite the renewed weakness in bonds. Megacap tech has shrugged off not only higher terminal rate expectations but also higher real yields, which have now reached fresh cycle highs at the front end of the curve and are close to retesting the 2022 levels at the back end. Perhaps it’s not really such a puzzle when viewed through a historical lens. During the Dot Com bubble, growth stocks were able to withstand 10-year real yields surging as high as 4.4% during the final blow-off top, suggesting that secular trends and perceptions of transformational technologies can overwhelm (at least for an extended period) what many perceive as macro constraints, with forward EPS estimates now appearing to have inflected higher even before a recession has officially started.
Closer to home, it’s a similar story for the Australian economy, which continues to grind along despite the most aggressive tightening cycle in a generation. Of note, the economic surprise index moved into “positive” territory during May, suggesting some underlying momentum. Since the RBA’s surprise hike last month, arguably the most significant development was Friday’s Fair Work Commission’s announcement of a 5.75% pay boost for award wages, which has already spurred rate hike bets for June and July, with several sell-side economists now predicting a terminal cash rate of 4.35%. Despite the impending mortgage refinancing cliff now gathering pace, “animal spirits” in relation to the housing market aren’t yet slain, further reinforcing the idea that policy is yet to be truly restrictive. Another local development that caught my attention was the jump in longer-term Australian inflation pricing to fresh cycle highs (despite the US equivalent trading sideways). One possibility, beyond any recalibration in the RBA’s policy reaction function, is simply increased demand for inflation-linked bonds (ILBs) and inflation protection from super funds following news that APRA has selected the AusBond Master and not the AusBond Composite as the preferred domestic fixed interest index under the Your Future, Your Super benchmarking framework. The primary difference between the Master and the Composite is the former includes linkers and credit FRNs, whereas the latter is only fixed-rate nominals. APRA’s decision has already received some criticism from fund managers due to the patchy liquidity in the ILB market and the AOFM’s prior reluctance to proactively increase linker issuance.
The liquidity question
We started the year with many expecting that the process of Quantitative Tightening (QT) from the Fed would produce an accelerated liquidity drain that would keep risk assets pressured throughout 2023. Today, however, many commentators argue that liquidity has actually been a tailwind for financial assets for much of the year. A lack of Treasury issuance amid the debt ceiling impasse has prevented QT from significantly impacting reserves, which, combined with accommodative policy out of Japan and China, helped global liquidity rebound from the October trough (at least through the lens of the four largest central bank balance sheets). Moreover, the Fed’s desired reserve drain was also curtailed by the introduction of the Bank Term Funding Program and a spike in usage of the Discount Window post-SVB, leading to the paradox of a banking crisis and multiple bank failures driving a temporary surge in the most commonly viewed liquidity metric. Systemic liquidity and its impact on asset prices is a very confusing topic, not least because there’s no clear consensus over its definition, let alone how something so nebulous even impacts asset prices. Even today, 15 years after the Fed first introduced QE, there’s still fierce debate over whether balance sheet operations truly impact financial assets or are simply a placebo.
That being said, the fact that the US Treasury has been draining its General Account (TGA, i.e. the Treasury’s bank account at the Fed) has most likely been a positive catalyst for the US economy and the US financial system, compared to expectations. Now that a debt ceiling bill has passed both houses of Congress, it’s expected that we’ll see between US$500 billion and US$1 trillion of issuance over the next few months as the Treasury rebuilds the TGA to more normal levels. Whether that issuance will create an acute liquidity squeeze depends on several factors, including the maturity profile of the intended issuance. As the Fed’s own reverse repo facility (RRP) has already removed US$2 trillion of liquidity from the broader financial system, there is a chance a large portion of the Treasury bill issuance could be absorbed by money market funds already using the RRP, simply creating a substitution with no net impact on reserves. If much of the issuance is via longer-term bonds, it could very well create a net liquidity drain, compounding the effects of QT.
Long and variable lags in the credit cycle
If high yield spreads are anything to go by, perhaps it’s too early to be jumping on the US recession trade just yet. At around 423bps over Treasuries, USD junk bond spreads are actually tighter than where they began the year and have compressed almost 100bps from levels seen during the height of the banking stress in March. Even high yield spreads within financials have changed little over the year. With corporate bankruptcies on the rise, one would be forgiven for thinking pricing is at odds with fundamentals, especially given all the traditional leading indicators are signalling elevated recession risk. Despite all these credit headwinds, perhaps the main reason why high yield credit has been so well-behaved is that we’re still some way off from the next refinancing cliff.
There are a few reasons for this. The obvious one is that corporates – both high and low quality – were allowed to term out their debt in the aftermath of COVID, aided by highly accommodative policy and explicit credit market support from the Fed. The second reason is a bit more technical. Typically, junk bonds are issued with first call dates a couple of years prior to maturity and ordinarily, assuming benign conditions and an upward sloping (i.e., “normal”) yield curve, bond maths tells us that a junk bond will most likely roll up (in price) to par well before maturity. This not only allows the issuer to exercise the call, redeeming the bond well before the maturity date, but also most likely brings forward the refinancing. The issue now is that since yields have surged so much, especially at the front end, a large part of the high yield universe is trading at a discount to par, making an early call (before maturity) less likely, pushing back the refinancing requirement to the actual maturity date. Based on the current debt distribution profile of the junk bond universe, and assuming junk bonds aren’t called prior to maturity, we won’t see a major high yield refinancing wave until 2025.
Although the Fed may have undertaken a very aggressive hiking cycle, it’s not until we get a critical mass of refinancing of existing debt across the private sector that we get the true “tightening” in financial conditions. Because the lags may indeed be longer and more variable than much of the discretionary community anticipates, and with positioning still bearish towards risk assets, the “pain trade” is likely higher yields and higher equity prices, at least until we see sufficient capitulation from the consensus or the Fed unilaterally attempts to re-engineer a fresh tightening impulse later this month.
Chart 1: US non-farm payrolls (columns, white) vs median economist estimates (line, blue);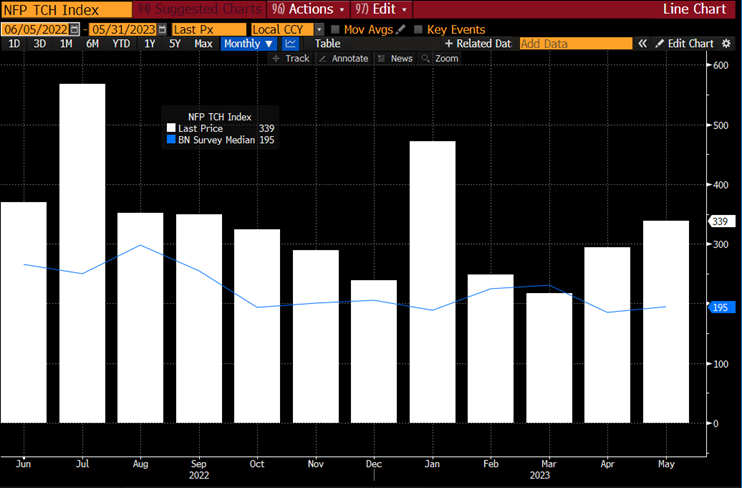
Source: Bloomberg
Chart 2: US terminal rate pricing based on Fed Funds futures strip;
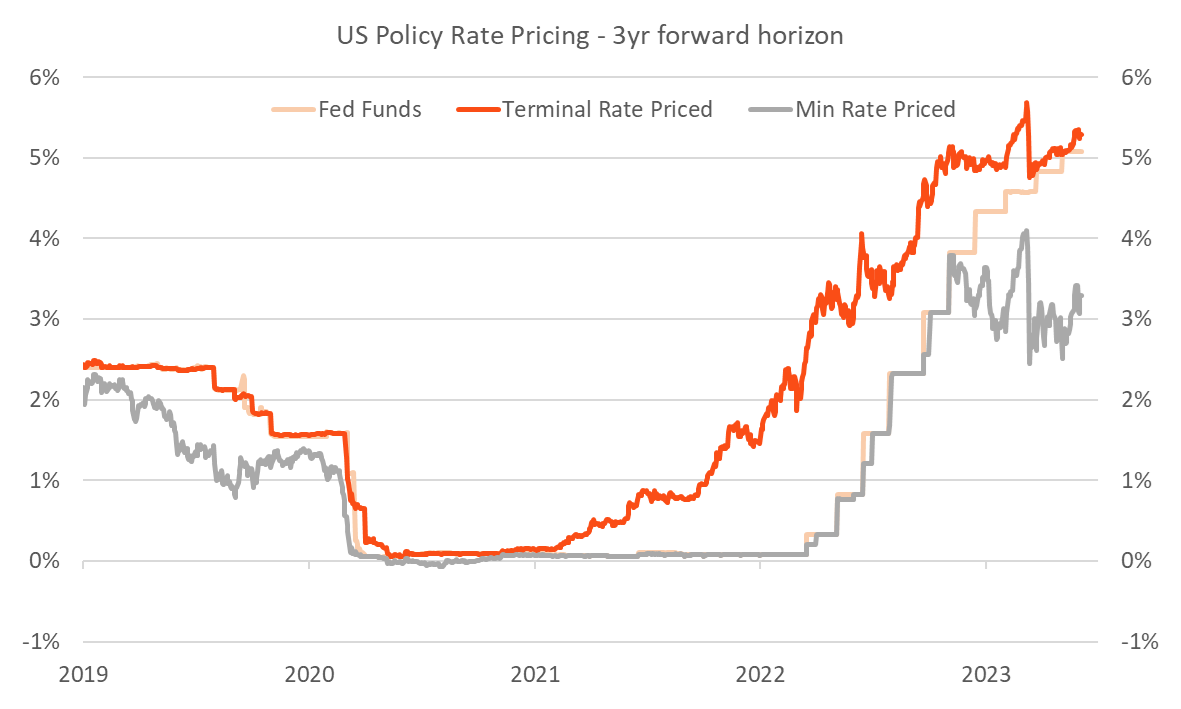
Sources: Betashares, Bloomberg
Chart 3: Real yields;
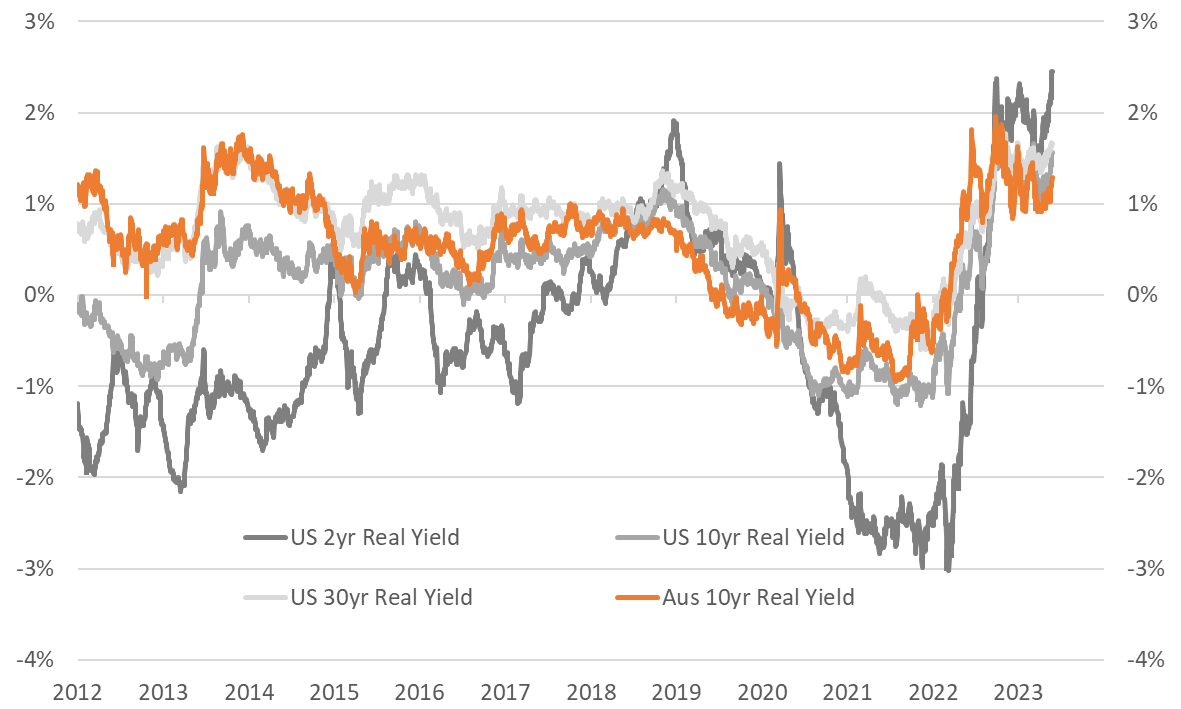
Sources: Betashares, Bloomberg
Chart 4: Citi economic surprise indices;
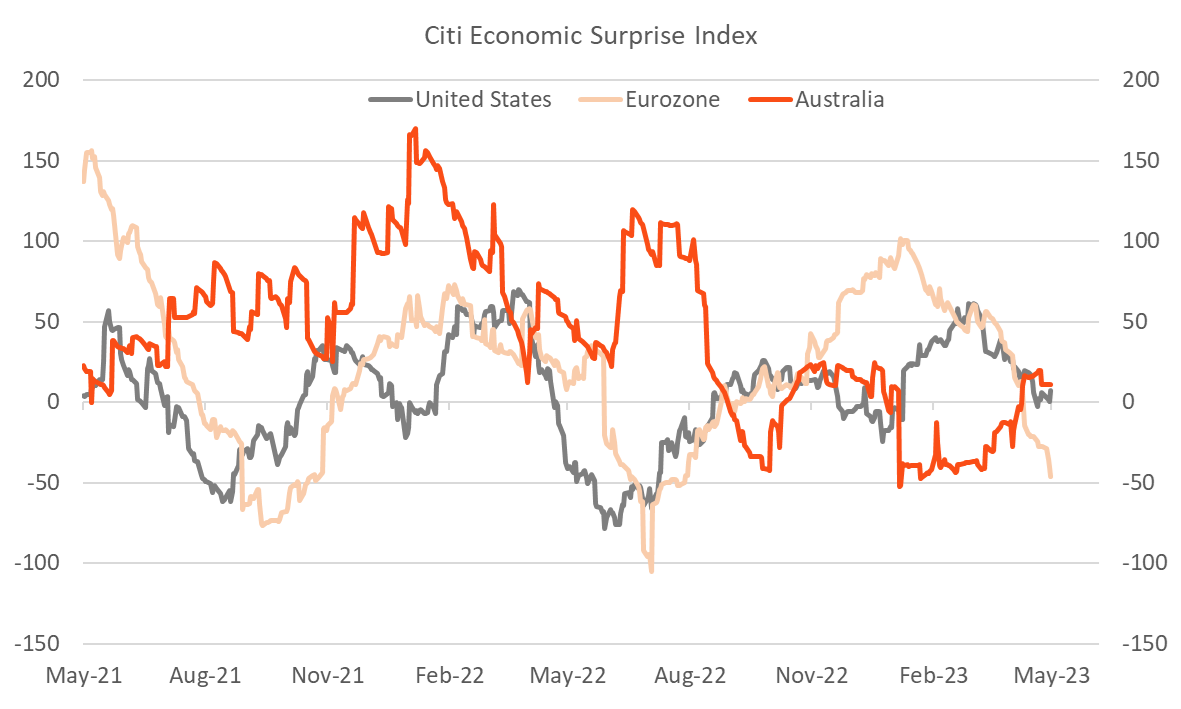
Source: Bloomberg</h3small
Chart 5: 5y5y forward inflation swaps;
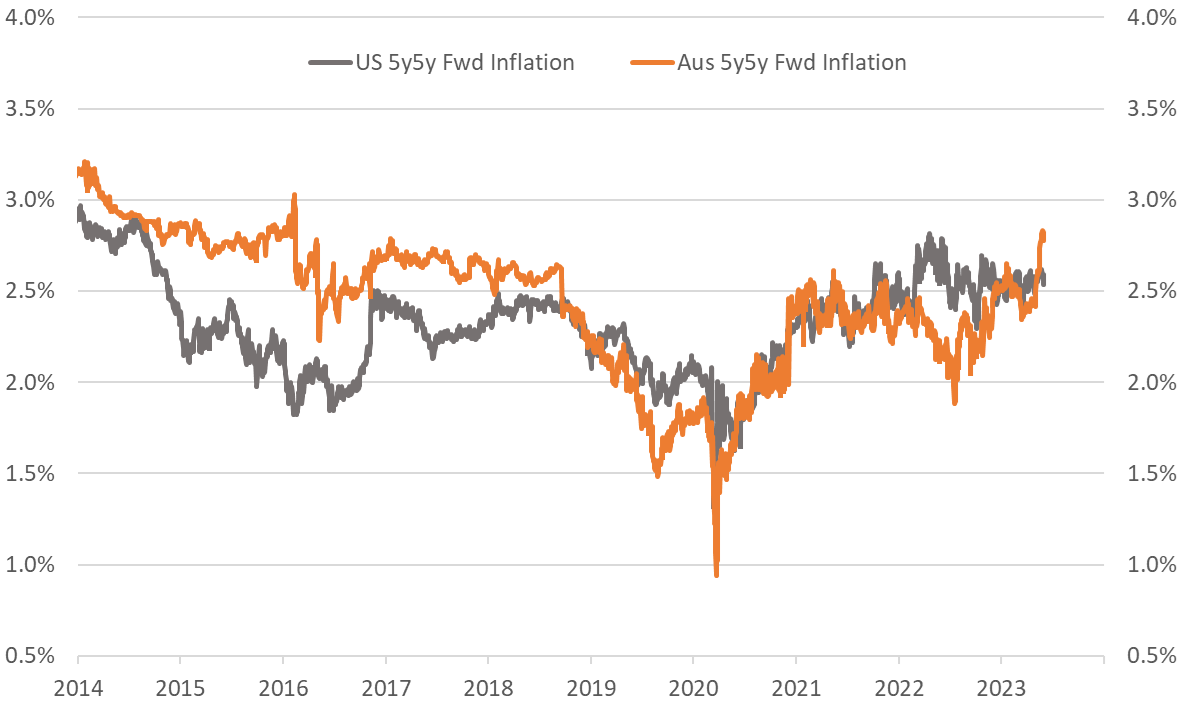
Source: Bloomberg
Chart 6: Quarterly change in G4 central bank balance sheets, as at 31-March-2023;
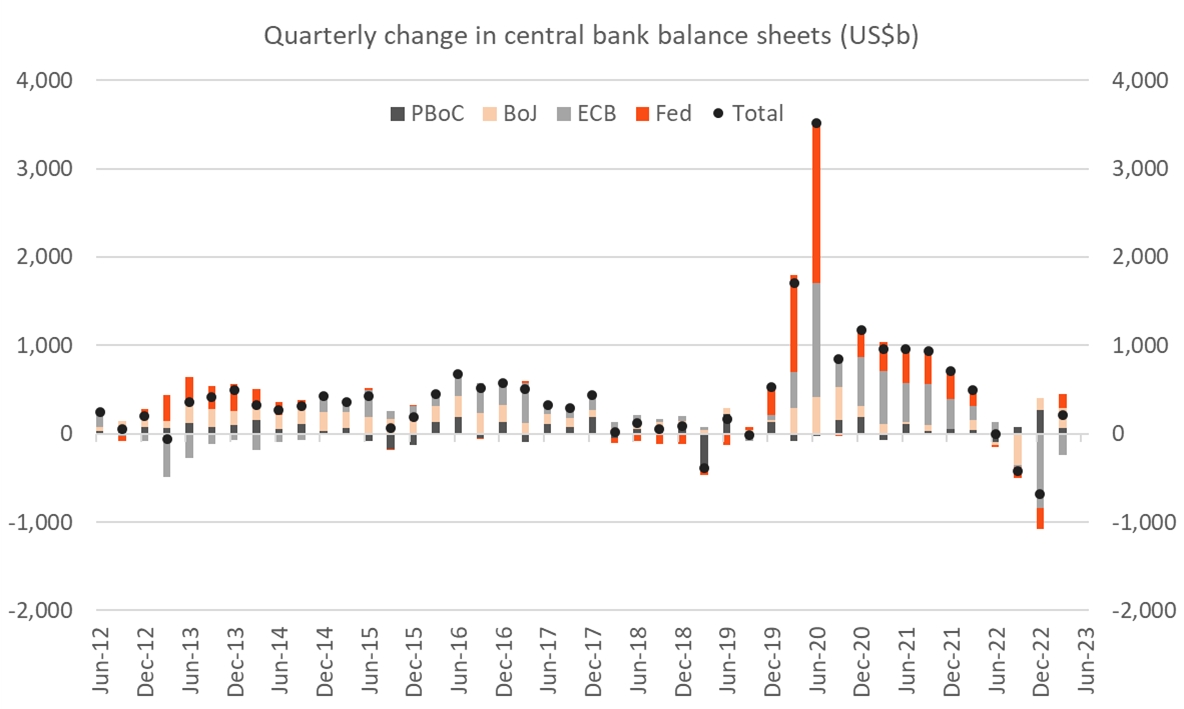
Sources: Betashares, Bloomberg
Chart 7: Selected components of the Fed’s balance sheet (liability-side), in US$m;
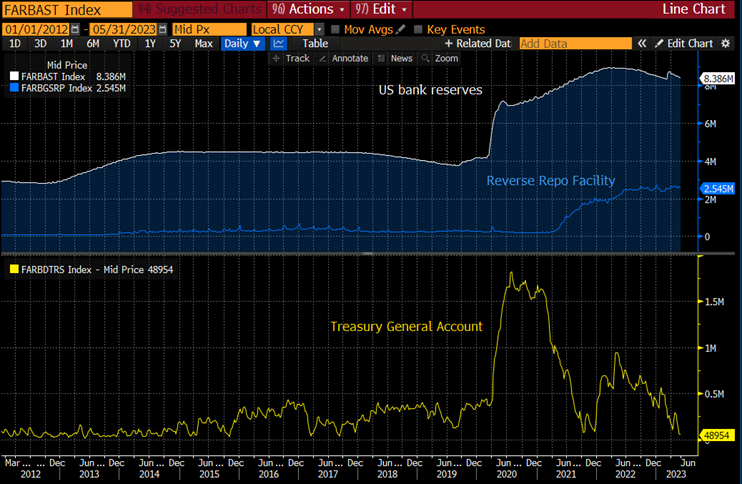
Source: Bloomberg
Chart 8: Credit spreads;
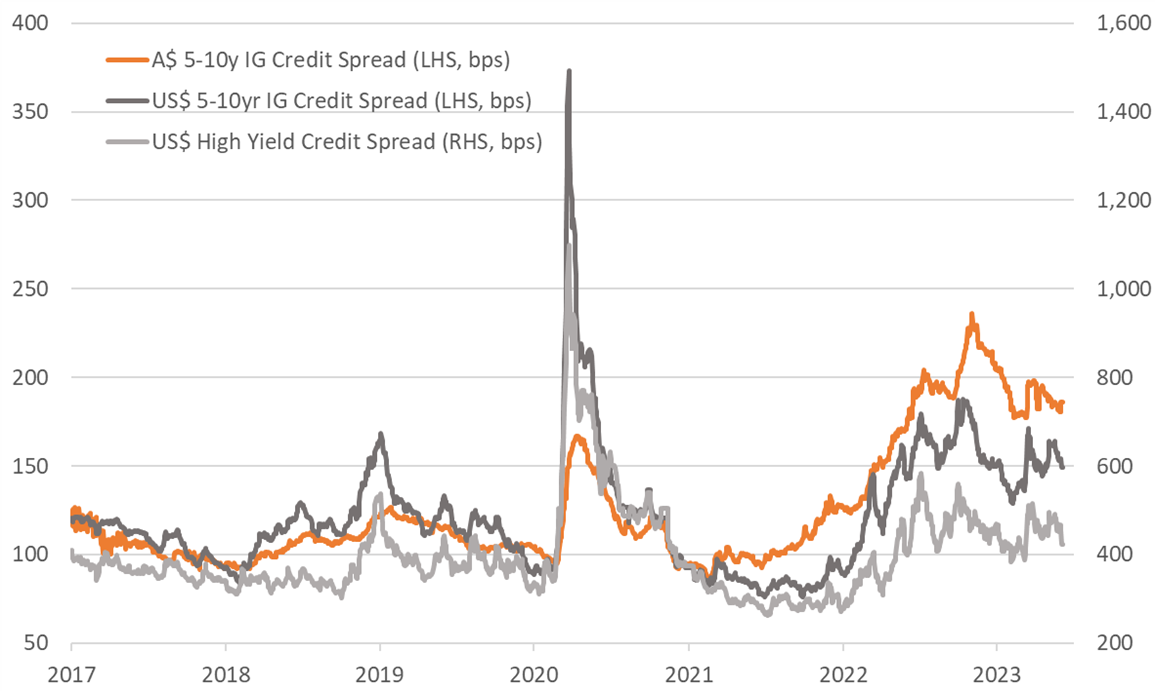
Source: Bloomberg
Chart 9: US high yield maturity distribution;
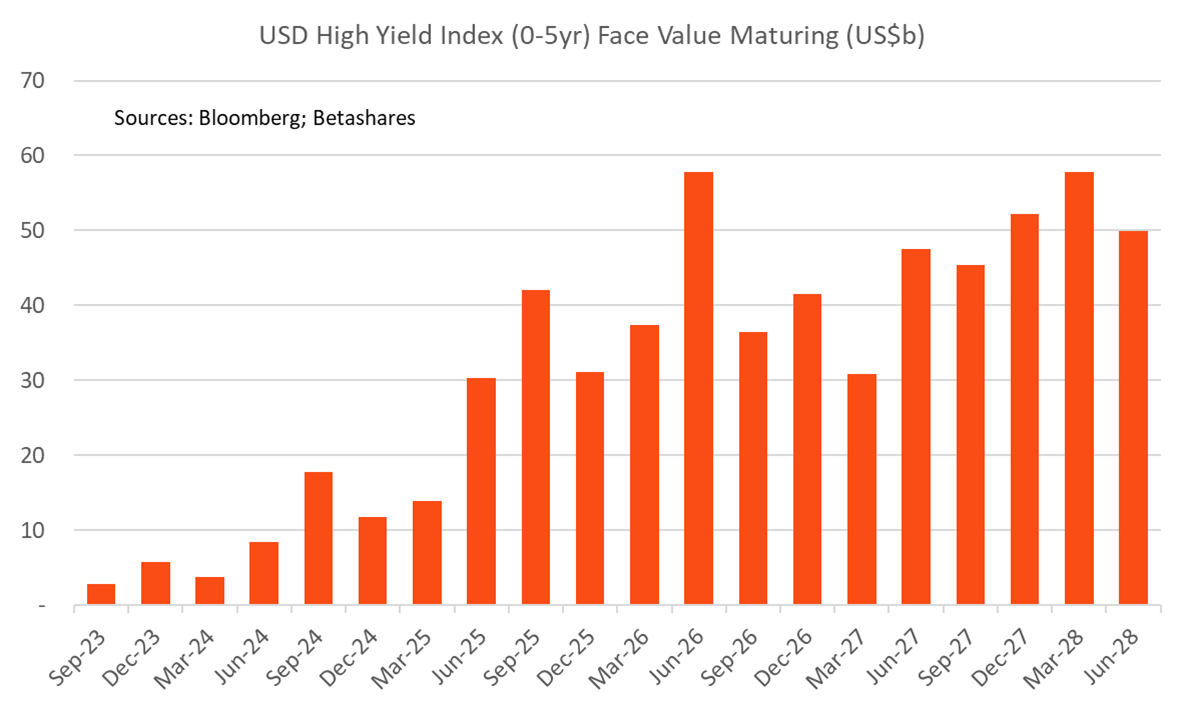
Sources: Betashares; Bloomberg
Important:This information is for wholesale client use only. It is not intended for retail clients.
Betashares Capital Ltd (ACN 139 566 868 AFS Licence 341181) (“Betashares”) is the issuer.
This is general information only and does not take into account any person’s particular circumstances. It is not a recommendation to make any investment or adopt any particular investment strategy. You should make your own assessment of the suitability of this information.
Future outcomes are inherently uncertain. Actual outcomes may differ materially, positively or negatively, from those contemplated in any views, opinions, estimates, projections or other forward-looking statements given in this document. Readers must not place undue reliance on such statements. Betashares does not undertake any obligation to update forward looking statements to reflect events or circumstances after the date such statements are made or to reflect the occurrence of unanticipated events.
The author’s views do not necessarily reflect those of Betashares and are subject to change without notice.
Any past performance information shown is not indicative of future results.
To the extent permitted by law Betashares accepts no liability for any loss from reliance on this information.
1 comment on this
As the June FOMC approaches and Fed officials enter a blackout period, the global macro backdrop has seen intriguing shifts. Despite receding US inflation fears and leading indicators suggesting an elevated recession risk, market price action across asset classes appears somewhat surprising. How is the market currently positioned regarding expectations of a US recession, and what factors contribute to the perception that it might be priced for a soft landing? How have bond yields responded, especially with the recalibration of terminal rate pricing and the resilience of hard data, particularly in the labor market, along with the recent surpassing of expectations in US non-farm payrolls?
Visit us telkom university