
Cameron Gleeson
9 minutes reading time
This information is for the use of financial advisers and other wholesale clients only. It must not be distributed to retail clients.
Following Liberation Day, the Nasdaq 100 led an exceptional global recovery. Yet over the full 2025 calendar year, European, Japanese and emerging market indices all outperformed the S&P 500 and Nasdaq 100 in both local and common currency terms.
So far, 2026 looks to be a supportive environment for global equities, with robust global growth and an easing bias expected under new Fed chair Kevin Warsh. The key questions for investors are how much optimism is already in the price and whether ex-US global equities will outperform US equities, as they did in 2025.
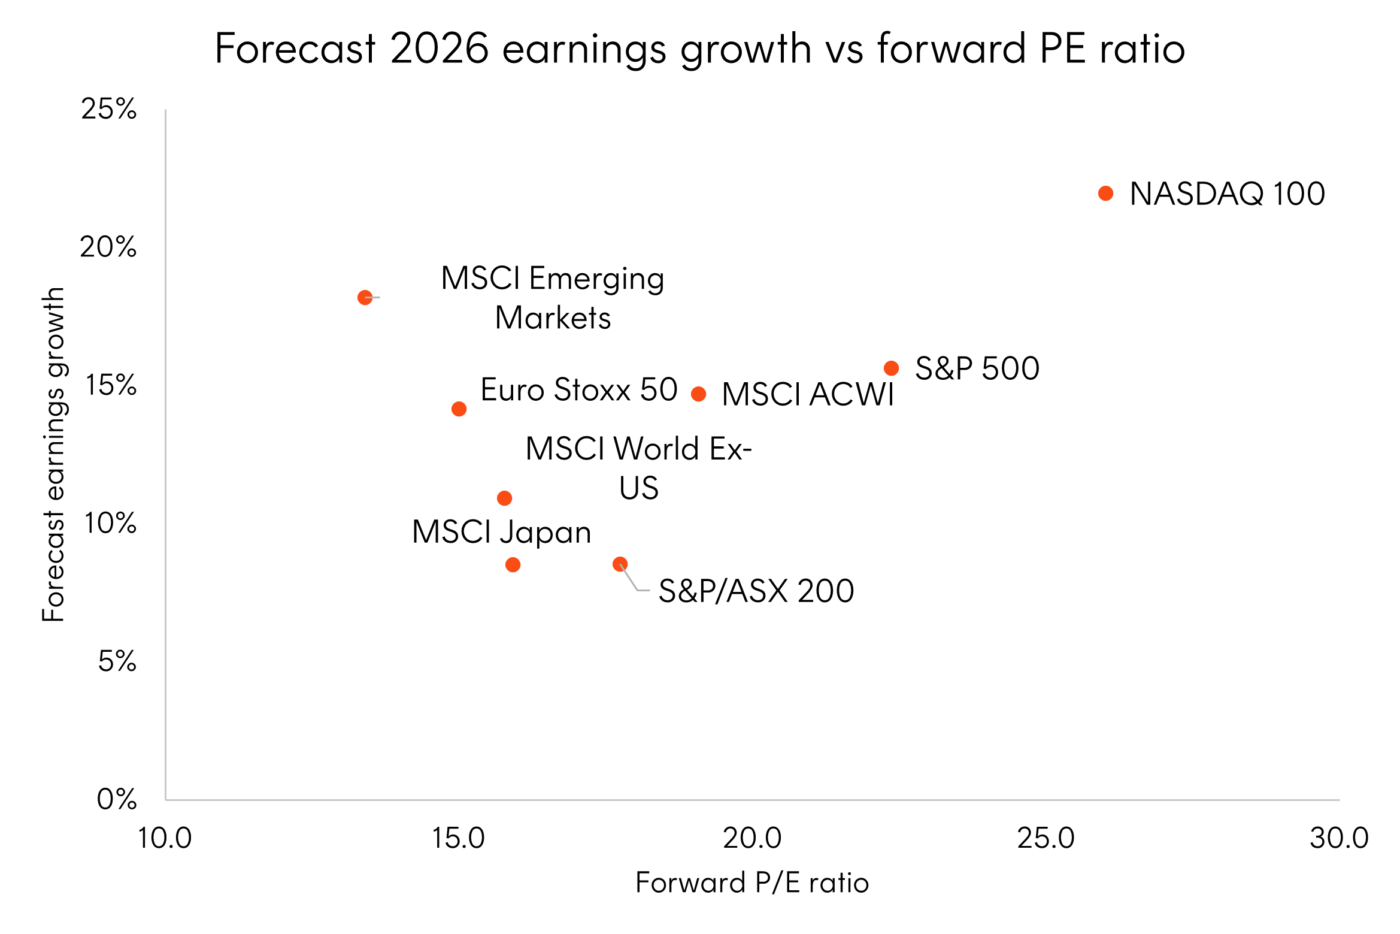
Source: FactSet, forecast 2026 earnings growth based on analyst consensus. As at 13 January 2026. Actual outcomes may vary.
US equities: Earnings tailwind, currency headwind
For the US, we forecast returns for the S&P 500 and Nasdaq 100 to be driven by strong earnings growth with valuation multiples unchanged, supported by easing monetary policy. However, for Australians investing in the US on an unhedged basis, returns in Australian dollar terms could be partly eroded due to a weakening US dollar.
We expect the AI capex cycle to persist in 2026, backed by evidence of productivity gains, accelerating hyperscaler cloud revenue, and ample balance sheet capacity. Large cap tech profitability should remain the key driver of index level earnings growth. In our view, AI does not seem to be in bubble territory, noting that the most levered companies, like Oracle, already suffered historic drawdowns in late 2025. We do not anticipate that there will be a major sell off among the megacap AI players while they are consistently delivering ~20% annual earnings growth. The higher share of foreign revenue of these tech companies should also provide an earnings tailwind if the US dollar falls.
Though we do not expect 2026 to be a “Sell America” moment, investors have been looking for new leadership beyond the Magnificent 7, and they are increasing looking at global markets beyond the US.
Ex-US equities closing the valuation gap
Since the GFC, the rest of the world has generally underperformed US equities due to both weaker earnings growth and less multiple expansion. Ex-US developed markets (Europe and Japan) were trading at a 30% PE valuation discount to the US as at 31 December 2025, which is a 10% improvement after outperformance in 2025.
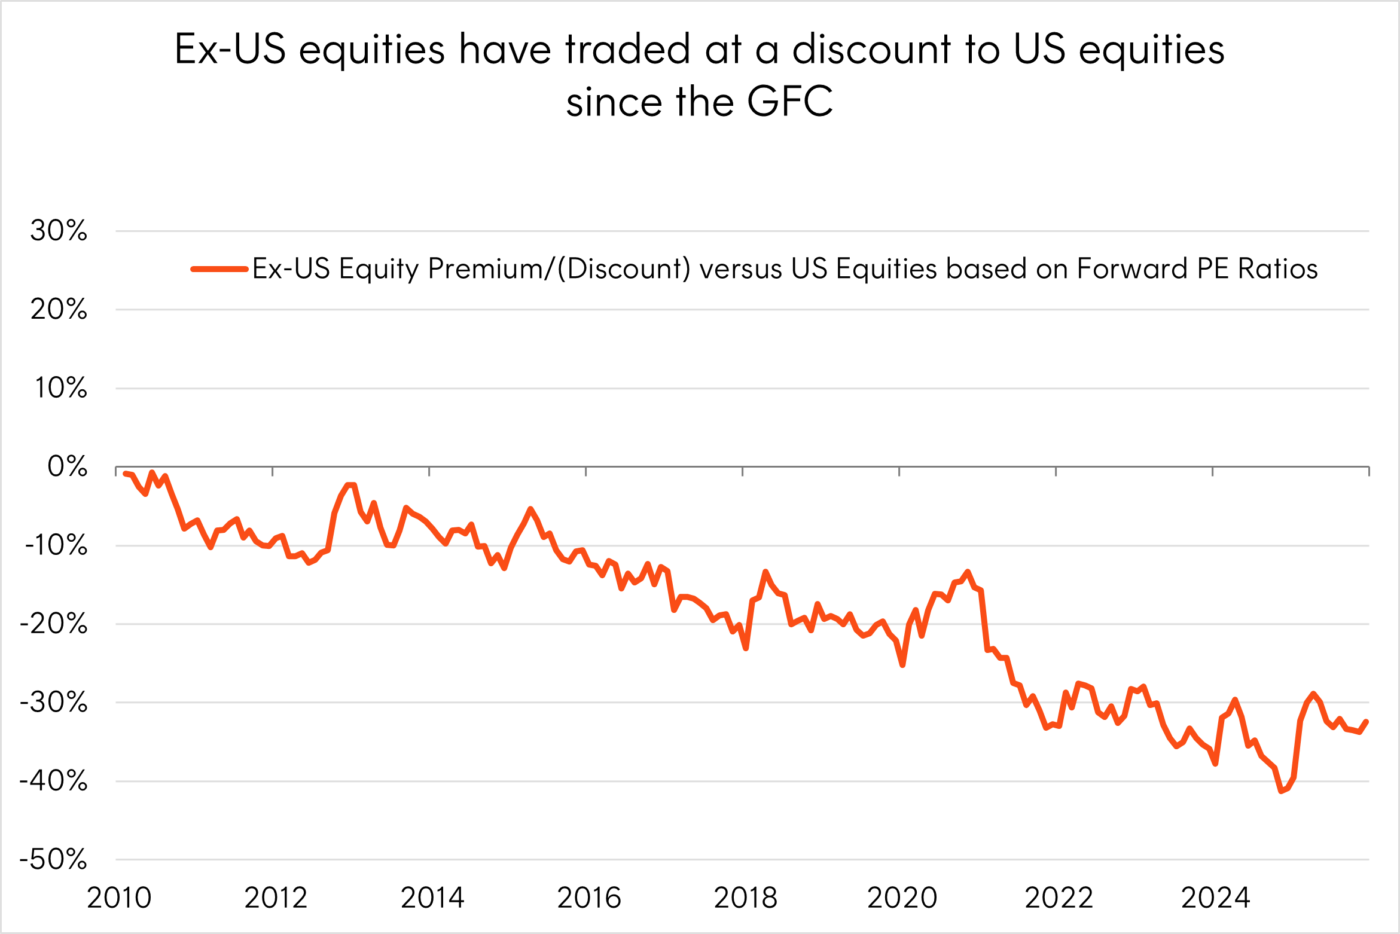
Source: Bloomberg. 1 January 2010 to 31 December 2025. Past performance not indicative of future performance.
Some of the US equity premium is justified by the higher profitability and greater earnings stability of the companies that dominate the US equity market. The question for 2026 is whether this premium should be more or less than 30%.
Europe and Japan’s longer term consensus earnings growth looks more modest than the US, and these regions remain more exposed to global sentiment. However, several factors could support outperformance. A ramp up of European fiscal stimulus should start to take effect in 2026, increasing the probability of earnings upgrades. Meanwhile, as discussed earlier, Japanese growth has upside under Takaichi’s leadership. These catalysts, together with our expectation that the US dollar will continue to weaken, lead us to believe that ex-US developed markets has the capacity to outperform US equities in 2026 in Australian dollar terms (on an unhedged basis).
We are currently expecting 2026 to be another good year for emerging markets equities. The MSCI Emerging Market index has recently been offering similar earnings growth to the Nasdaq 100 at half the cost – in terms of PE multiples1. Indeed, emerging markets can offer a cheaper way to play the AI trade. For example, TSMC and Korea’s SK Hynix and Samsung are important suppliers for the US data centre build-out, and Ali Baba has re-emerged as a Chinese AI champion capable of challenging the US AI leaders.
Outside of AI, India’s economy could be set to rebound with structural reforms, improving infrastructure, tax cuts and lower interest rates, enhancing productivity and corporate earnings. Finally, a weaker US dollar and easing Fed are tailwinds for emerging markets countries, lowering US dollar denominated debt servicing costs, encouraging foreign capital inflows, and allowing for easier monetary policy.
Investment implications
We are currently expecting a weaker US dollar to lead to stronger investment returns in non-US developed markets and emerging market equities in AU dollar terms. In fact, notable rotation may already be underway. Since 10 December, the S&P 500 has been marginally down, while the MSCI World Ex-US and MSCI Emerging Markets have outperformed it by more than 10% to 16 February 2026.2
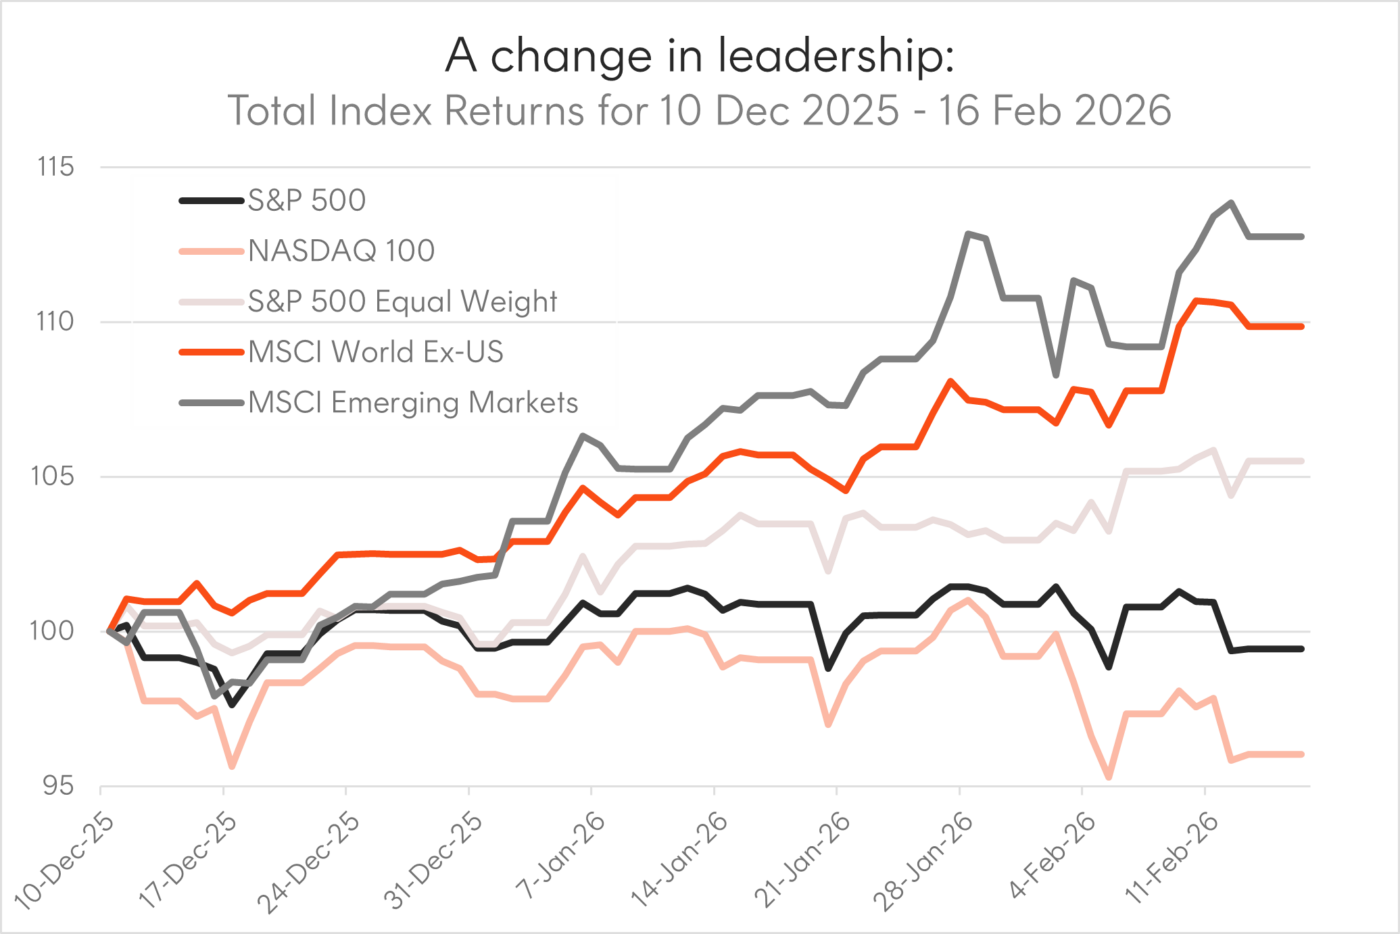
Source: Bloomberg, 10 December 2025 to 16 February 2026. You cannot invest in an index. Past performance is not an indicator of future performance.
Ex-US developed markets in Europe and Japan could benefit from an increase in fiscal stimulus, structural reform and reducing trade uncertainty in 2026. Europe’s increasing defence and infrastructure spending and the Takaichi Government’s strategic support for critical industries including AI, semiconductors, biotechnology and batteries, may provide the catalyst for earnings upgrades. These potential upgrades, undemanding valuations, and our expectation of US dollar weakness, suggests that ex-US developed markets has the potential to outperform US equities in 2026 in Australian dollar terms (on an unhedged basis).
-
EXUS
Global Shares Ex US ETF
- EXUS offers low-cost global diversification beyond the US, providing exposure to 900+ companies from 22 developed markets, excluding the US and Australia.
- EXUS was built specifically for Australian investors, providing them access to any available foreign tax credits from dividends received, which may improve after-tax returns compared to investing in a non-Australian domiciled ETF.
Global investors have generally been underweight emerging markets over the past few years, but sentiment and flows appear to be at a turning point. We expect 2026 to be another good year for emerging markets equity returns, as valuations remain compelling and earnings growth strong. Indeed, emerging markets companies like TSMC, SK Hynix, Samsung and Ali Baba could offer a cheaper way to play the AI trade. Beyond AI, India’s economy appears set to rebound and a weakening US dollar could be a tailwind for emerging market countries more broadly.
-
BEMG
MSCI Emerging Markets Complex ETF
- BEMG is the lowest cost core market capitalisation-weighted emerging market ETF available on the ASX.
- BEMG holds units in a UCITS fund that uses a swap-based structure. This allows BEMG to more efficiently track the MSCI Emerging Markets Index and avoids the costs and performance impacts associated with trading in some emerging market countries.
Currency may be a headwind for unhedged Australian investors in US markets, making diversification across regions and currencies a prudent strategy. Nevertheless, the macro and earnings backdrop still justify allocation to select US equities. Earnings growth has been the dominant contributor to the Nasdaq 100’s exceptional performance over the last five years, not valuation expansion. And the Nasdaq 100’s expected earnings growth for 2026 is again more than 20%.
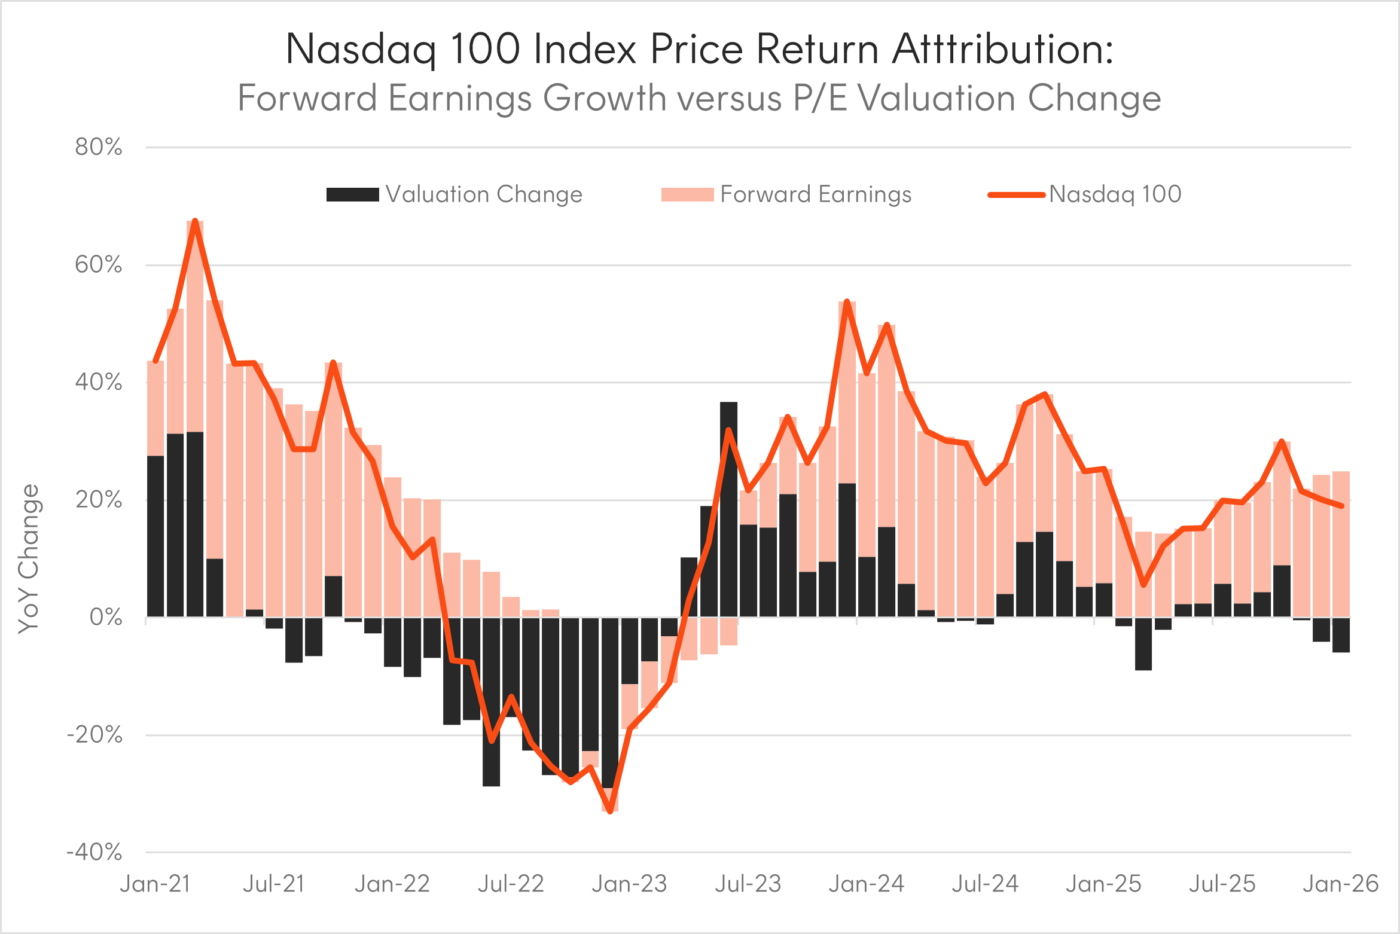
Source: Bloomberg. 31 January 2021 to 31 January 2026. The chart shows the rolling year-on-year change in the Nasdaq 100 index’s price, forward Price-to-Earnings and forward earnings. Past performance is not an indicator of future performance.
Leadership in US tech is constantly shifting, with investors having increasingly shown preference for Alphabet over Microsoft over the last twelve months. But the Magnificent 7, more broadly, are no longer driving the Nasdaq 100. Currently, the division is between Software, which has sold off on the fears of AI business model disruption, and Hardware and Semiconductors, that have been upgraded on evidence of an AI productivity dividend. The Nasdaq 100 has always provided diversified exposure to the innovation and creative destruction of technology companies, and currently has an 18% allocation to Software & Services Industry Group and a collective 36% allocation to the Hardware and Semiconductor Industry Groups.3 In fact some of the largest contributors to the Nasdaq’s performance over the last 6 months have been “non-Magnificent” semi-conductor stocks like Micron Technologies, Lam Research and Applied Materials4.
-
NDQ
Nasdaq 100 ETF
- NDQ provides Australian investors with access to the Nasdaq 100 Index. NDQ has been one of the top performing Australian domiciled global equity funds, returning almost 20% p.a. over the last ten years5.
-
HNDQ
Nasdaq 100 Currency Hedged ETF
- Given the potential for US dollar weakness in 2026 to impact returns, investors could consider HNDQ in order to participate in the Nasdaq 100’s potential earnings growth whilst seeking to minimise currency risk.
Alternatively, for investors who believe cyclical sectors within US equities will outperform the Nasdaq 100, HQUS S&P 500 Equal Weight Currency Hedged ETF provides an equally weighted allocation to the top 500 US stocks on a currency hedged basis, reducing the risk of being heavily exposed to a small number of ‘mega cap’ companies.
Sources:1. Bloomberg. As at 31 December 2025. Actual results may differ materially from forecasts. ↑2. In common currency terms. ↑3. As at 16 February 2026. Refers to the Nasdaq 100’s allocation to companies within the S&P 500 Software & Services Industry Group, the S&P 500 Technology Hardware & Equipment Industry Group and the S&P500 Semiconductors & Semiconductor Equipment Industry Group GICS Level 2 indices. ↑4. No assurance is given that any of the companies in a Fund’s portfolio will remain in the portfolio or will be profitable investments. ↑5. As at 31 December 2025. Past performance is not an indicator of future performance. ↑