
Hans Lee
6 minutes reading time
Just months after celebrating its 10th birthday, the NDQ Nasdaq 100 ETF has passed yet another milestone, reaching $7 billion in assets under management (AUM) for the first time.1
In the last decade, NDQ has cemented itself as a major player in the Australian investing landscape. It has one of the highest 10-year returns of any ETF in Australia to 29 August 2025, returning 19.87% p.a. This is a standout result, especially for an index tracking, broad market exposure.
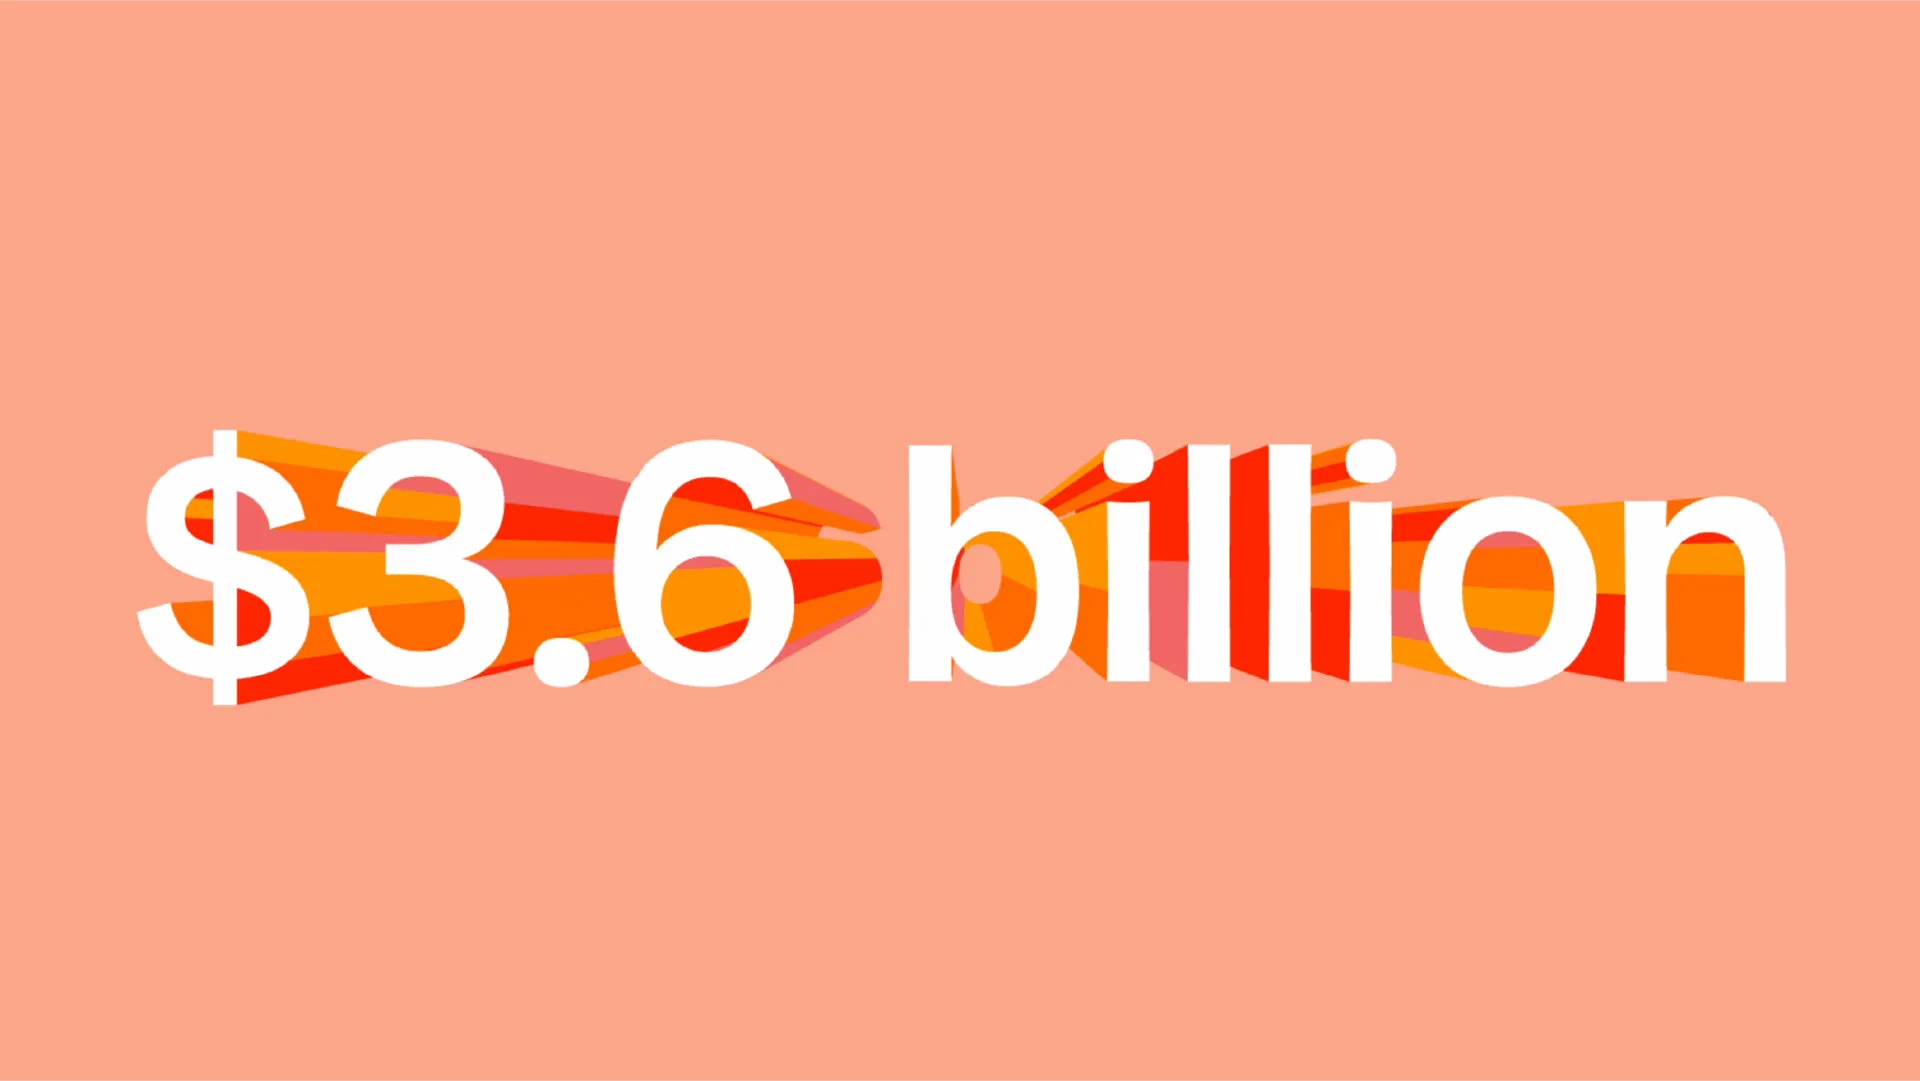
What’s also significant is just how much wealth the fund has created. Australians have entrusted some $3.85 billion of their savings to be invested in NDQ since its inception, and with that NDQ has generated over $3.67 billion in returns2. The majority of that, well over $3 billion, has come in the form of capital gains, with another $430 million approximately paid out as distributions (as at 23 September 2025).
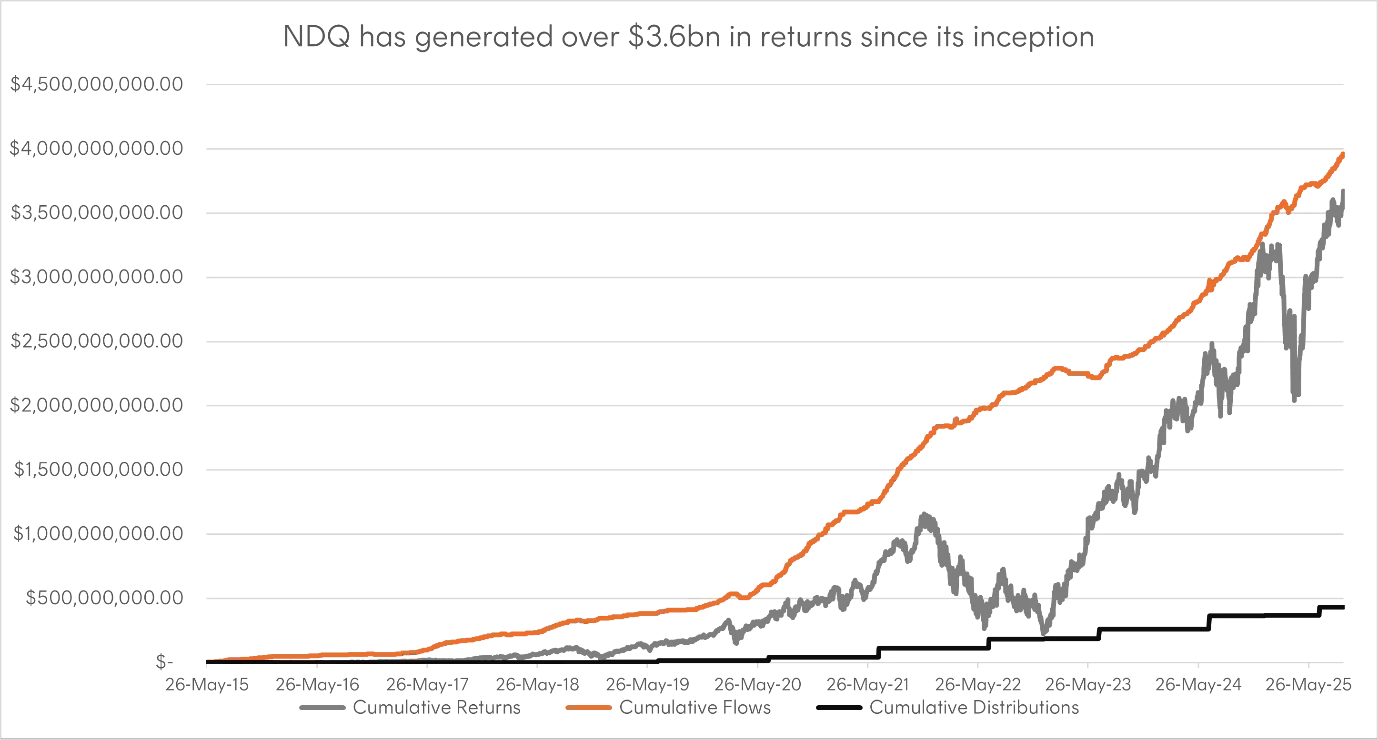
Source: Betashares. As at 18 September 2025. Past performance is not an indicator of future performance. Returns are calculated in Australian dollars using net asset value per unit at the start and end of the specified period and do not reflect brokerage or the bid ask spread that investors incur when buying and selling units on the ASX. Returns are after fund management costs, assume reinvestment of any distributions and do not take into account tax paid as an investor in the Fund. Returns for periods longer than one year are annualised. Current performance may be higher or lower than the performance shown.
This performance has been possible because the Nasdaq 100 Index, which NDQ aims to track, contains many of the companies which have been the major forces in driving global growth and innovation over the last decade.
All of the current top 10 stocks have been held continuously in NDQ since its inception, however the makeup of the top 10 has changed considerably. Some, like Apple and Microsoft, were already cemented as core drivers of global growth a decade ago, while others, like Nvidia and Broadcom, have grown into household names driving the AI revolution today.
|
Company |
Current |
NDQ Inception (26/5/15) |
||
|
Rank |
Weight |
Rank |
Weight |
|
|
Nvidia |
1 |
9.42% |
89 |
0.23% |
|
Microsoft |
2 |
8.28% |
2 |
7.40% |
|
Apple |
3 |
7.79% |
1 |
14.60% |
|
Alphabet (comb.) |
4 |
6.23% |
3 |
6.51% |
|
Amazon |
5 |
5.38% |
4 |
3.84% |
|
Broadcom |
6 |
5.23% |
34 |
0.73% |
|
Meta Platforms |
7 |
3.71% |
5 |
3.41% |
|
Tesla |
8 |
3.32% |
36 |
0.61% |
|
Netflix |
9 |
2.77% |
31 |
0.73% |
|
Costco |
10 |
2.28% |
20 |
1.21% |
Source: Bloomberg. As at 18 September 2025.
Earnings are broadening
Perhaps most notably, Nasdaq 100 companies continue to deliver strong earnings despite continued policy uncertainty and geopolitical tensions. 77.8% of companies beat earnings expectations in the most recent quarter, including 92.5% of companies in the information technology sector3.
The standouts in the IT sector are the so-called Magnificent 7. Collectively, the Magnificent Seven have increased their earnings by US$124 billion over the past 12 months – significantly higher than the total earnings of the ASX 2004.
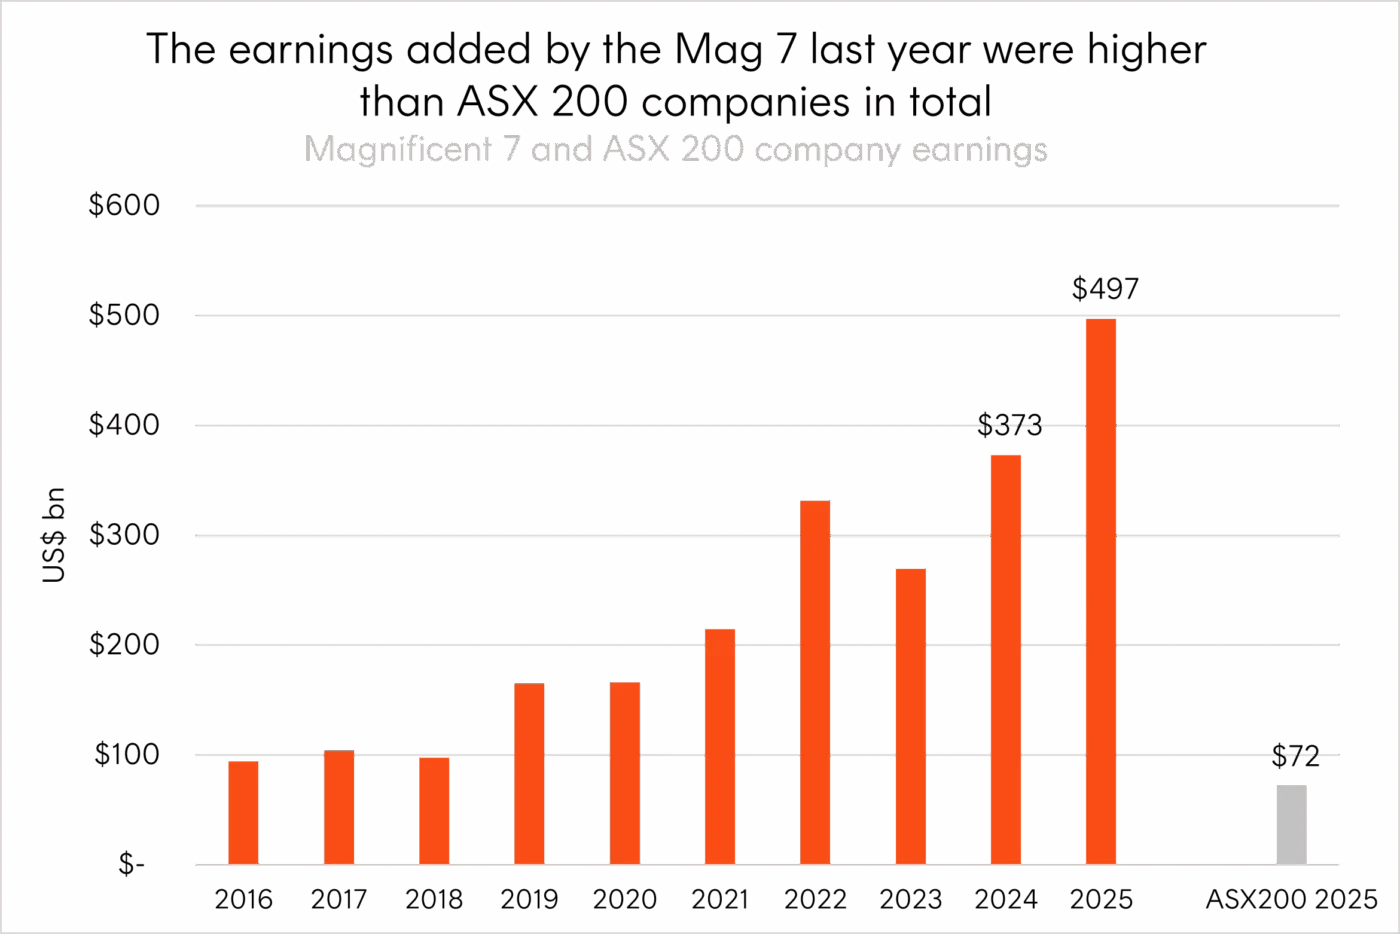
Source: Bloomberg. Most recent reported annual earnings figures as at 8 August 2025. Mag 7 represents AAPL, MSFT, NVDA, GOOGL, AMZN, META, TSLA.
But while these companies have dominated headlines, signs of broader earnings strength are emerging across the index. Companies like Palantir (NASDAQ: PLTR) and Nasdaq Inc. (NASDAQ: NDAQ) itself have posted strong revenue growth and higher profits. These results could be signalling a shift from concentration risk toward a more diversified growth profile within the Nasdaq 100.
R&D spending remains a priority
Despite their scale, Nasdaq 100 companies continue to invest aggressively in the future. Companies are allocating billions toward capital expenditure and R&D to stay ahead in key themes like AI, cloud computing and cybersecurity.
As a percentage of their sales, companies in the Nasdaq 100 have spent around 6.5x more in R&D, on average, compared to those in the S&P 5005. The top 10 constituents by R&D spend include Amazon, Alphabet, Meta, Apple and Microsoft.
Crucially, this is all happening just as the benefits of AI spending are now extending beyond mega cap tech. As compute capacity increases, other Nasdaq 100 technology companies are scaling rapidly, improving margins and capturing new profit opportunities.
Earnings expectations continue to remain strong
It’s not just the backward-looking results that continue to impress. The consensus expectation for earnings growth for the Nasdaq 100 sits at 14.79%, far outpacing the figure for US large caps ex-Magnificent 7 (6.37%) and the ASX 200 (7.66%)6.
These figures show that companies within the Nasdaq 100 aren’t just leading today. These companies are laying the groundwork for tomorrow’s growth too.
The power of innovation-led investing
NDQ’s journey to its $7 billion AUM milestone is a testament to the combination of innovation, investing and impressive returns. As its earnings base continues to broaden out and companies continue to invest in future growth areas, NDQ remains uniquely positioned to help Australian investors tap into the next wave of global growth.
To explore how NDQ could fit into your portfolio, visit the Betashares website or log in to Betashares Direct.
Disclaimer:
There are risks associated with an investment in NDQ, including market risk, country risk, currency risk and sector risk. Investment value can go up and down. An investment in the Fund should only be considered as a part of a broader portfolio, taking into account your particular circumstances, including your tolerance for risk. For more information on risks and other features of the Fund, please see the Product Disclosure Statement and Target Market Determination, both available on www.betashares.com.au.
Past performance is not indicative of future performance.
No assurance is given that any of the companies in the Fund’s portfolio will remain in the portfolio or will be profitable investments.
Sources:
1. As at 15 September 2025. ↑
2. $3.67 billion figure includes capital gains (realised and unrealised) as well as distributions. The figure is exclusive of fees and taxes. As at 22 September 2025. ↑
3. As at 25 August 2025. ↑
4. Source: Bloomberg. As at 8 August 2025. ↑
5. https://indexes.nasdaqomx.com/docs/202407%20NDX%20Research.pdf ↑
6. Source: Bloomberg. As at 18 September 2025. ↑