
Ilan Israelstam
3 minutes reading time
Reading time: 3 minutes
APRIL 2021: INDUSTRY POWERS AHEAD INTO Q2
After breaking the $100B assets under management milestone in March, the Australian ETF industry has powered ahead in April, assisted by the ‘triple threat’: 1) strong sharemarket gains 2) higher than average net flows, and 3) another large unlisted fund conversion on Chi-X. Read on for more details, including best performers, asset flow categories and more.
Australian ETP Market Cap: August 2001 – April 2021
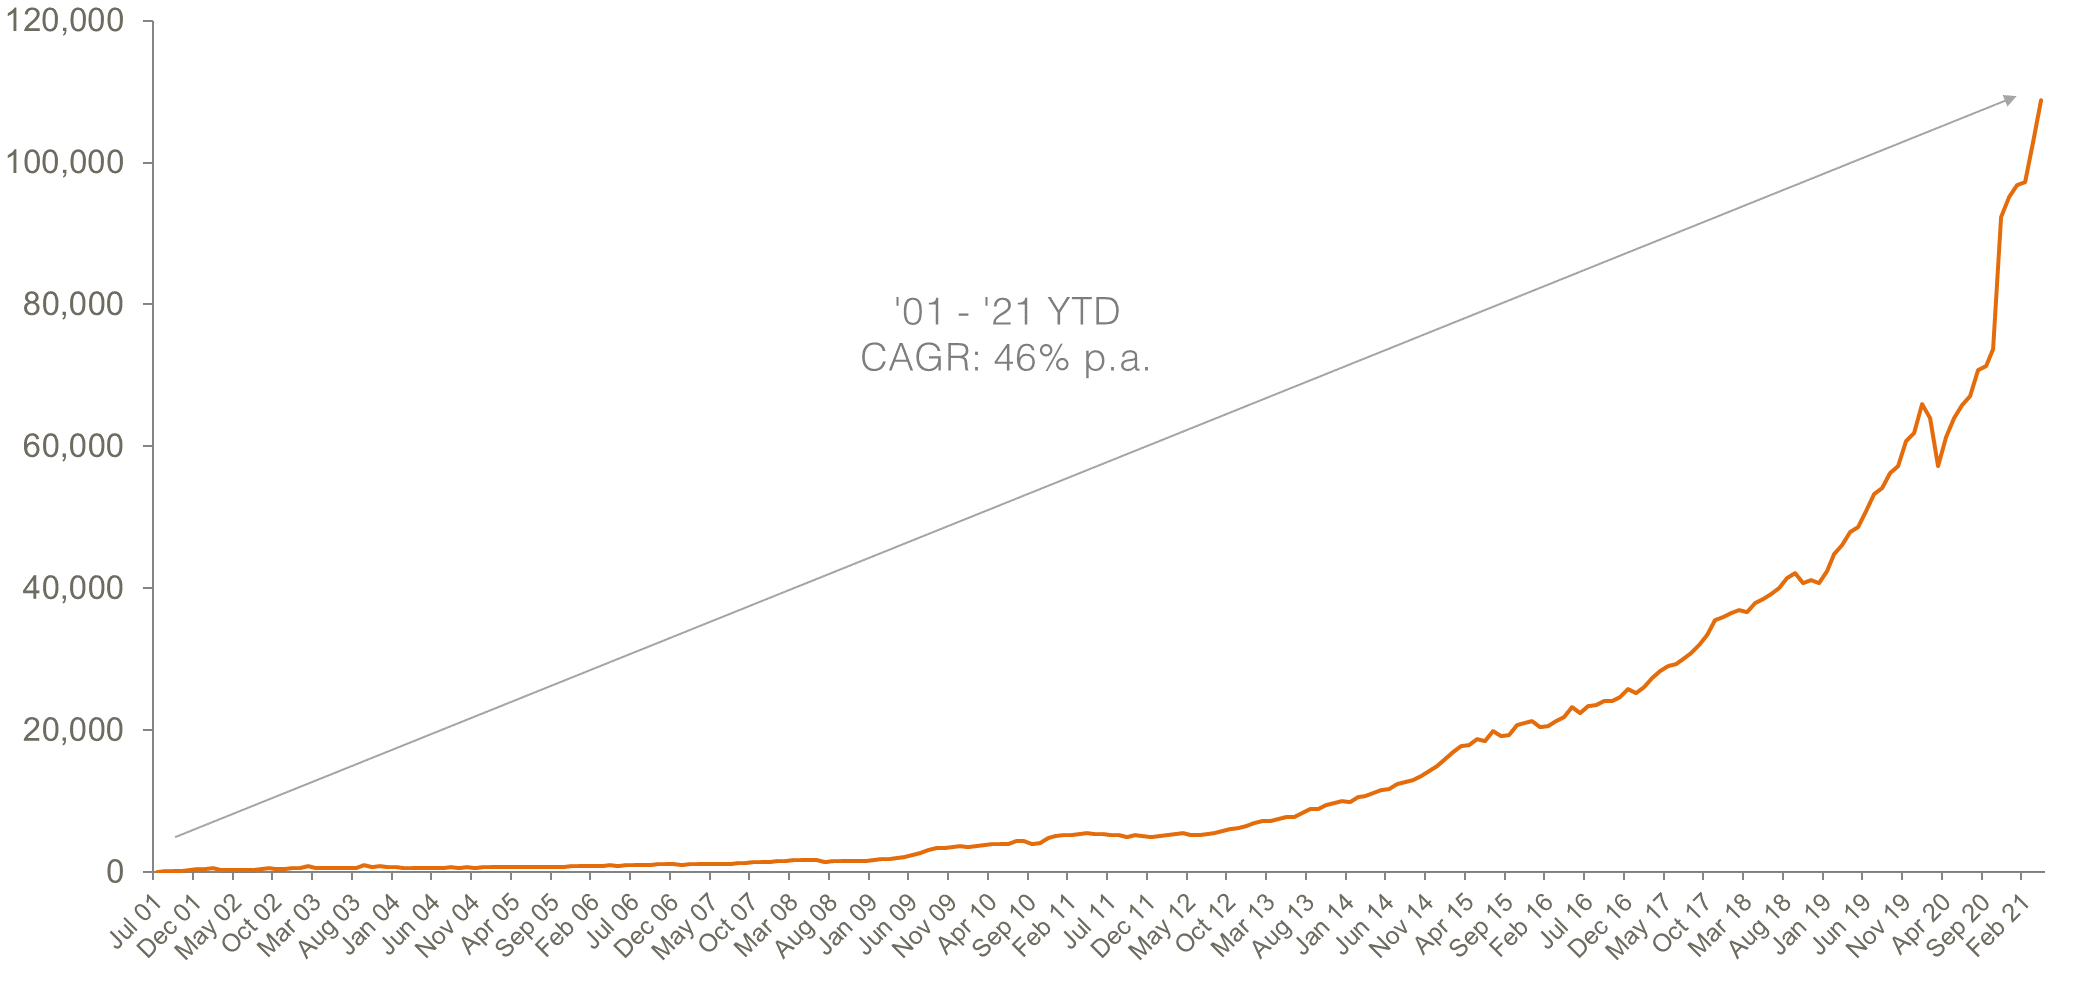
Source: ASX, Chi-X, BetaShares.
Market cap
- ASX Exchange Traded Product market cap: $108.8B1 – all time end-of-month high
- Market cap change for month: 5.8%, $5.9B
- Market cap growth for the last 12 months: 78%, + $47.5B – fastest yearly growth ($ terms) on record
Comment: The high level of flows pushed the industry to $108.8B, another record high. Industry growth over the last 12 months has been 78%, representing absolute growth of $47.5B over this period – the highest $ value increase over 12 months in the industry’s history.
1. Includes total FuM for ETFs trading on both ASX and Chi-X
New money
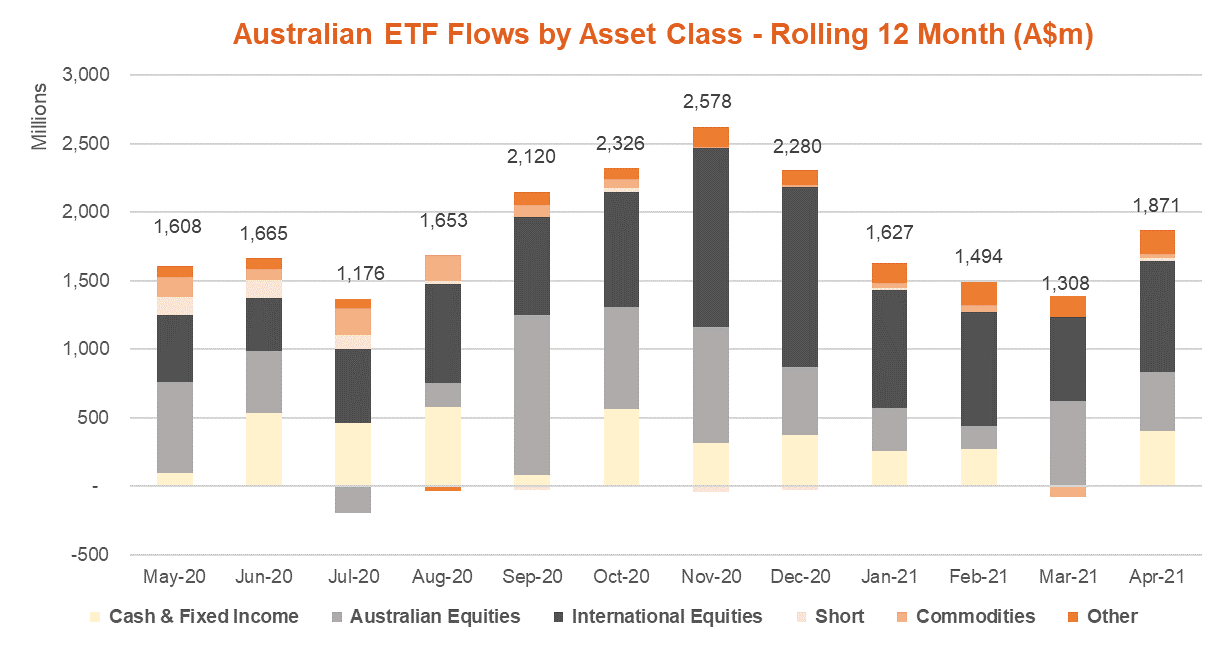
- Net new money for month (units outstanding by $ value): +$1.9B
Comment: Total industry flows remained strong, with $1.9B of net new flows entering the industry this month – the highest month yet for 2021 (note: all time largest net flows were $2.7B in December 2020). ~32% of the growth this month derived from net new money into the industry, 44% from asset value appreciation and the remaining 24% from the conversion from unlisted form of Alliance Bernstein’s Managed Volatility Fund onto Chi-X.
Products
- 267 Exchange Traded Products trading on the ASX and Chi-X.
Comment: Two new products launched, including BHYB Australian Major Bank Hybrids Index ETF and the unlisted fund conversion from Alliance Bernstein. There are now 29 issuers of either ETFs or Active ETFs in the market.
Trading value
- ASX ETF trading value down ~8% vs. the previous month.
Comment: Monthly trading value remained high, albeit declining 8% month on month, but remaining at approximately the $7B mark.
Performance
- Best performance this month came from leveraged/geared U.S. equities exposures including our GGUS Geared US Equities Currency Hedged Complex ETF (+11.5% for the month), which was also a top performer last month. We also saw strong performance from commodities including Palladium and OOO Crude Oil Index Currency Hedged Complex ETF exposures.
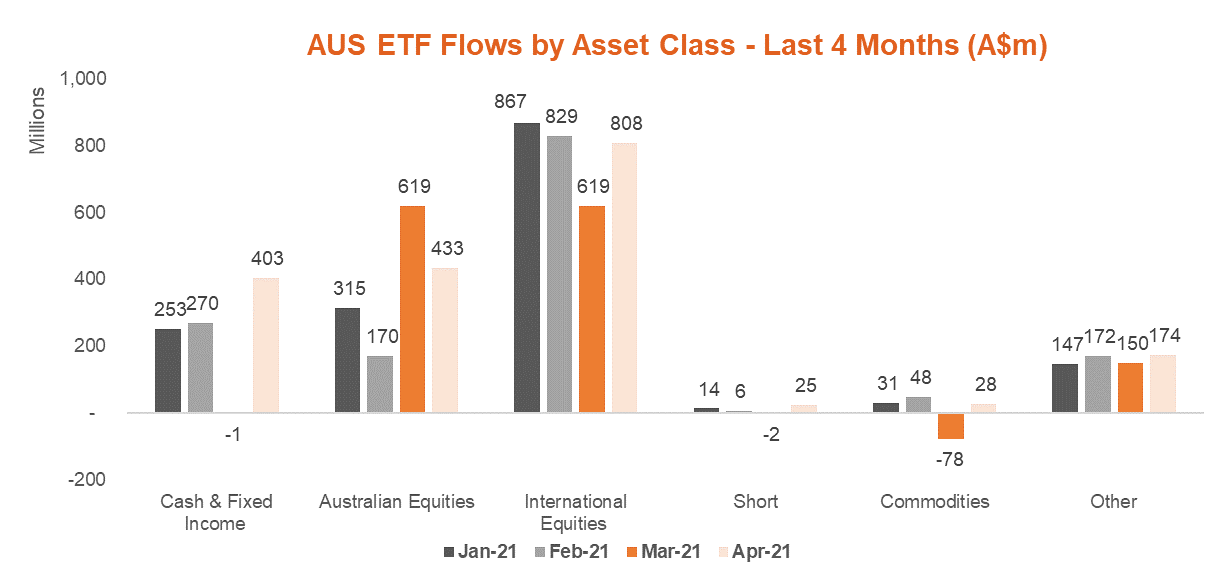
Top 5 category inflows (by $) – April 2021
| Category | Inflow Value |
| International Equities | $807,720,016 |
| Australian Equities | $433,020,315 |
| Fixed Income | $243,214,991 |
| Cash | $159,914,887 |
| Multi-Asset | $153,795,484 |
Comment: In a repeat of the pattern this year to date, global equities received the highest amount of flow. International equities received ~$800m of net flow, followed by Australian equities which received ~$430m. We also saw, for the first time this year, strong inflows into Cash exposures, which, on a relative basis, are still able to provide investors with meaningful pick-up on cash rates vs. at-call deposits.
Source: Bloomberg, BetaShares.
Source: Bloomberg, BetaShares.
Top sub-category inflows (by $) – April 2021
| Sub-Category | Inflow Value |
| Australian Equities – Broad | $388,800,656 |
| International Equities – Developed World | $348,743,519 |
| Australian Bonds | $182,736,714 |
| Cash | $159,914,887 |
| Multi-Asset | $153,795,484 |
Top sub-category outflows (by $) – April 2021
| Sub-Category | Outflow Value |
| Australian Equities – Large Cap | ($8,373,082) |
| Oil | ($4,205,278) |
| Australian Equities – Geared | ($2,087,995) |