
Ilan Israelstam
4 minutes reading time
Reading time: 3 minutes
A BIG HALF OF GROWTH AS THE INDUSTRY STEAMS PAST THE $100B MARK
In what was a milestone first half-year, we saw Australia’s ETF industry break the $100B mark in March ’21, and then steam ahead beyond that point. Read on for more details, including best performers, asset flow categories and more.
Australian ETP Market Cap: August 2001 – June 2021
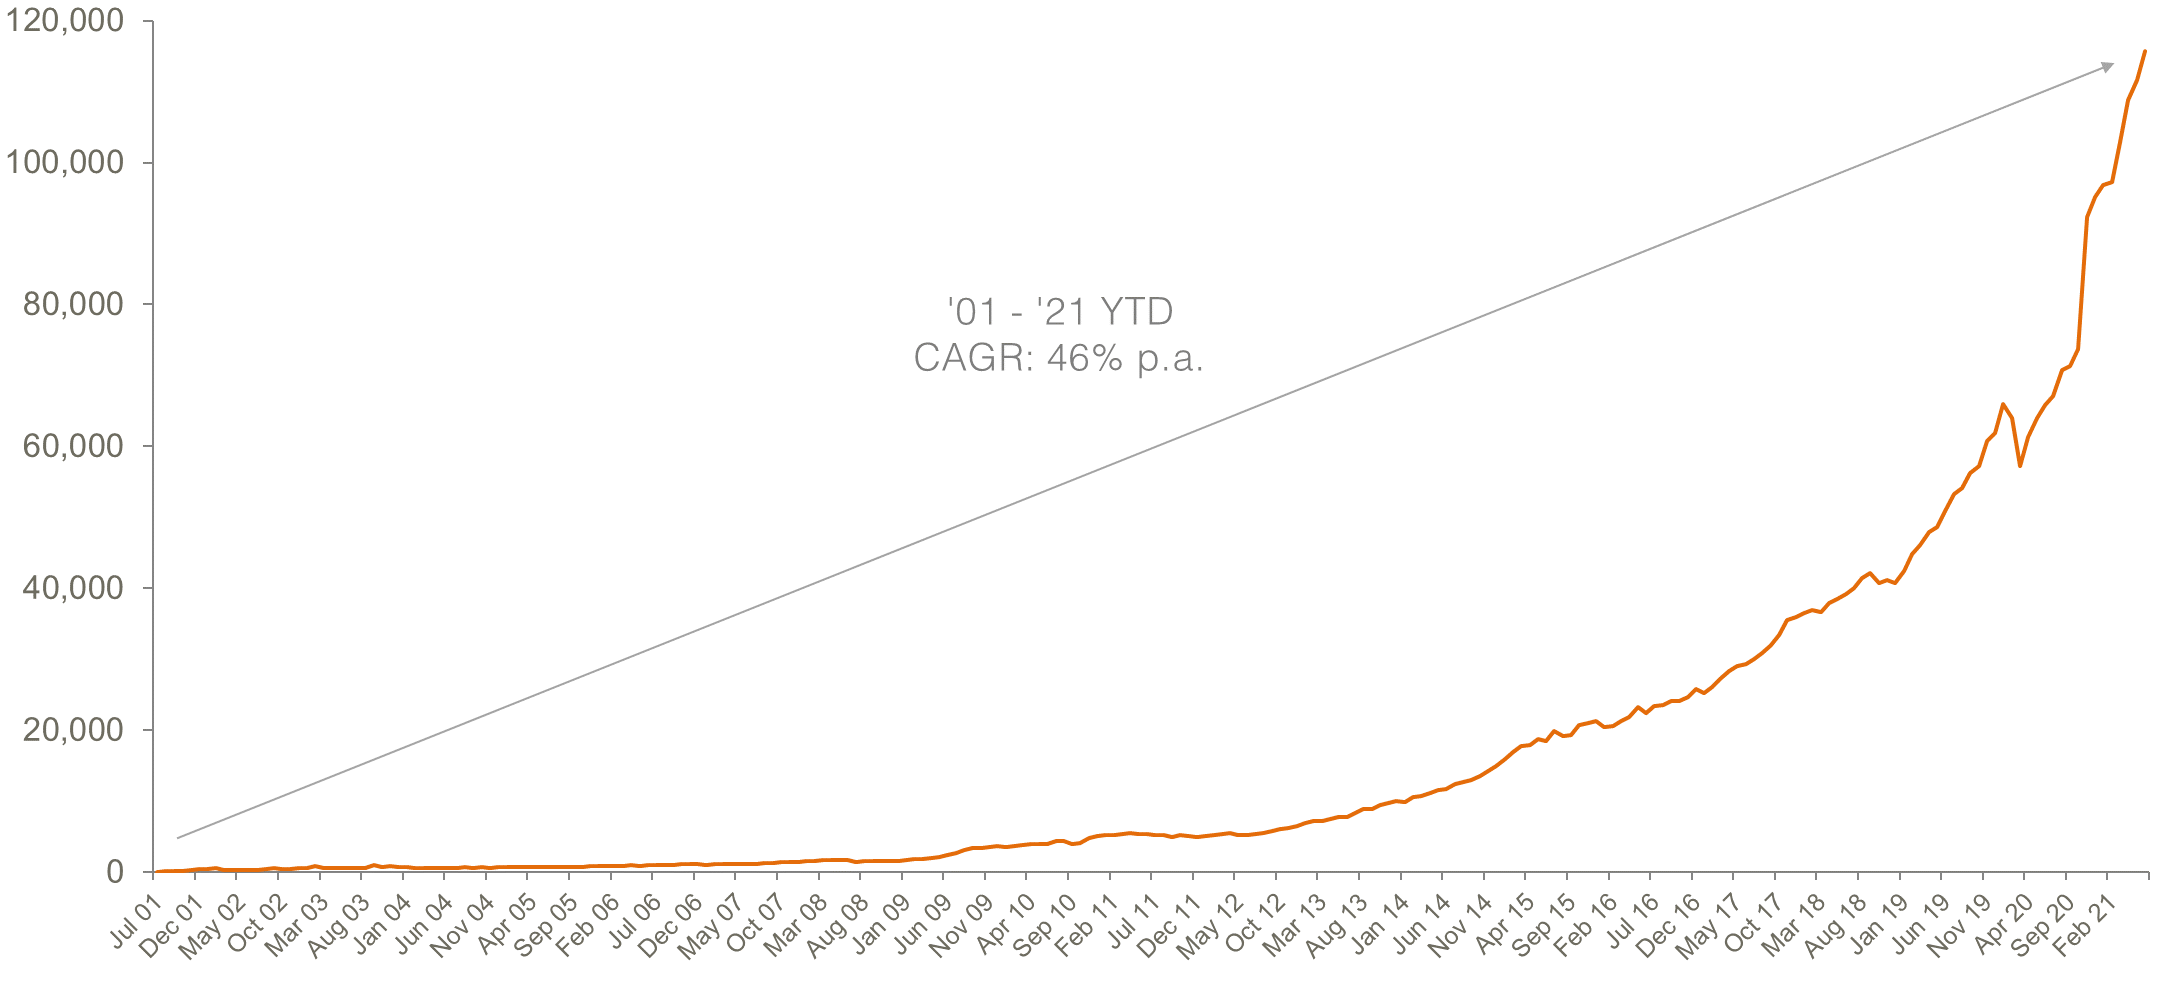
Source: ASX, Chi-X, BetaShares.
Market cap
- ASX Exchange Traded Product market cap: $115.7B1
- Market cap growth for half year: 22%, $20.6B
- Market cap growth for the last 12 months: 76%, + $49.9B – fastest yearly growth ($ terms) on record
Comment: With strong sharemarket performance as a tailwind we saw industry funds under management increase rapidly. We saw Australian ETF industry growth of 22% for the half, to end the financial year at $115.7B, an all-time high. Industry FuM grew ~$20B in the first half of the year, just under half of which came from net flows, and the remainder from asset value appreciation.
1. Includes total FuM for ETFs trading on both ASX and Chi-X
New money
- Net new money for half year (units outstanding by $ value): +$8.8B (6% more growth compared to $8.3B in first half of 2020)
Comment: While asset value growth was far more meaningful as a proportion of growth compared to previous periods, we continued to see robust inflows into the industry, with net new money for the half year of $8.8B. This represents an increase of 6% from the first half of 2020, where net flows were $8.3B. That said, flows were a lot lower than the previous six months (which were a record for the industry) – in the second half of 2020, flows were >$14B.
Products
- 266 Exchange Traded Products trading on the ASX and Chi-X
- New/closed products: 15 new products launched in the half year, 5 products matured, 2 products closed
- 7 new issuers joined the market, all of which were Active managers, and 4 funds converted into Active ETFs – there are currently 30 issuers of ETPs in Australia
- We saw the first conversion of a Listed Investment Company into an Active ETF (Monash Investors)
Comment: Product development activity remained robust in the first half of 2021, with 15 new products launched. Perhaps most notably this included 7 new issuers entering the market, all of which were Active managers. Strikingly, in this last half year, we saw the first conversion of a Listed Investment Company into an Active ETF (Monash Investors) – this is a trend that we believe will continue into the future (Magellan have already started the process for one of their LITs), as the LIC/LIT industry continues to languish. Passive index products took in the vast majority of flows for the period, and remain the dominant category by a very wide margin. Active ETFs saw their share of flows marginally improve (1 percentage point difference to the 2020 share of 10%). It is important to note that the absolute number of Active ETFs that are taking in substantial flows are few and far between – for example, the top 3 Active ETFs for flows represented >80% of the category’s flows this half.
Trading value
- Trading value was almost identical to the previous half year period, and remained high post the ‘break out’ we saw in trading during the initial reaction to COVID in March 2020 and beyond.
Comment: ETF trading values remained strong. Trading value was almost identical to the previous half year period and we are now seeing sustained ETF monthly trading values of $7-$8B on the ASX.
Performance
- Best performing exposures for the half year came from OOO Crude Oil Index Currency Hedged Complex ETF (50% return for the half year), followed by our GGUS Geared US Equities Currency Hedged Complex ETF (34% return for the half year).
Top 5 category inflows (by $) – first half of 2021
| Category | Inflow Value |
| International Equities | $4,976,136,510 |
| Australian Equities | $1,516,001,673 |
| Fixed Income | $1,334,218,236 |
| Multi-Asset | $751,065,393 |
| Listed Property | $241,557,210 |
Comment: Like 2020, the first half of 2021 has seen Global Equities products dominate in terms of flows – the category receiving more than 3x the flows of the next biggest category, Australian Equities (approximately $5.0B and $1.5B respectively). Notably, this half we saw the Multi-Asset class and Listed Property enter the top 5 categories for flows.
Top 5 category outflows (by $) – first half of 2021
| Category | Inflow Value |
| Cash | ($162,881,502) |
| Currency | ($3,923,379) |
Comment: Outflows were generally very low, with only the Cash category receiving minor outflows.
Top sub-category inflows (by $) – first half of 2021
| Sub-Category | Inflow Value |
| International Equities – Developed World | $1,761,483,464 |
| International Equities – Sector | $1,085,390,287 |
| Australian Bonds | $1,026,443,217 |
| Australian Equities – Broad | $987,676,845 |
| Multi-Asset | $751,065,393 |
Top sub-category outflows (by $) – first half of 2021
| Sub-Category | Outflow Value |
| Cash | ($162,881,502) |
| Oil | ($40,820,017) |
| Australian Equities – Geared | ($16,504,639) |
| Currency | ($3,923,379) |
| Australian Equities – Short | ($3,605,494) |
At the end of 2020 (when the industry was $95B) we forecast the industry to end 2021 at $110-$120B. It appears as though our forecast was too conservative and we are now revising our forecast upward – we expect total industry FuM at the end of 2021 to be in the range of $132-$138B.