
Tom Wickenden
6 minutes reading time
This information is for the use of financial advisers and other wholesale clients only. It must not be distributed to retail clients.
SMLL Australian Small Companies Select ETF had a strong year of performance between its annual rebalances outperforming the S&P/ASX Small Ordinaries Index (Small Ords) by 8.7%1, taking since inception outperformance to 1.4% p.a.2
We wanted to take the opportunity to analyse SMLL’s performance between rebalances, particularly given the volatile returns of Australian small caps with very strong performance in 2025 followed by a sharp selloff to begin 2026. As well as looking how the fund’s rebalance positions it for the year ahead.
As a refresher, SMLL invests in a portfolio of 50 to 100 Australian small caps screened to identify companies with positive earnings and a strong ability to service debt. Relative valuation metrics, price momentum and liquidity are also evaluated as part of the selection process.
It is important to remember that past performance is not indicative of future performance.
Avoiding the most speculative
Despite returning 10.7% over the March 2025 to March 2026 period, 48% of the companies in the benchmark Small Ords produced a negative return with over a quarter returning a loss of 20% or greater3.
High dispersion of returns is typical in smaller cap indices with greater uncertainty over future success. Given this, investors have often sought to pick out the ‘best’ small caps in trying to achieve outsized returns.
Instead, the index SMLL aims to track (Nasdaq Australia Small Cap Select Index) looks to avoid holding some of the more speculative small caps that are higher risk. The Index uses fundamental metrics to remove companies that are pre-profit and/or have large levels of debt. Companies with these attributes can go on to achieve significant investor returns, however they can also be more speculative with the potential for greater investor losses.
Over the year, SMLL’s approach generated a positive skew in returns. Just 34% of SMLL’s holdings produced negative returns, compared to 48% in the benchmark. This meant the majority of SMLL’s outperformance (60%) came from avoiding the benchmark’s worst performers, with the remaining 40% driven by the higher resulting weight in winning stocks4.
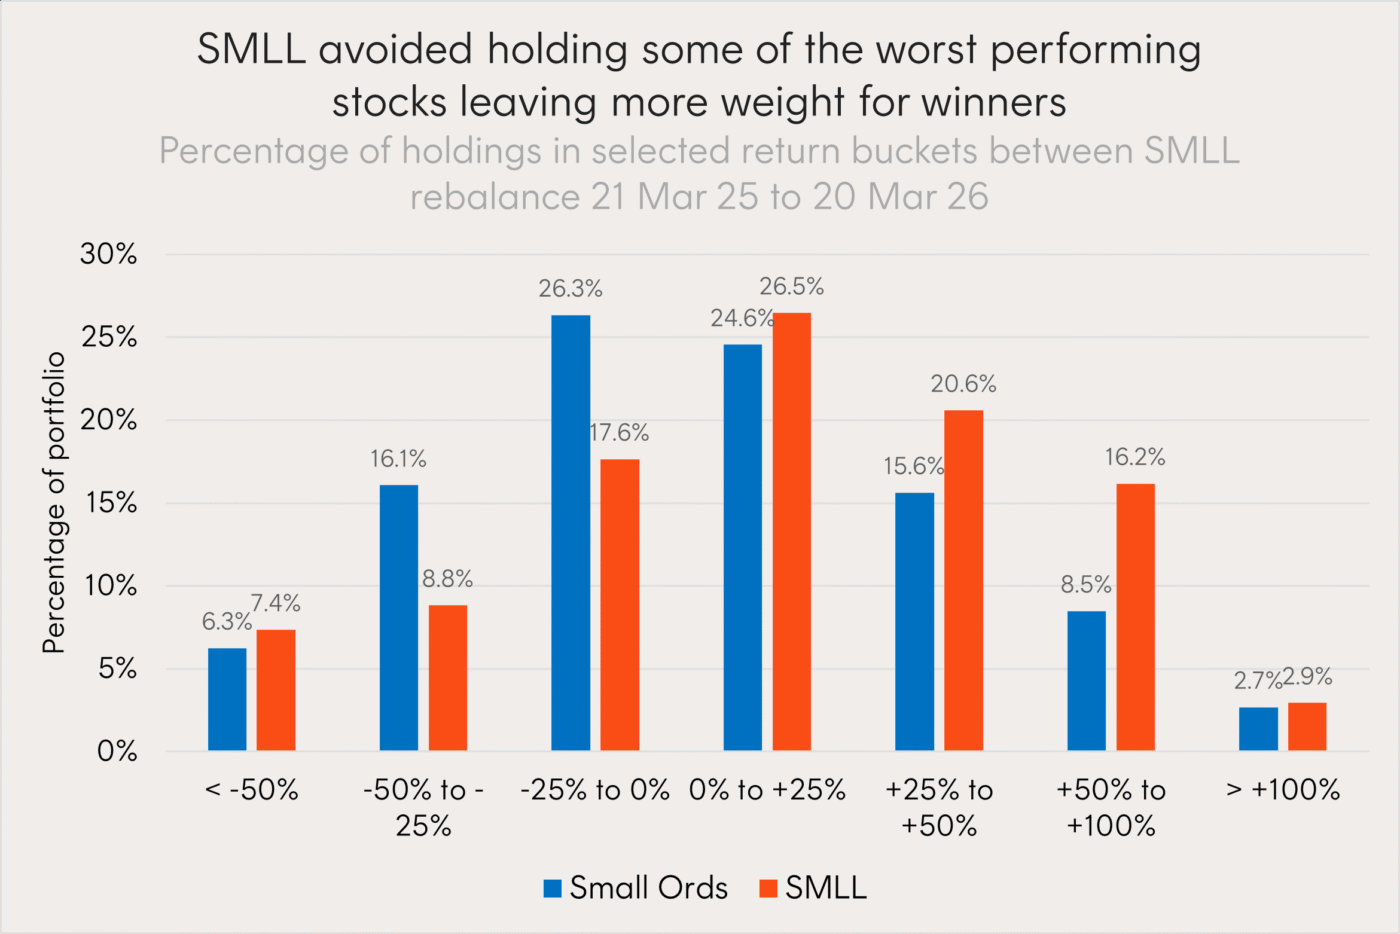
Source: Bloomberg. 21 Mar 2025 to 20 Mar 2026. Percentage of S&P/ASX Small Ordinaries Index and SMLL portfolio is selected return buckets. Past performance is not an indicator of future performance. You cannot invest directly in an index.
Consistency across sectors
Promisingly SMLL’s results were fairly consistent across sectors with 8 out of 10 contributing to positive active returns versus the Small Ords.
SMLL held just 19 of the 62 materials companies in the Small Ords during the period, screening out a large number of more speculative miners based on fundamentals. Despite holding fewer names, SMLL maintained a meaningful overweight to the sector and this positioning drove the largest sector contribution to active returns at +3.0%5.
Further, SMLL’s focus on profitable, cash-generative businesses rather than more speculative tech names proved particularly valuable as AI-related fears drove a broad sell-off in technology names through late 2025 and into early 2026. SMLL’s IT holdings delivered a standout average return of +22.5% over the period, compared to -2.85% for the sector in the benchmark6.
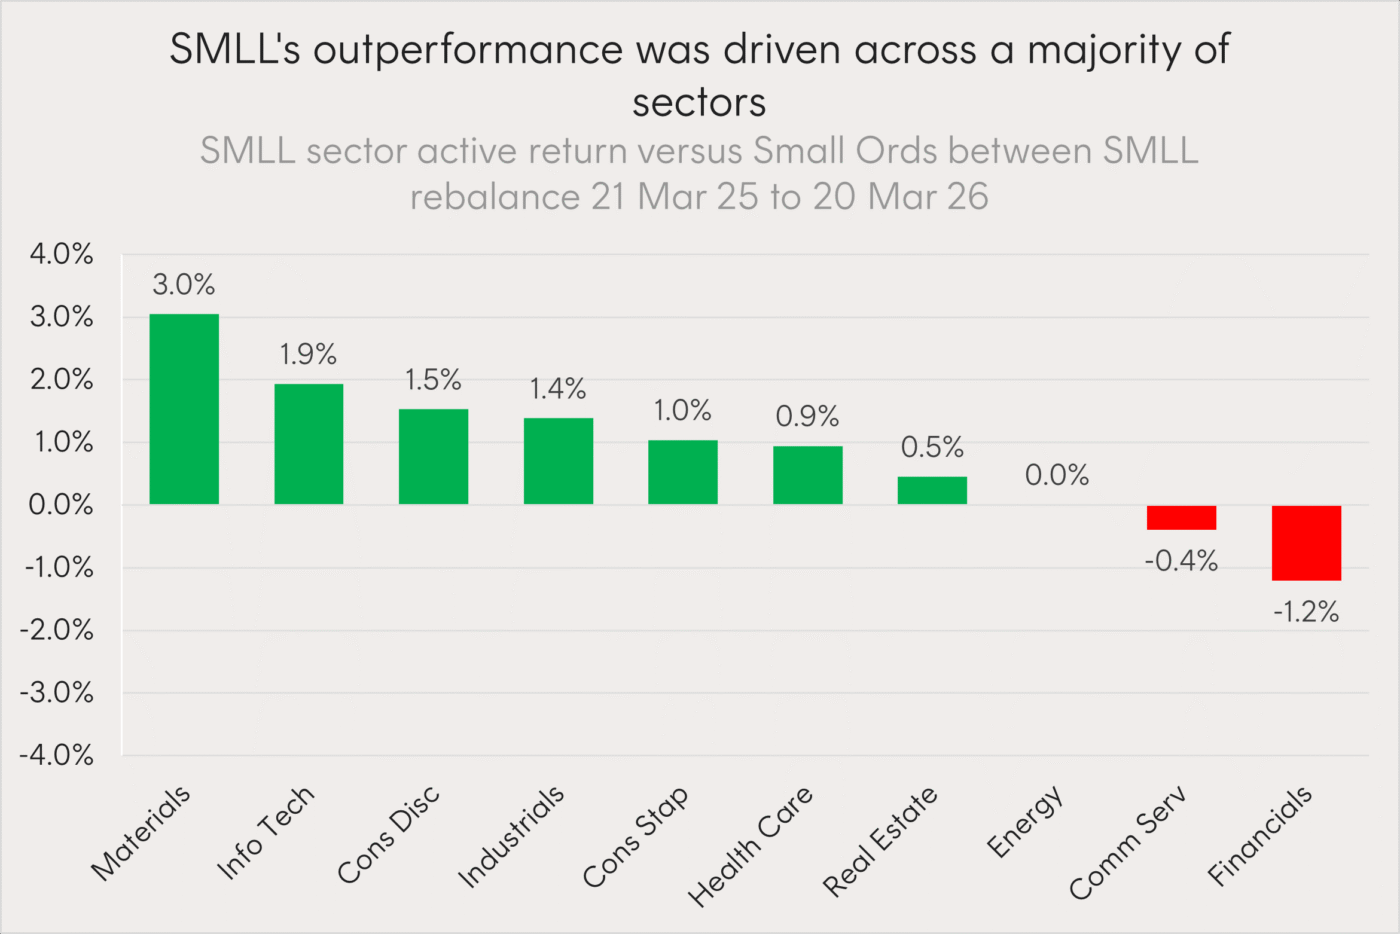
Source: Bloomberg, Betashares. 21 March 2025 to 20 March 2026. Active sector return of SMLL versus S&P/ASX Small Ordinaries Index. Past performance is not an indicator of future performance. You cannot invest directly in an index.
SMLL maintained a significant underweight to financials, averaging 5% versus 12% in the benchmark over the year7. With the broader sector declining over the period, the underweight positioning was a tailwind to performance. However, this was more than offset by the sharp sell-off in HMC Capital, an overweight in SMLL’s portfolio which fell nearly 68% over the period8. HMC Capital had initially screened well on earnings and balance sheet strength, but a lowered earnings outlook, tenant distress within its healthcare REIT, and a key management departure saw sentiment deteriorate sharply.
Rotation out of gold, into a more balanced portfolio
An inherent feature of small cap investing is that when companies perform strongly, they often graduate into mid or large cap indices, making them no longer eligible for small-cap funds such as SMLL. This natural turnover can drive meaningful changes in positioning. By rebalancing only once a year, SMLL aims to capture the growth of these high-performing companies before they graduate out of the small-cap universe.
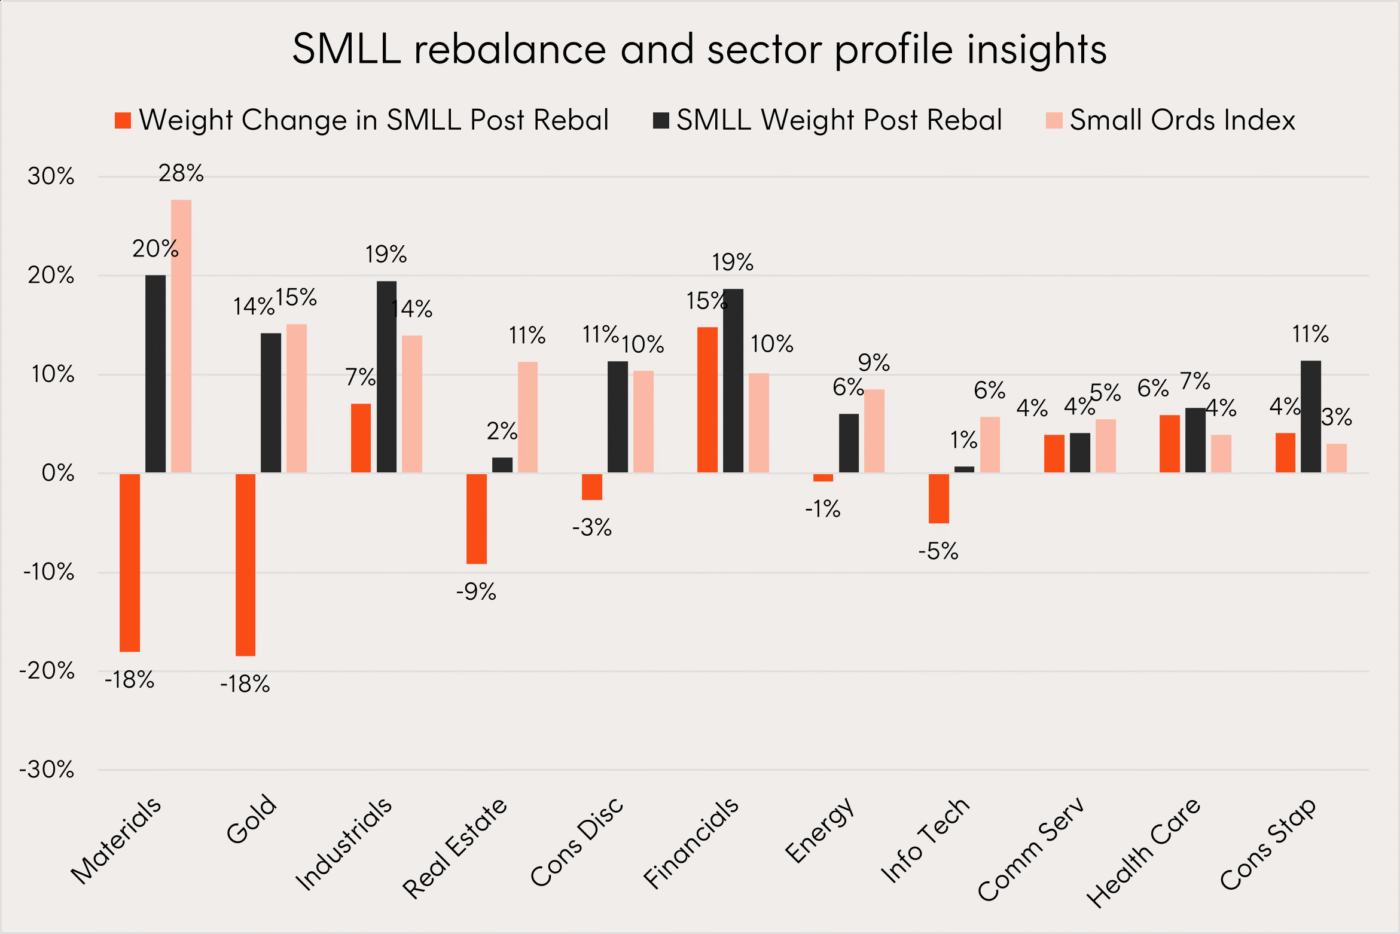
Source: Bloomberg, Betashares. As at 21 March 2026.
During this year’s annual rebalance SMLL’s gold exposure was reduced, alongside a broader reduction in materials, as strong-performing gold names graduated out of the small-cap universe. Financials saw the largest increase and is now the portfolio’s largest overweight position.
Overall, positioning is now better balanced across sectors, with less reliance on commodity-linked exposures and greater diversification elsewhere.
Investment implications
SMLL is a small-cap strategy providing access to a tailored portfolio of high-quality, profitable small-cap Australian companies, applying a screening process focused on excluding companies which may be a drag on long-term performance.
Investors can use SMLL as a portfolio building block for allocation to Australian small caps.
For more information on SMLL visit the fund page here.
There are risks associated with an investment in SMLL, including investment objective risk, market risk and small companies risk. Investment value can go up and down. An investment in the Fund should only be considered as a part of a broader portfolio, taking into account your particular circumstances, including your tolerance for risk. For more information on risks and other features of the Fund, please see the Product Disclosure Statement and Target Market Determination, both available on this website.Past performance is not indicative of future performance.
Sources:
1. Source: Bloomberg. 21 March 2025 to 20 March 2026. SMLL is rebalanced annually on the third Friday in March. Past performance is not an indicator of future performance. You cannot invest directly in an index. ↑
2. Source: Bloomberg. As at 21 March 2026. SMLL was incepted on 7 April 2017. Performance figures are actual fund returns net of SMLL’s management fees and costs of 0.39% p.a. of Past performance is not an indicator of future performance. ↑
3. Source: Bloomberg. 21 March 2025 to 20 March 2026. Past performance is not an indicator of future performance. You cannot invest directly in an index. ↑
4. Source: Bloomberg. 21 March 2025 to 20 March 2026. Past performance is not an indicator of future performance. ↑
5. Source: Bloomberg. 21 March 2025 to 20 March 2026. Past performance is not an indicator of future performance. ↑
6. Source: Bloomberg. 21 March 2025 to 20 March 2026. Past performance is not an indicator of future performance. ↑
7. Source: Bloomberg. 21 March 2025 to 20 March 2026. ↑
8. Source: Bloomberg. 21 March 2025 to 20 March 2026. ↑