
Southern route

Tom Wickenden
6 minutes reading time
Related articles

The Core portfolio within each asset class is intended to do the heavy lifting when it comes to implementing your asset allocation, hence it is critical to have a robust portfolio construction process.
This analysis focuses on the Australian equities portion and how one could implement a Core portfolio and a framework using satellite exposures to express one’s views throughout the economic cycle.
We can think of the Core portfolio as having two elements:
- A relatively cheap benchmark exposure such as A200 Australia 200 ETF . This is the anchor for the portfolio and can be used to dial up and down both the overall fees, as well as the tracking error, to fit within your fee and risk budgets.
- A mix of uncorrelated (excess returns) exposures or factors which are combined to optimise your information ratio (i.e. excess return / tracking error).
For example, The Solactive Australian Quality Select Index (the index AQLT Australian Quality ETF tracks which has a strong quality bias) and the FTSE RAFI Australia 200 Index (the index QOZ FTSE RAFI Australia 200 ETF tracks which has a value bias) have historically generated a correlation of -0.3, hence making them good candidates to complement each other. While not representative of future performance, both indices have also historically outperformed the S&P/ASX 200 over the long run.
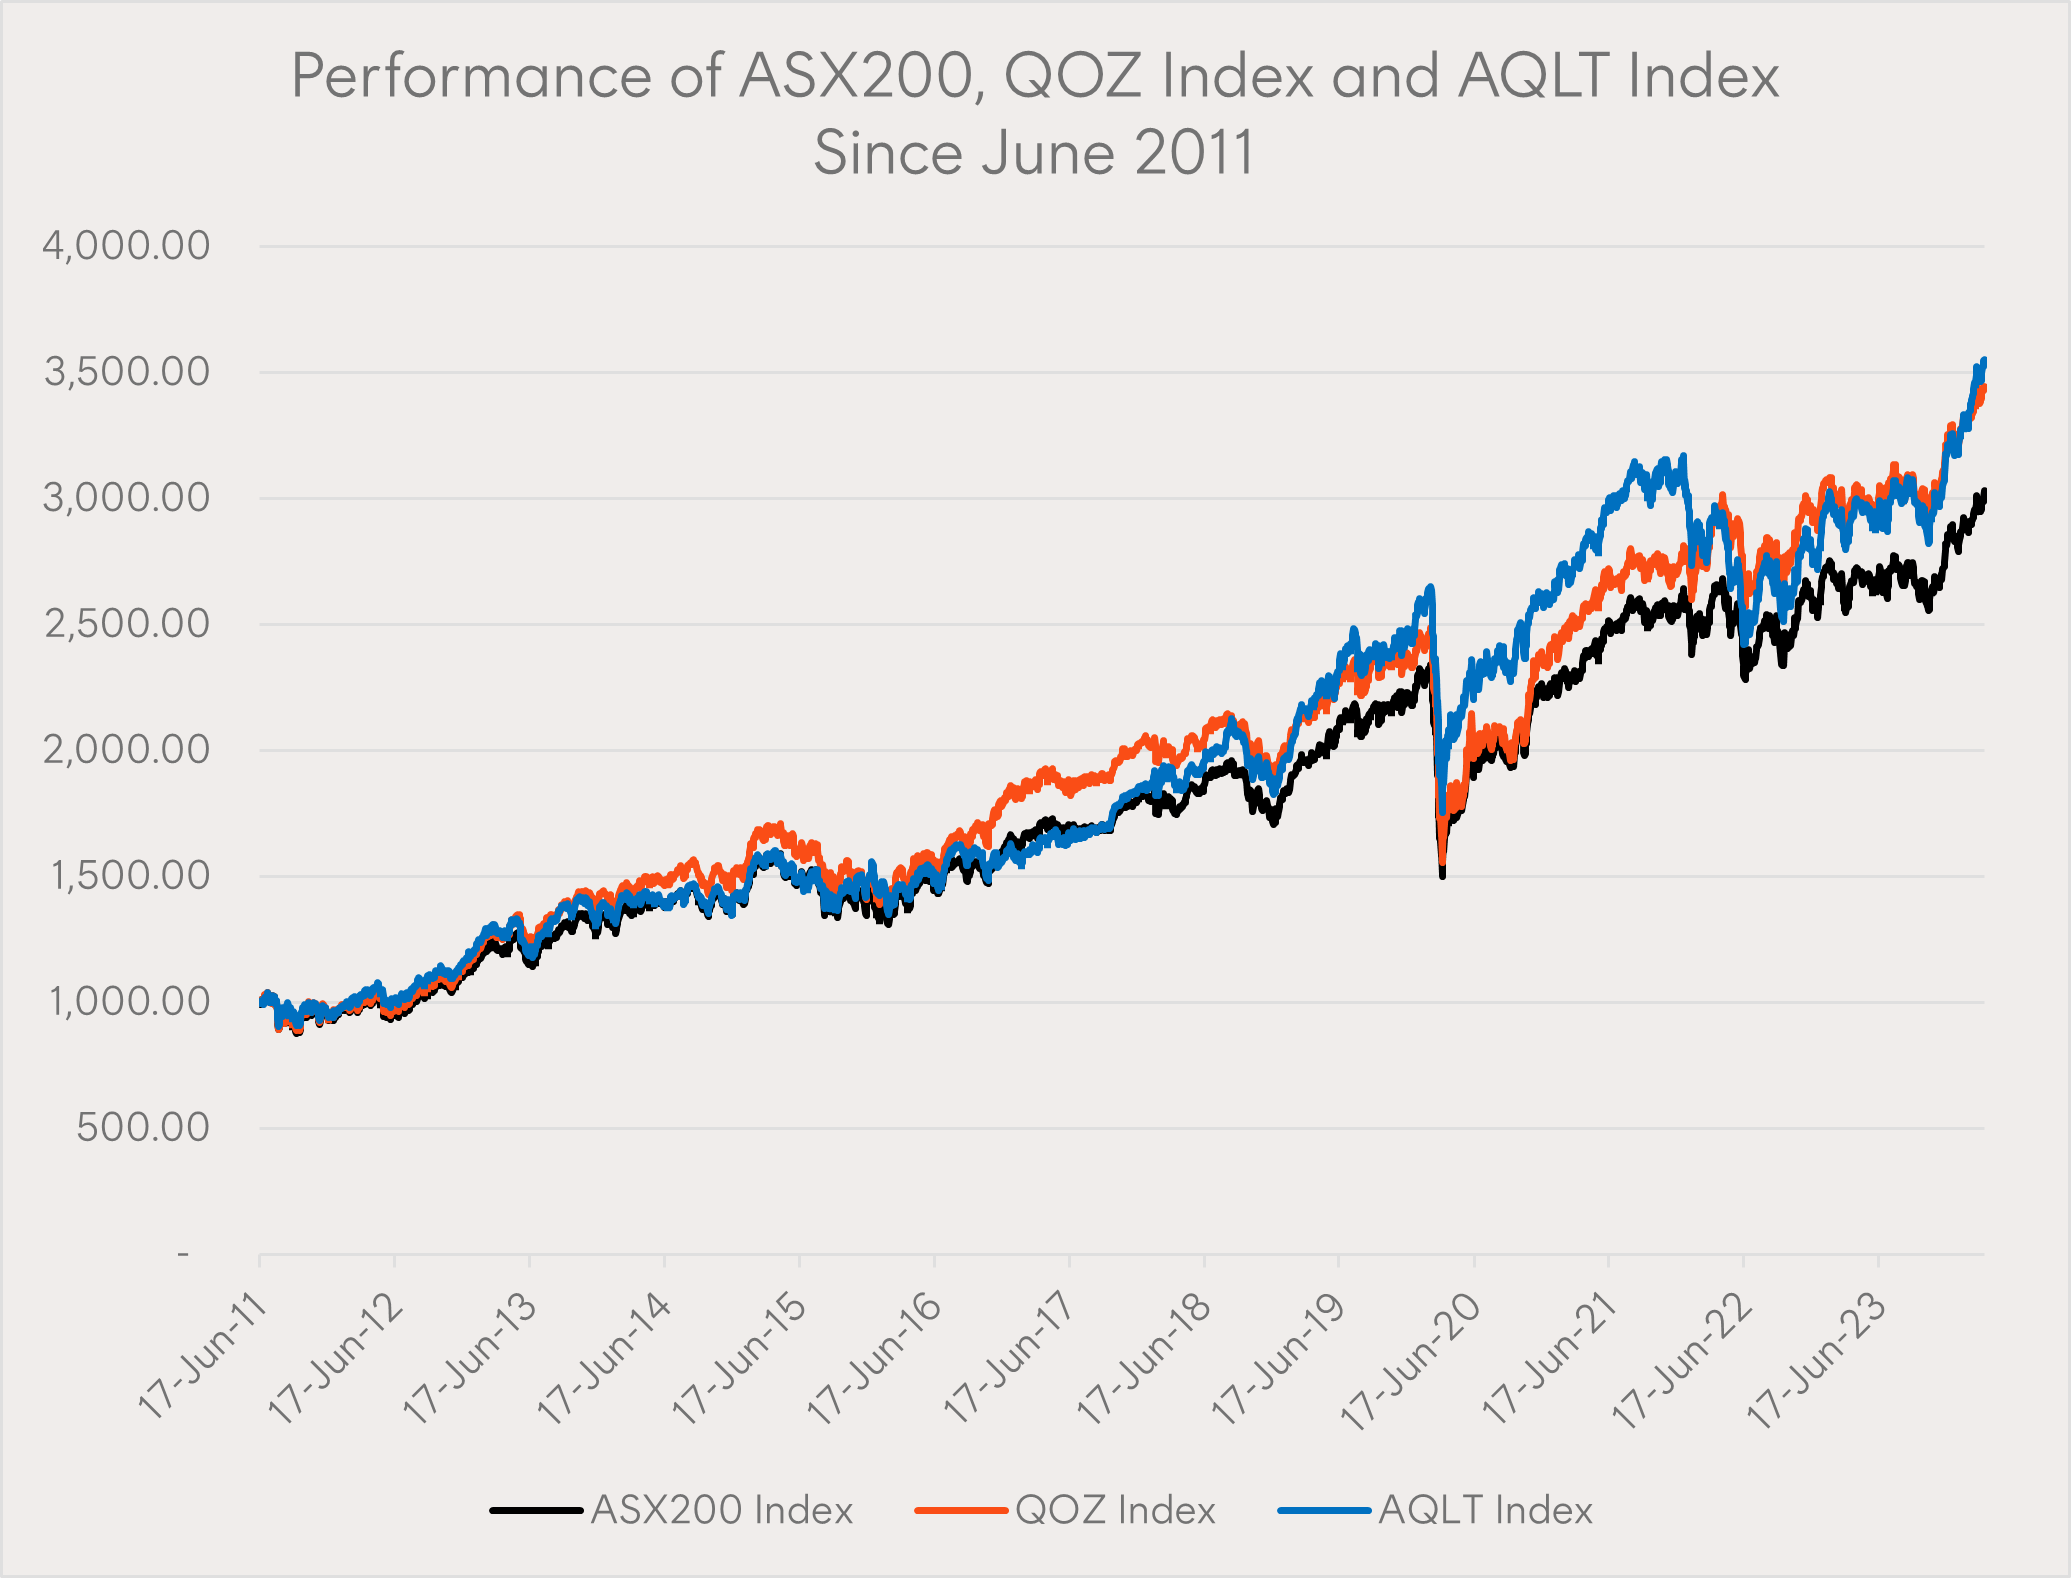
Source: Bloomberg, Betashares. As at 29 March 2024.
The chart below shows the rolling 1-year excess returns of AQLT’s index and QOZ’s index. The strong negative correlation over the last ~12 years is clearly visible.
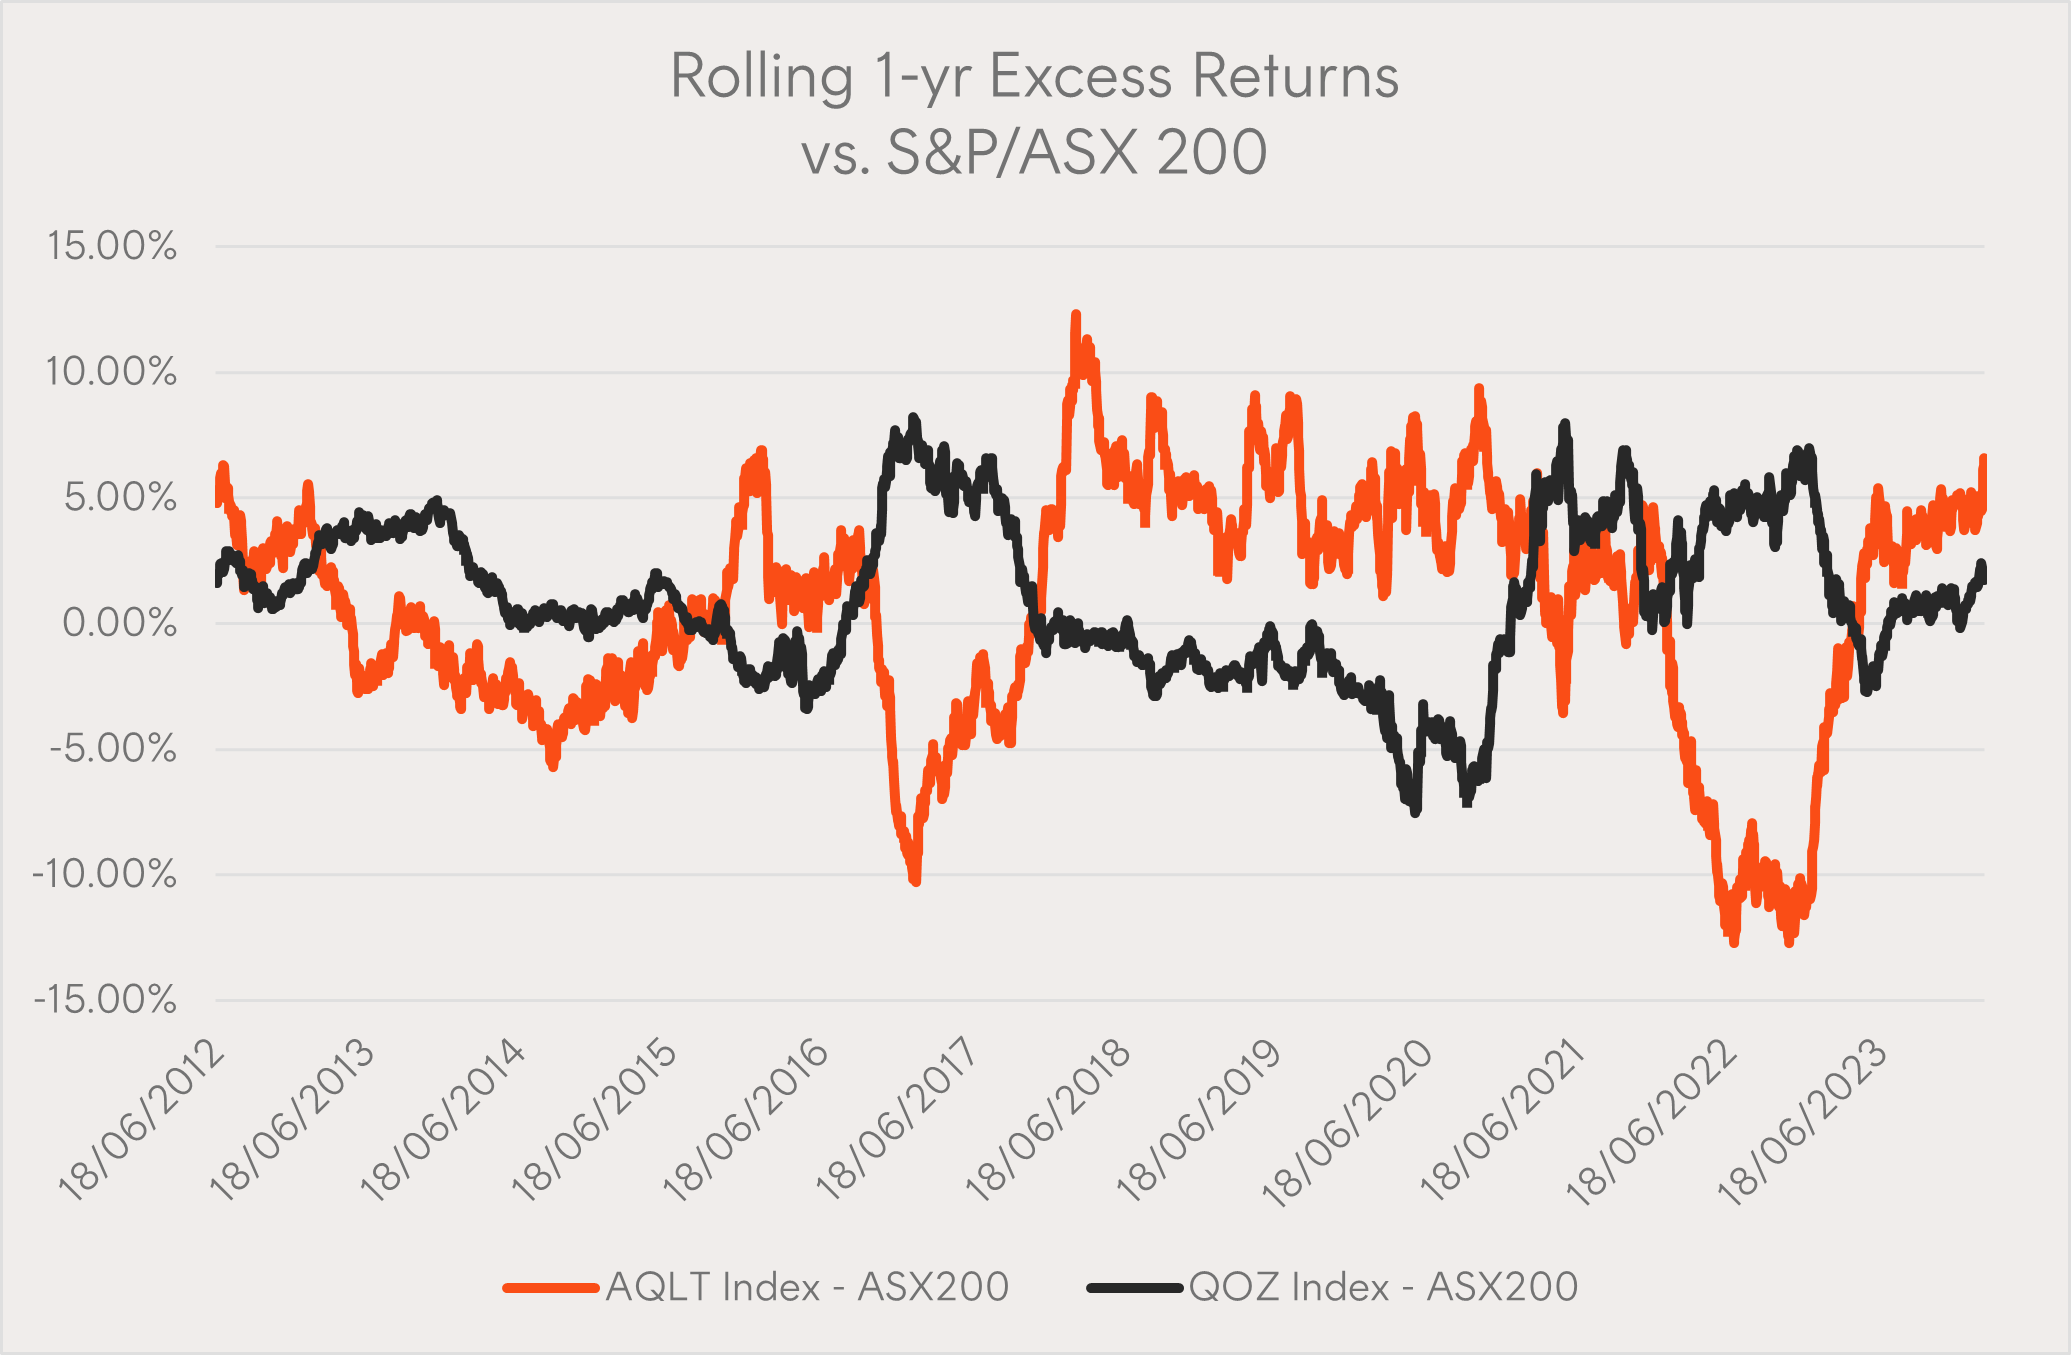
Source: Bloomberg, Betashares. As at 29 March 2024.
The benefits of combing two negatively correlated factors is evident in the same rolling 1-year excess return chart, which in our example takes a combination of 35% AQLT’s index and 65% QOZ’s index, rebalanced semi-annually, as an optimal mix.
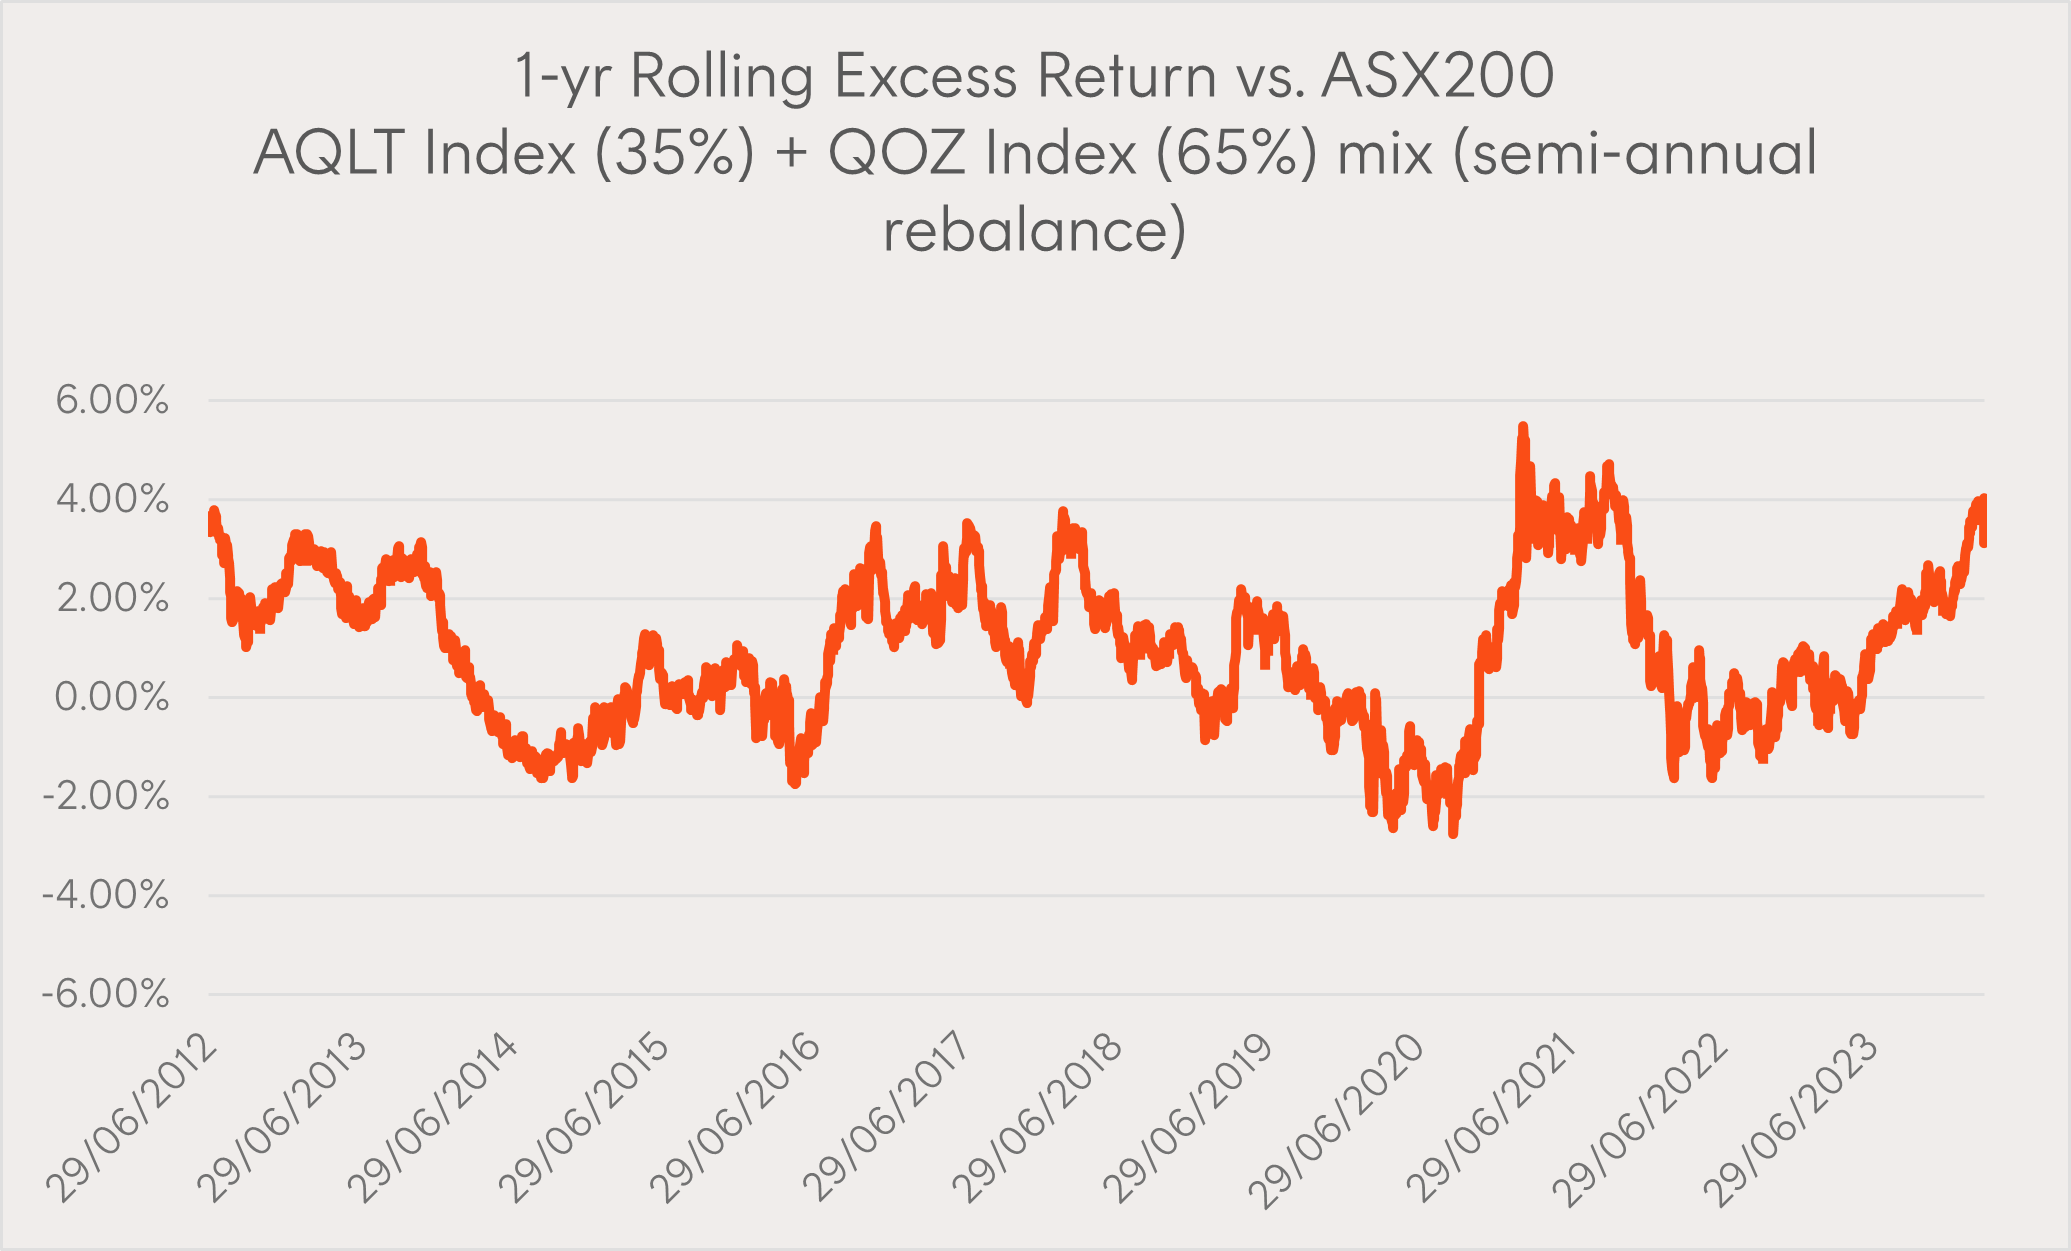
Source: Bloomberg, Betashares. As at 29 March 2024.
This particular portfolio mix has historically reduced the maximum and minimum ranges of that portfolio’s 1-year rolling excess returns as further shown in the table relative to each index in isolation. It has also generated an increased period of positive out-performance over the measurement period, an improvement from circa 62% to 70%. What this demonstrates is combining uncorrelated factors can smooth out a portfolio’s path relative to the benchmark and hence improve the portfolio’s risk/return characteristics.
| 1 Year Rolling Excess Returns | % Positive | Max | Min | Average | Median |
| AQLT Index | 61.84% | 12.30% | -12.74% | 0.74% | 1.72% |
| QOZ Index | 62.03% | 8.20% | -7.55% | 1.03% | 0.69% |
| AQLT Index (35%)+QOZ Index (65%) | 69.83% | 5.49% | -2.75% | 0.96% | 0.96% |
Source: Bloomberg, Betashares. As at 29 March 2024.
Returning to how to design a portfolio with these characteristics, it is simply identifying the minimum tracking error combination. Given both exposures are negatively correlated, and using ex-ante tracking error forecasts, the below mix suggests on a 1 year forward looking basis, the mix that achieves the minimum tracking error portfolio is 35% AQLT and 65% QOZ .
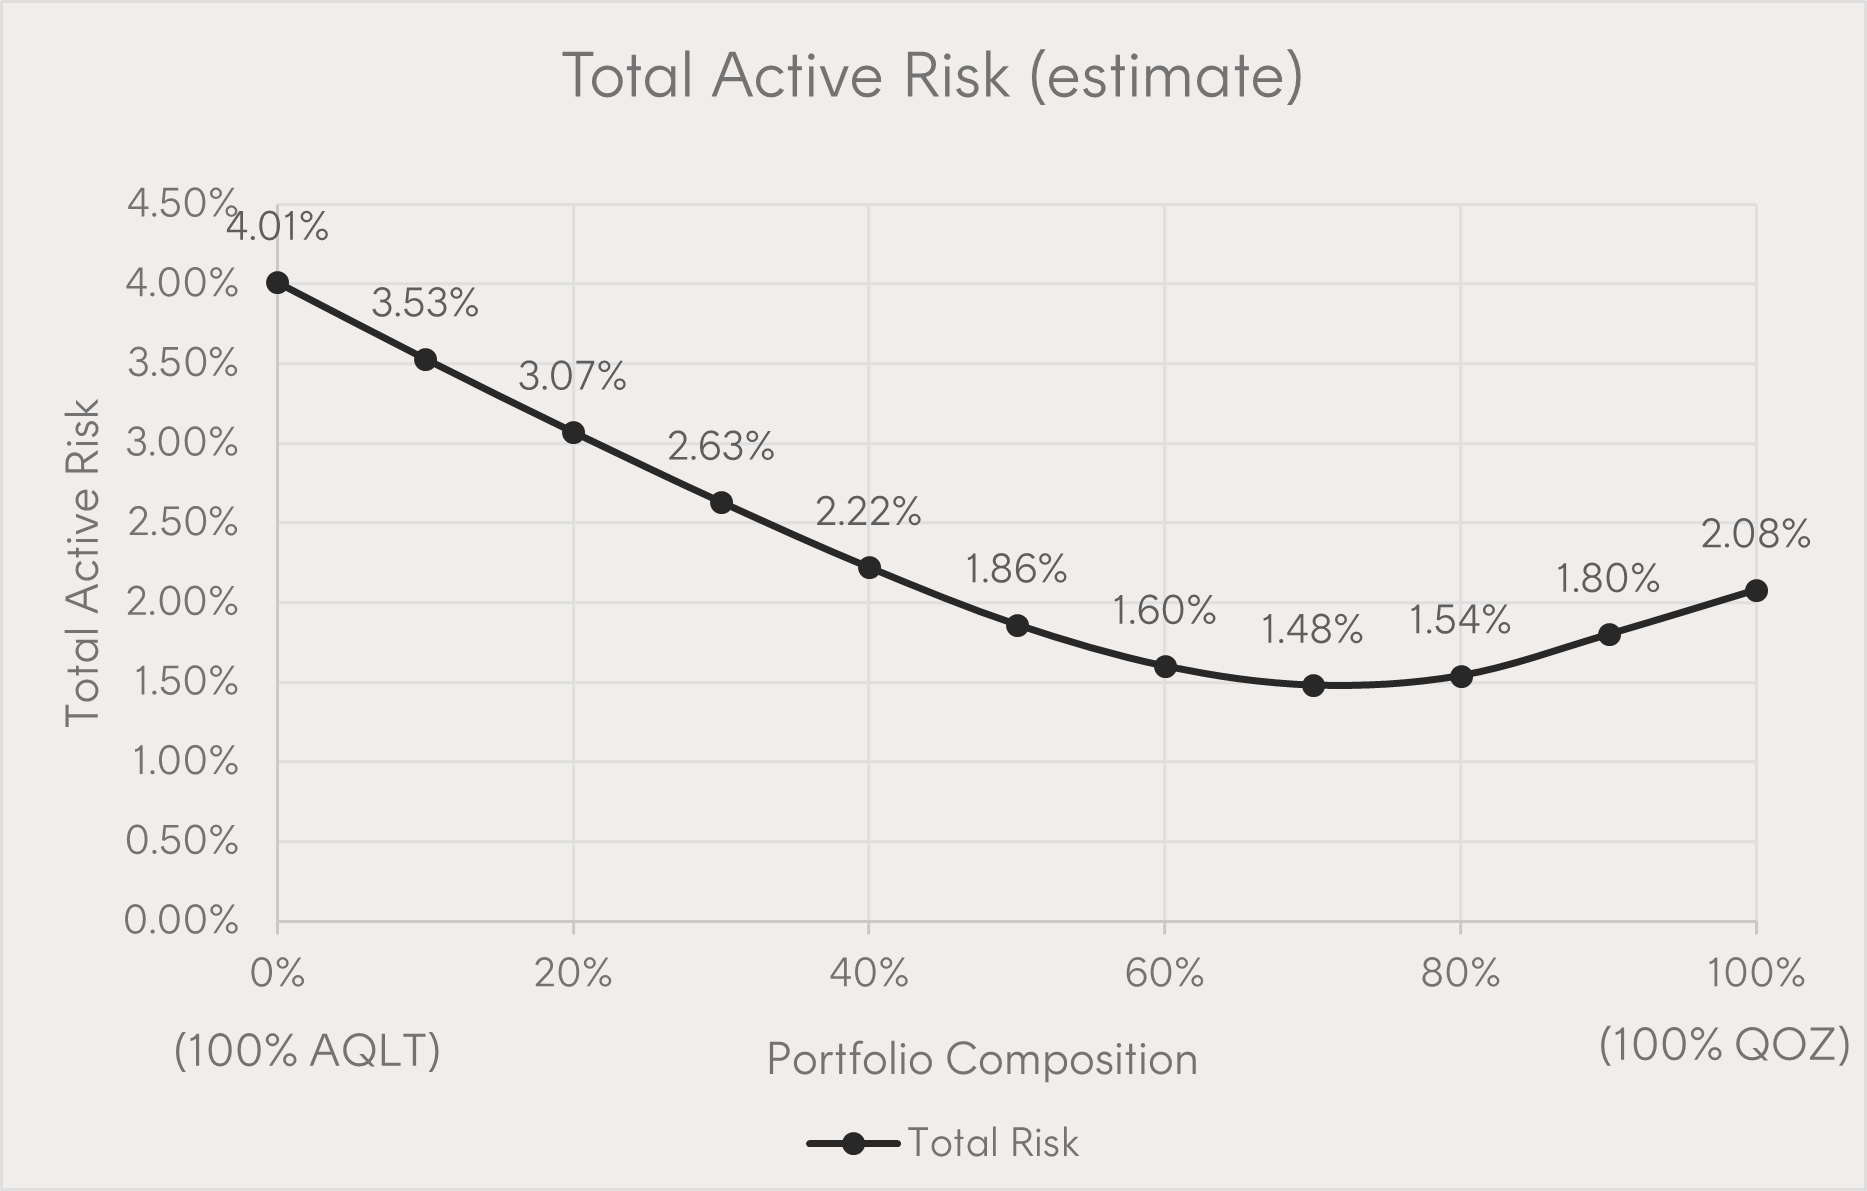
Source: Bloomberg, Betashares. As at 29 March 2024.
If we back-test this 35/65 mix (with a semi-annual rebalance) since inception of both indices (30 June 2011) we can see the realised tracking errors below, with the mix achieving the lowest outcome:
| Ex-Post Tracking Error | p.a. |
| AQLT Index | 4.66% |
| QOZ Index | 2.66% |
| AQLT Index (35%) + QOZ Index (65%) MIX | 2.02% |
Source: Bloomberg, Betashares. As at 29 March 2024.
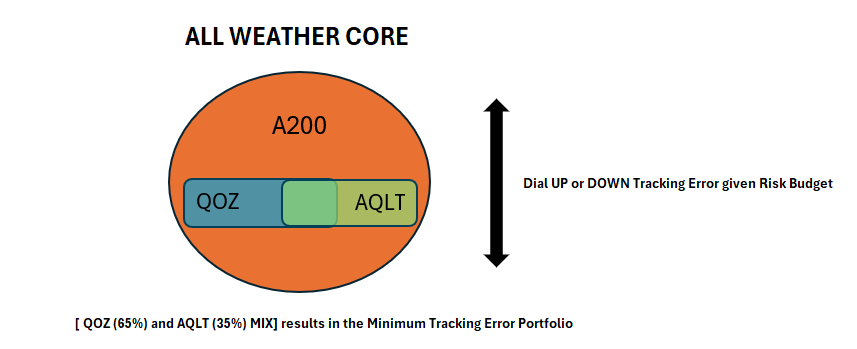
Once we have our mix of uncorrelated exposures, we can use this mix with the anchor of the Core portfolio (A200) to dial up and down the fees or tracking error. For example, if we combine this mix with 60% of A200’s index (semi-annually rebalanced) the realised tracking error of the Core portfolio has resulted in a 0.90% p.a. tracking error since 30 June 2011.
| Combine with A200 to manage Risk budget: | Tracking Error |
| A200 Index (60%) + MIX (40%) | 0.90% |
Source: Bloomberg, Betashares. As at 29 March 2024.
The Core portfolio is designed to be a permanent allocation which can be held throughout the economic cycle. During parts of the economic cycle, the Core portfolio can be further combined with satellite exposures based on one’s view of mispricing or market opportunity.
Source: Betashares.
For illustrative purposes only, a simple investment framework could be implemented as pictured below. Since Quality tends to outperform during drawdowns or recessionary periods, and Value tends to outperform during market lows and recovery periods, the Core portfolio could be leaned on more heavily during this part of the economic cycle. Mid and small cap companies tend to outperform coming out of the recovery, and as we enter the expansion phase, technology, financials, and resources may be further opportunities to tilt towards. Importantly, all of these considerations can be designed to fit inside any risk budget by simply dialling up and down the ‘levers’ – i.e. changing the mix between the core and satellite exposures.
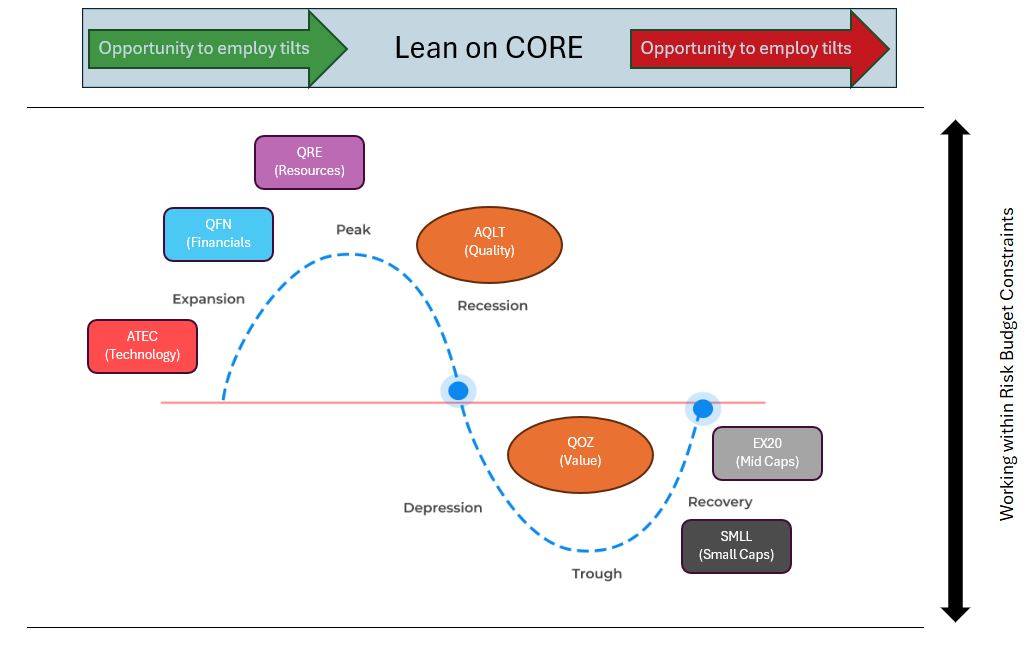
Source: Betashares.
A further consideration is the choice of levers. Using transparent and consistently applied exposures such as passively managed ETFs allows investors and advisers to measure the risk and positioning in real time to ensure portfolios are exposed to the intended risks throughout the economic cycle.
Conclusion
In summary, if we believe certain exposures can lead to long term out-performance, combining 2 uncorrelated exposures (in this case quality and value) can result in the same end goal, but the journey can be a much smoother experience. This can further be managed by combining the portfolio mix with an inexpensive benchmark holding, which forms the Core portfolio designed to be held throughout the economic cycle. For those who employ a dynamic strategy, we highlight a simple framework that could be used to further enhance returns based on ones preserved opportunity set and risk budget.
This note is not a recommendation or offer to make any investment or to adopt any particular investment strategy.
Explore
Markets