
Hans Lee
7 minutes reading time
When markets fall sharply, the urge to react can be powerful.
That urge has been reinforced in recent days. Australian shares fell more than 6% in the five days to 9 March 2026, while oil prices briefly surged to their highest levels since Russia first invaded Ukraine in 2022.
These are the sort of moves that can cause some investors to sell first and ask questions later. However, doing so can be an expensive instinct to follow. The data below details why.
Market volatility is a feature, not a flaw
The instinct to read turbulence as a signal is understandable. But price swings and permanent losses are not the same thing. What often separates the two is whether an individual stayed invested long enough for the market to do its job.
According to an analysis of US market data in the period from 1996 to 2026, the S&P 500 has fallen 1% or more on an average of 33 trading days each year and a 5% or greater drop has occurred 21 times. In every case, the market eventually recovered over the long term.
History shows that moves like this tend to be a recurring feature of share markets, and rarely a reliable signal to change a long‑term investing plan.
The real test is discipline
The pattern is clear enough on paper. But knowing that all this is only half the battle.
A hypothetical historical performance simulation modelled by Betashares illustrates how this principle can be put into practice. Of course, it’s important to remember that past performance (whether actual or simulated) is not indicative of future performance, and actual outcomes will vary.
Based on a $500,000 starting balance in August 2008, by 27 February 2026, a hypothetical investor who stayed fully invested in a portfolio representing the S&P/ASX 200 throughout the 2008 Global Financial Crisis would have come out only slightly behind an investor who picked the top perfectly and moved to cash for a year.
On the other hand, a hypothetical investor who tried to time the market and sold right at the bottom would have seen meaningfully worse outcomes over the comparison period.
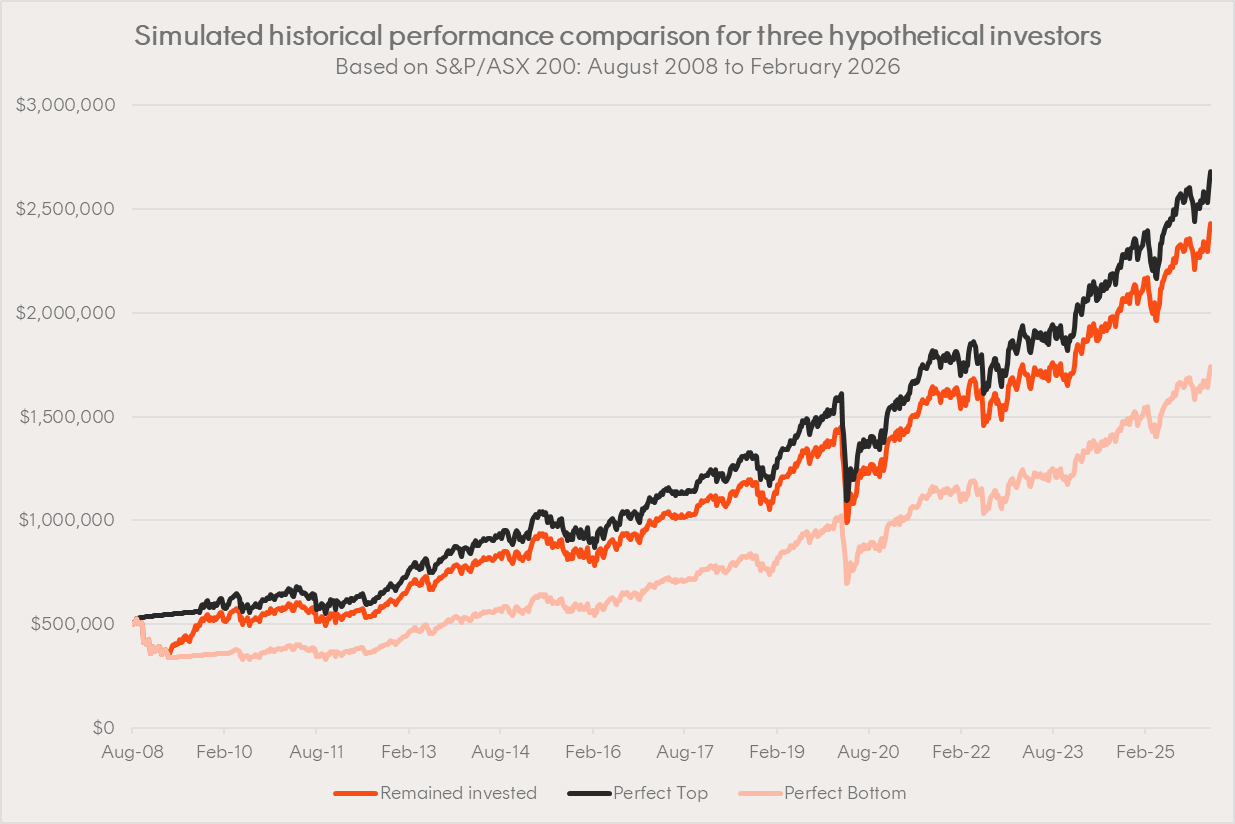
Source: Bloomberg, Betashares Direct. Returns are based on the S&P/ASX 200 and does not take into account any fees and costs. You cannot invest directly in an index. The ‘perfect top’ represents a hypothetical investor who moved their balance into a term deposit paying the RBA cash rate on 29 August 2008 and held this investment for one full calendar year, while the ‘perfect bottom’ represents a hypothetical investor who moved their balance into a term deposit paying the RBA cash rate on 6 March 2009 and held this investment for one full calendar year. Past performance (whether actual or simulated) is not an indicator of future performance. Provided for illustrative purposes only – not a recommendation to invest or adopt any investment strategy.
During COVID, the story repeated itself. Over a one-year window, from 1 March 2020 to 27 February 2026, the advantage of perfectly picking the market top (based on the S&P/ASX 200) and moving to cash for a year would have been just 3%, assuming no additional contributions were made during the period. For a hypothetical investor who timed the bottom rather than the top, they would have ended up with 34% less in gains than an investor who stayed the course and remained invested throughout the relevant period.
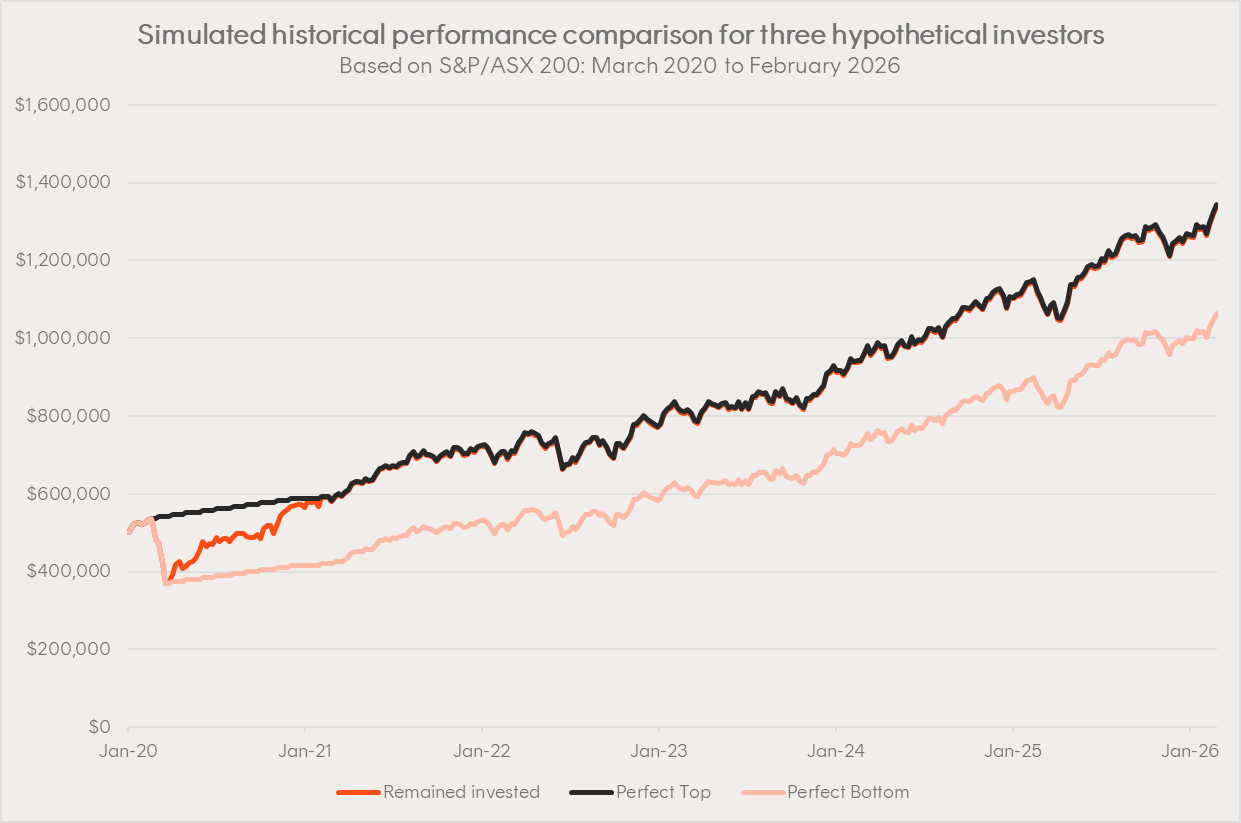
Source: Bloomberg, Betashares Direct. Returns are based on the S&P/ASX 200 and does not take into account any fees and costs. You cannot invest directly in an index. The ‘perfect top’ represents a hypothetical investor who moved their balance into a term deposit paying the RBA cash rate on 21 February 2020 and held this investment for one full calendar year, while the ‘perfect bottom’ represents a hypothetical investor who moved their balance into a term deposit paying the RBA cash rate on 20 March 2020 and held this investment for one full calendar year. Past performance (whether actual or simulated) is not an indicator of future performance. Provided for illustrative purposes only – not a recommendation to invest or adopt any investment strategy.
More recently, during the Liberation Day sell-down, a hypothetical investor who sold right at the top and reinvested just 3 months later would have underperformed an investor who ‘rode out’ the crash without selling by more than 8% in less than a year.
In other words, remaining invested would have resulted in better returns.
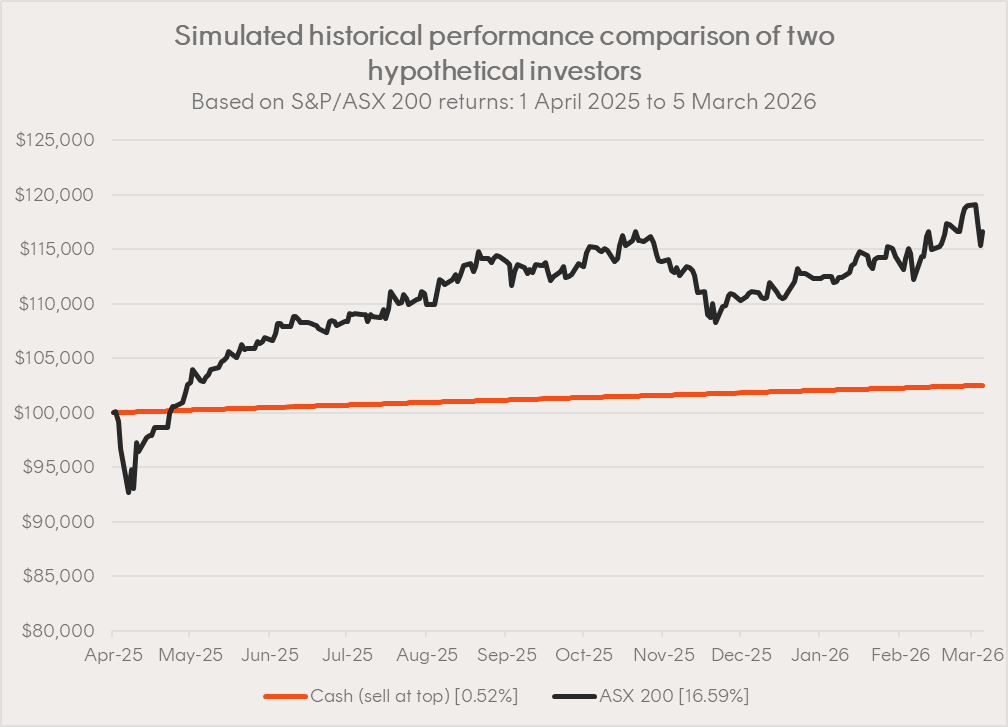
Source: Bloomberg, Betashares Direct. You cannot invest directly in an index. Data shows returns of the hypothetical investors (one who remained invested in a portfolio representing the S&P/ASX 200 (dividends reinvested) and another who sold their investments on 1 April 2025 and held the amount in cash (earning the RBA cash rate) over the period from 1 April 2025 to 5 March 2026). Past performance (whether actual or simulated) is not an indicator of future performance. Provided for illustrative purposes only – not a recommendation to invest or adopt any investment strategy.
Dollar-cost averaging: process over prediction
For investors seeking a structured approach to uncertain markets, dollar-cost averaging – investing a fixed amount at regular intervals regardless of market conditions – can offer a framework worth considering.
To help illustrate (by way of example), investing $100,000 in a hypothetical portfolio comprising the largest 200 companies on the ASX by market capitalisation at the ‘perfect top’ in 2008 and remaining invested would have grown the portfolio value to approximately $1,377,935 (as at 27 February 2026). Meanwhile, a $2,000/month DCA strategy over the same period (i.e. investing this amount at the start of each month) would have resulted in a portfolio value of around $1,339,667 – a gap of just 3%.
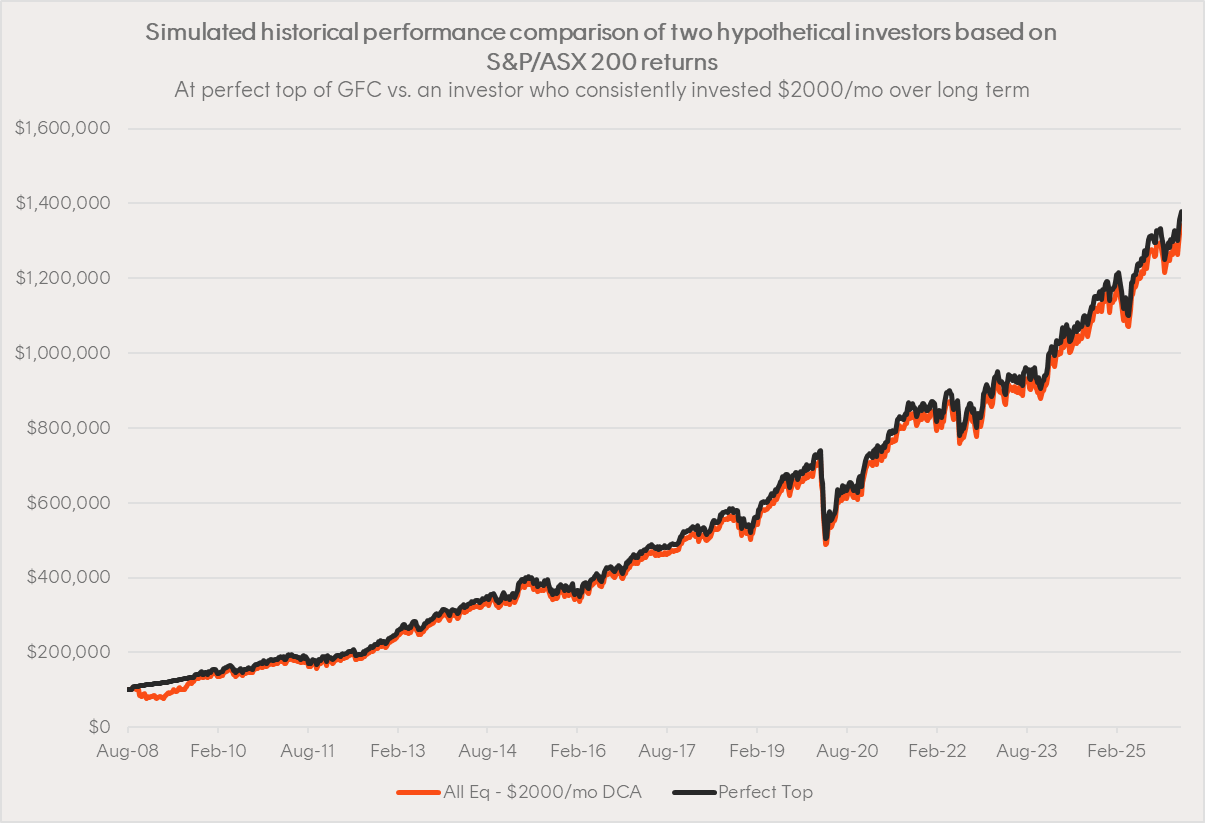
Source: Bloomberg, Betashares Direct. You cannot invest directly in an index. Data shows returns of the hypothetical investors (one who began to invest $2000 a month starting on 1 August 2008 and one who invested at the perfect top on 29 August 2008. Both investors are assumed not to have sold any of their holdings along the way. Returns data cuts off at 27 February 2026. Past performance (whether actual or simulated) is not an indicator of future performance. Provided for illustrative purposes only – not a recommendation to invest or adopt any investment strategy.
Even seasoned professionals cannot consistently pick market tops and bottoms, says Matthew Fish, Head of Product at Betashares Direct.
“Attempting to do so adds unnecessary pressure and risk that is not conducive to sound investment decision making. It helps investors remove emotion from decision making and stay aligned with their long-term plan, even during volatile periods.”
Betashares Direct’s auto-invest feature allows you to set up recurring investments into up to five Betashares ETFs brokerage-free, making it simple to automate a dollar cost averaging investing strategy.
Refer to the Betashares Invest PDS for information on interest retained by Betashares on cash balances.
Betashares Direct
Invest in all ASX ETFs, and 400+ ASX-traded shares brokerage free. Automated investing. Low-cost managed portfolios. Create your account in minutes.