
If inflation stays higher, what may it mean for returns?

Matthew Reeves
4 minutes reading time
Related articles


Better investing starts here
Get Betashares Direct
Betashares Direct is the new investing platform designed to help you build wealth, your way.
Scan the code to download.
Learn more
Learn more
Australian ETF Industry blasts past $280 billion in assets, $300 billion in sight
- The Australian ETF industry ended the financial year on another record high, reaching $280 billion in total assets under management after recording robust growth for the half year – as a result, $300 billion is firmly in sight for the industry.
- FUM: The Australian ETF industry increased in size by 9% for the half, recording total growth of $34.2B to end the financial year at $280.5B, a new all-time industry record.
- Net Flows: ETF industry flows were very strong over the half, with net new money sitting at $21.6B, nearly double the $11B of net flows received in the first half of 2024.
- Trading: ETF trading values were robust for the half – 58% higher than the first half of 2024, showing increased usage of the investment vehicle.
- Issuer Flows: Vanguard received the highest net flows in the first half, with $7.1 Flow concentration by issuer remains elevated, with the top 3 issuers (Betashares, Vanguard and iShares) receiving 73.75% of the industry flows for the half.
- Product launches: Product development activity was elevated this half, with 36 new products This included 3 new issuers entering the market.
- Flows by Product Type: Index funds took the lion share of ETF flows for the half receiving $17B, flows to Smart Beta ETFs were also relatively strong with $2.8B while Active funds received $1.9B.
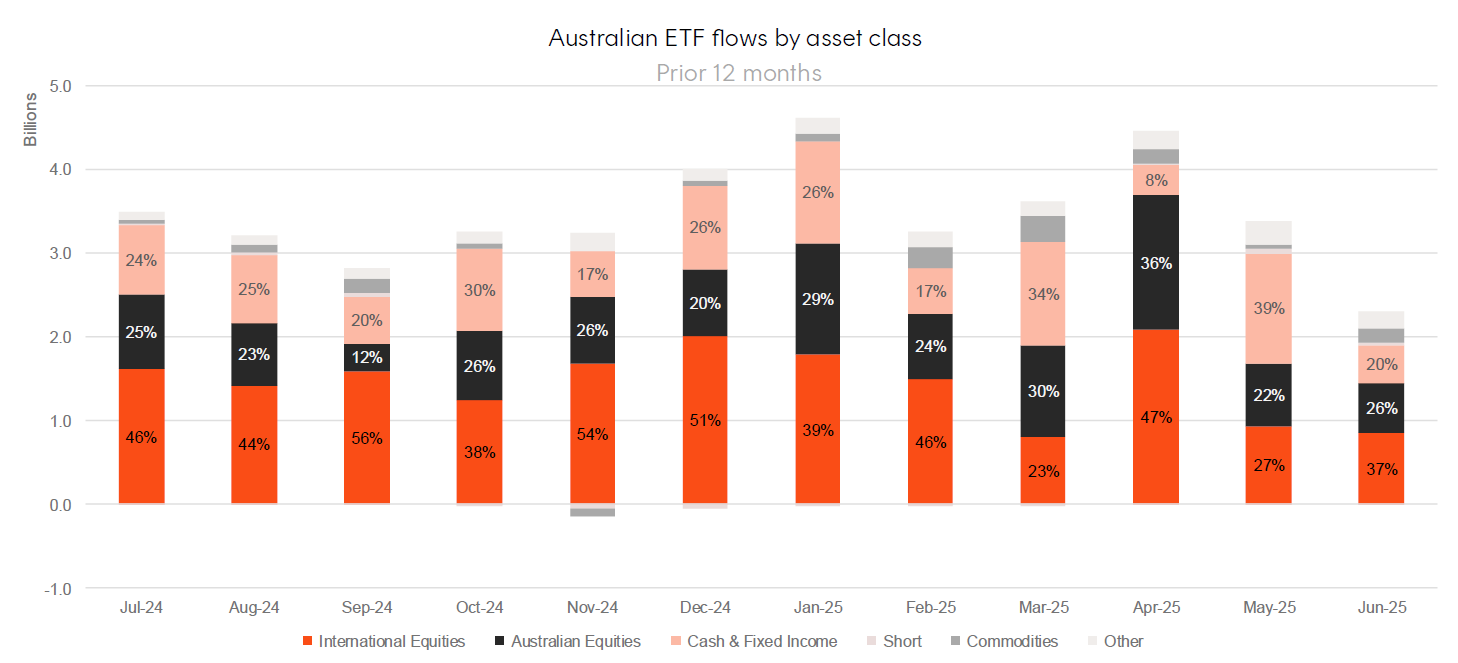
- Flows by Category: International and Australian Equities dominated flows, after receiving $8B and $6.2B in net flows respectively, with Fixed Income receiving a very strong $4.4B also.
- International Equities exposures received $8B of inflows
- Australian Equities exposures received $6.2B of inflows
- Fixed Income exposures recorded $4.4B of inflows
- No outflows on a category level were recorded over the
- Performance: In recognition of the unique circumstances facing markets, Defence and Gold Miner ETFs were the top performers over the half.
- Industry Forecast: At the end of 2024, we forecast the ETF industry to end 2025 in excess of $300B – we continue to hold conviction that the industry will pass this milestone before the end of the year.
Market Size and Growth: June 2025
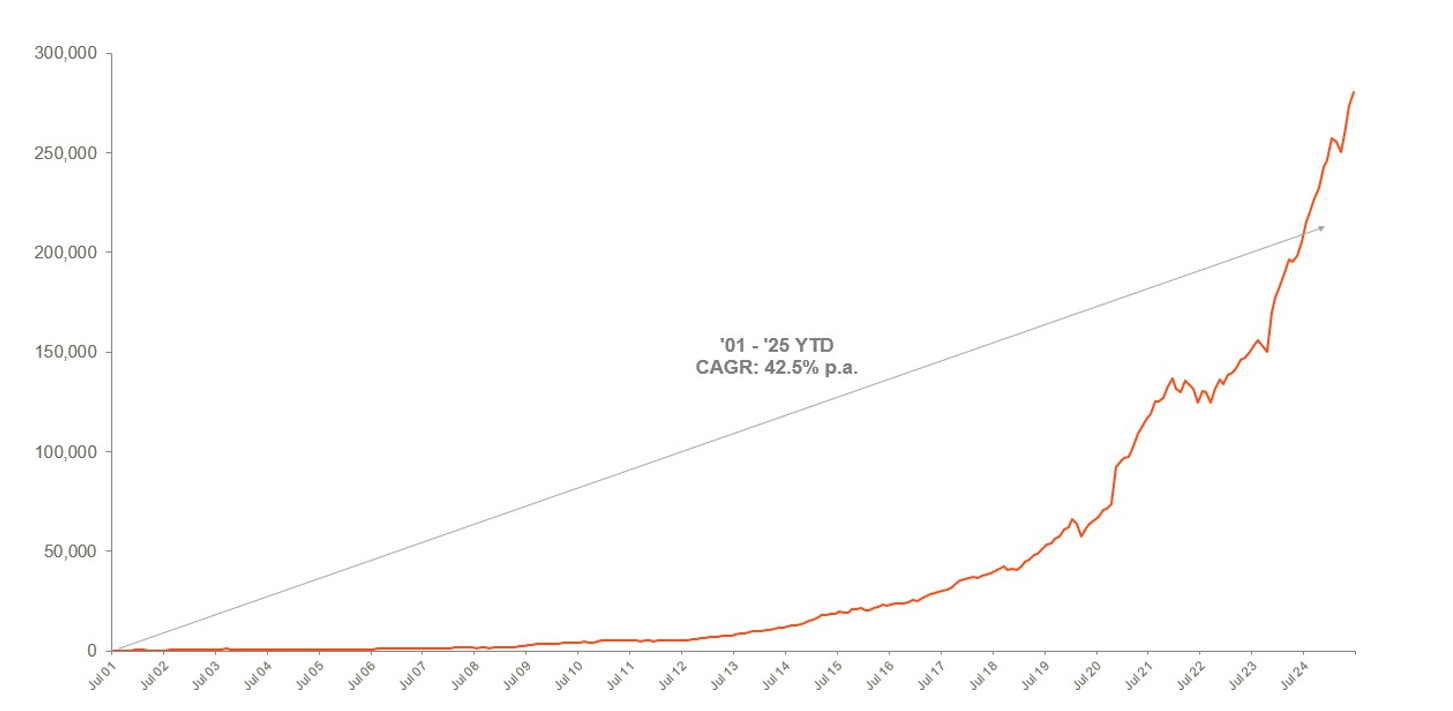
CAGR: Compound Annual Growth Rate. Source: ASX, CBOE
Market Cap
- Australian Exchange Traded Funds Market Cap (ASX + CBOE): $280.5B – new all time high
- ASX CHESS Market Cap: $238.3B1
- Market Cap increase for the half: 9.0%, $34.2B
- Market cap growth for last 12 months: 30.1%, $75.2B
Net Flows
- Net flows for the Half Year: $21.6B
New Products
- 427 Exchange Traded Products trading on the ASX & CBOE
- New/closed products: 36 new products launched in the half year, 10 products closed.
- 3 new issuers joined the market
- There are currently 59 issuers of ETFs in Australia
Trading Value
- Trading value for this half was 58% higher than the first half of 2024
Performance
- In recognition of the unique circumstances facing markets, Defence and Gold Miner ETFs were the top performers over the half.
Industry Net Flows
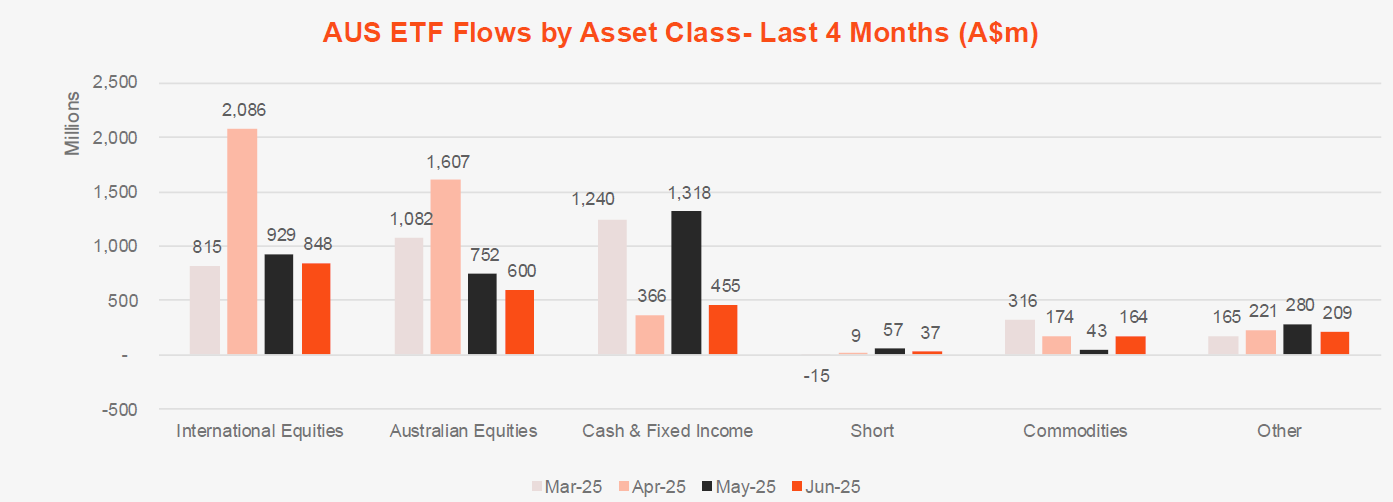
Top Category Inflows (by $) – Month
| Broad Category | Inflow Value |
|---|---|
| International Equities | $847,916,395 |
| Fixed Income | $768,568,002 |
| Australian Equities | $600,075,026 |
| Commodities | $164,432,769 |
| Multi-Asset | $85,643,655 |
Top Sub-Category Inflows (by $) – Month
| Sub-Category | Inflow Value |
|---|---|
| Australian Bonds | $621,595,983 |
| Australian Equities – Broad | $448,732,376 |
| International Equities – Developed World | $400,350,448 |
| International Equities – Sector | $265,569,737 |
| Global Bonds | $223,054,776 |
Top Category Outflows (by $) – Month
| Broad Category | Inflow Value |
|---|---|
| Cash | -$313,138,692 |
Top Sub-Category Outflows (by $) – Month
| Sub-Category | Inflow Value |
|---|---|
| Cash | -$313,138,692 |
| Fixed Income – E&R – ESG Lite | -$60,946,557 |
| International Equities – Europe | -$60,282,468 |
| International Equities – E&R – Ethical | -$34,260,418 |
| Australian Equities – Large Cap | -$16,216,789 |
Performance
Top Performing Products – Month
| Ticker | Product Name | Performance (%) |
|---|---|---|
| ETPMPT | Global X Physical Platinum | 23.73% |
| ATOM | Global X Uranium ETF | 18.78% |
| URNM | Betashares Global Uranium ETF | 16.02% |
| IKO | iShares MSCI South Korea Capped Index ETF | 15.79% |
| ETPMPD | Global X Physical Palladium | 15.47% |