
Annabelle Dickson
7 minutes reading time
Australian companies are well known for their skills in digging up minerals, writing home loans, and selling groceries. But unfortunately for Australian investors, innovative companies are not well represented on our stock market.
Given Australians’ propensity to invest locally, often to collect franking credits, this can result in poorly diversified portfolios that are overexposed to banks and resources.
Thankfully, the wide range of ETFs available on the ASX today make it much easier for Australian investors to access global markets.
The NASDAQ-100 is one of the world’s leading equity indices, offering exposure a range of innovative companies at the forefront of the new economy. Betashares NDQ Nasdaq 100 ETF is the only ETF listed on the ASX offering exposure to this index.
Here are a few factors to consider about the NASDAQ-100
Australians’ focus is too close to home
Australians love investing in Australia. With the ASX offering access to familiar companies, the potential for franking credits, and convenient trading hours, it’s easy to see why. But the Australian sharemarket makes up just 2% of global sharemarkets, and Australians allocate nearly half their share investments to the Australian market!
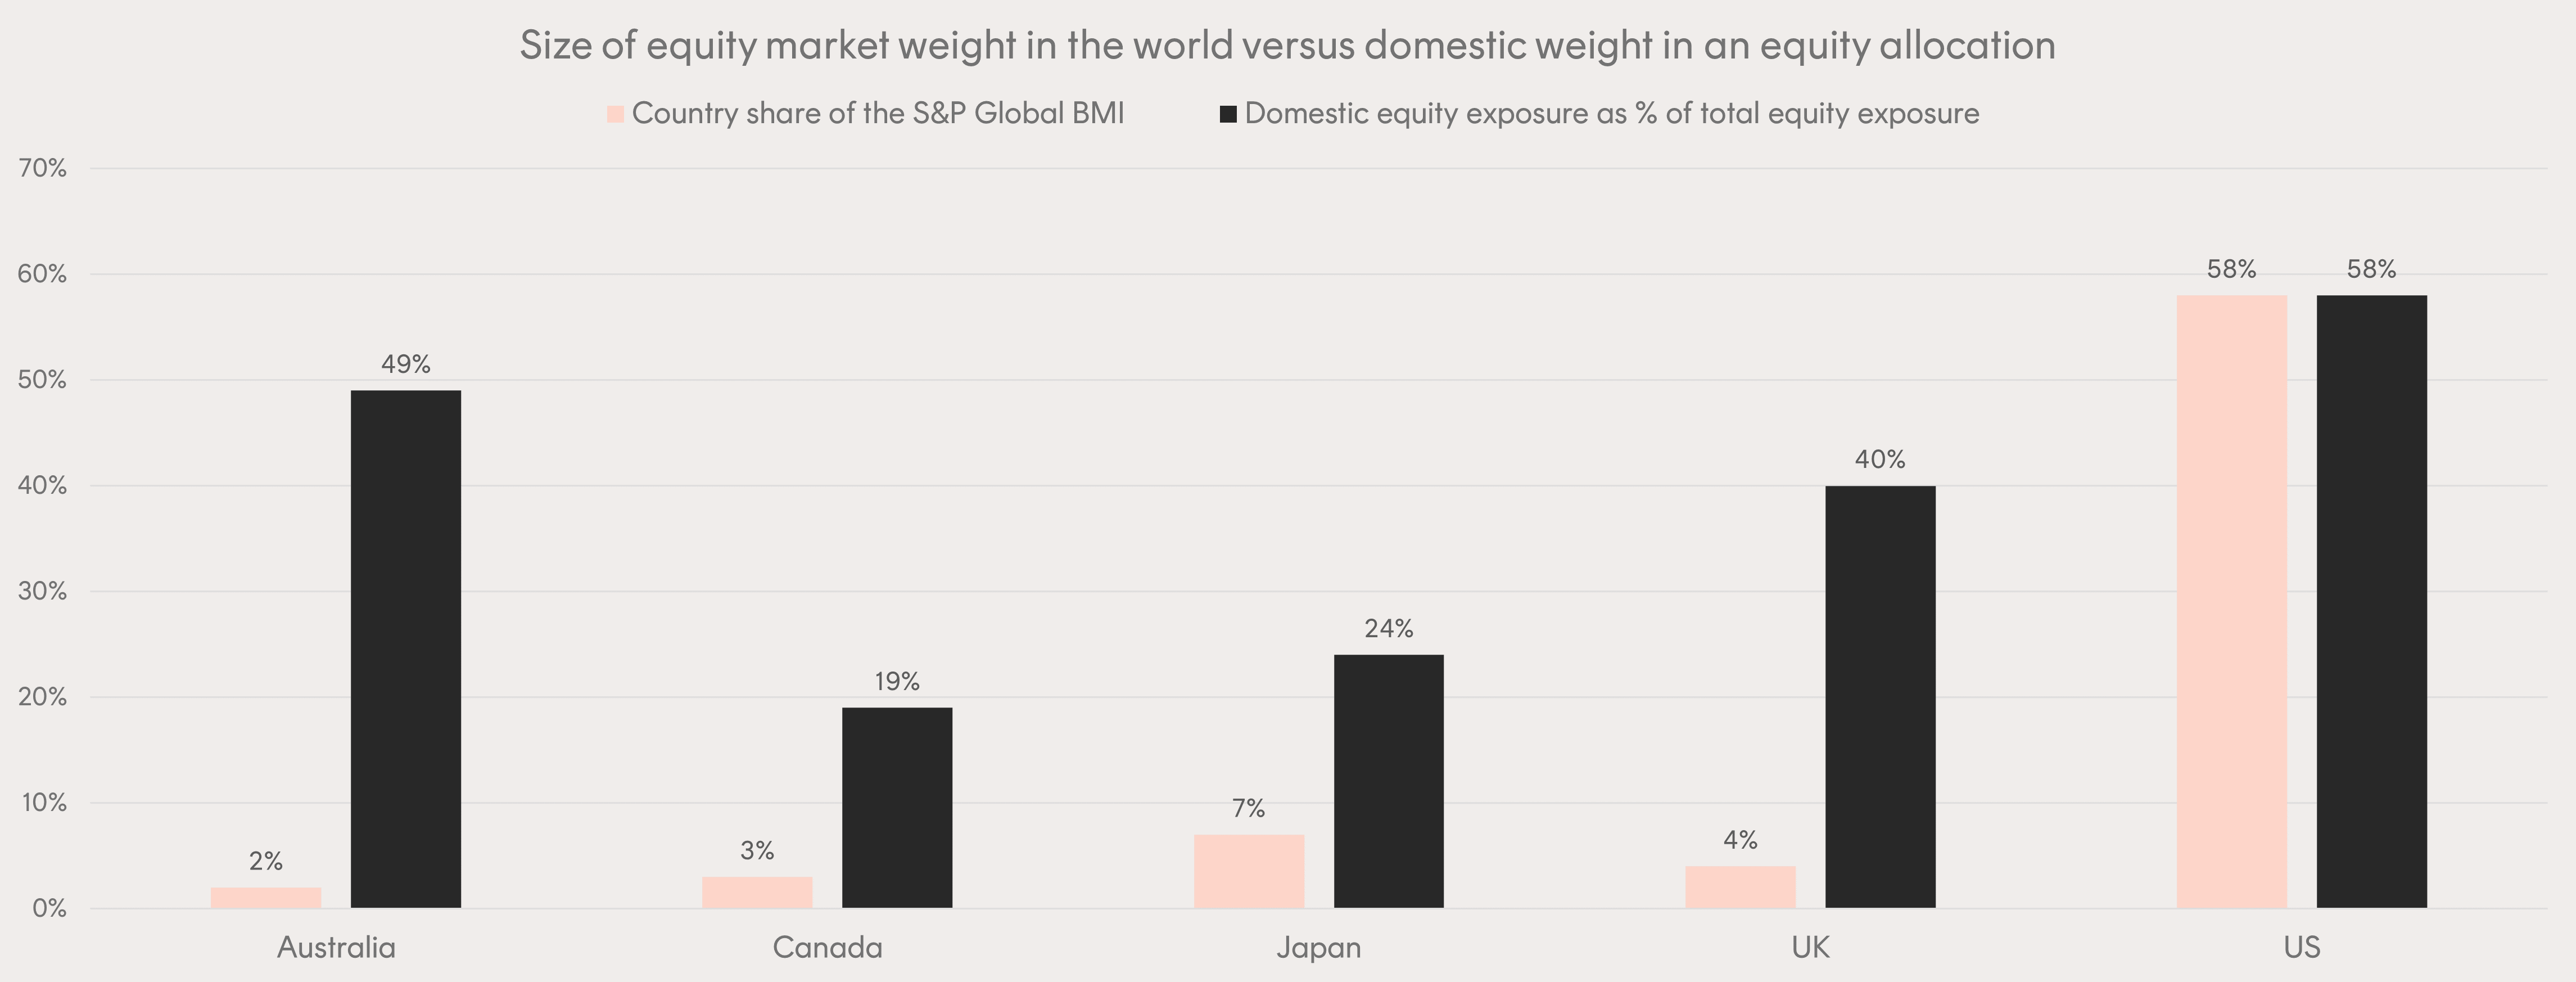
Source: S&P Dow Jones Indices, Global Pension Assets Study (GPAS) 2023. As at 31 December 2022. Chart is for illustrative purposes only.
What’s wrong with that, you might ask? Well, the Australian market is highly concentrated in financials and materials, which make up more than half the sector allocations. It also offers minimal exposure to technology, at less than 3% of the S&P/ASX 200 Index.
Sector comparison between NASDAQ-100, S&P/ASX 200, and global shares
| SECTOR | NASDAQ-100 | S&P/ASX 200 | GLOBAL SHARES |
| Communication Services | 15.7% | 4.1% | 7.2% |
| Consumer Discretionary | 13.8% | 6.5% | 11.1% |
| Consumer Staples | 6.6% | 4.7% | 7.3% |
| Energy | 0.5% | 5.6% | 4.7% |
| Financials | 0.7% | 28.4% | 14.9% |
| Healthcare | 6.9% | 9.3% | 12.5% |
| Industrials | 5.1% | 7.1% | 11.0% |
| Information Technology | 49.4% | 2.4% | 22.1% |
| Materials | 0.0% | 24.2% | 4.2% |
| Real Estate | 0.0% | 6.2% | 2.4% |
| Utilities | 1.2% | 1.5% | 2.7% |
Source: Bloomberg. Technology sector includes GICS sector “Information Technology” plus for Nasdaq-100 includes GICS Industry “Internet & Catalog Retail”; for S&P/ASX 200 includes Seek Ltd, REA Ltd, Trade Me Ltd & Ozforex Group.
The NASDAQ-100 on the other hand, has less than 1% exposure to materials and financials, and nearly 50% exposure to technology.
NDQ can be used within Australian-focused portfolios, providing diversification benefits and helping to even out the sector exposures.
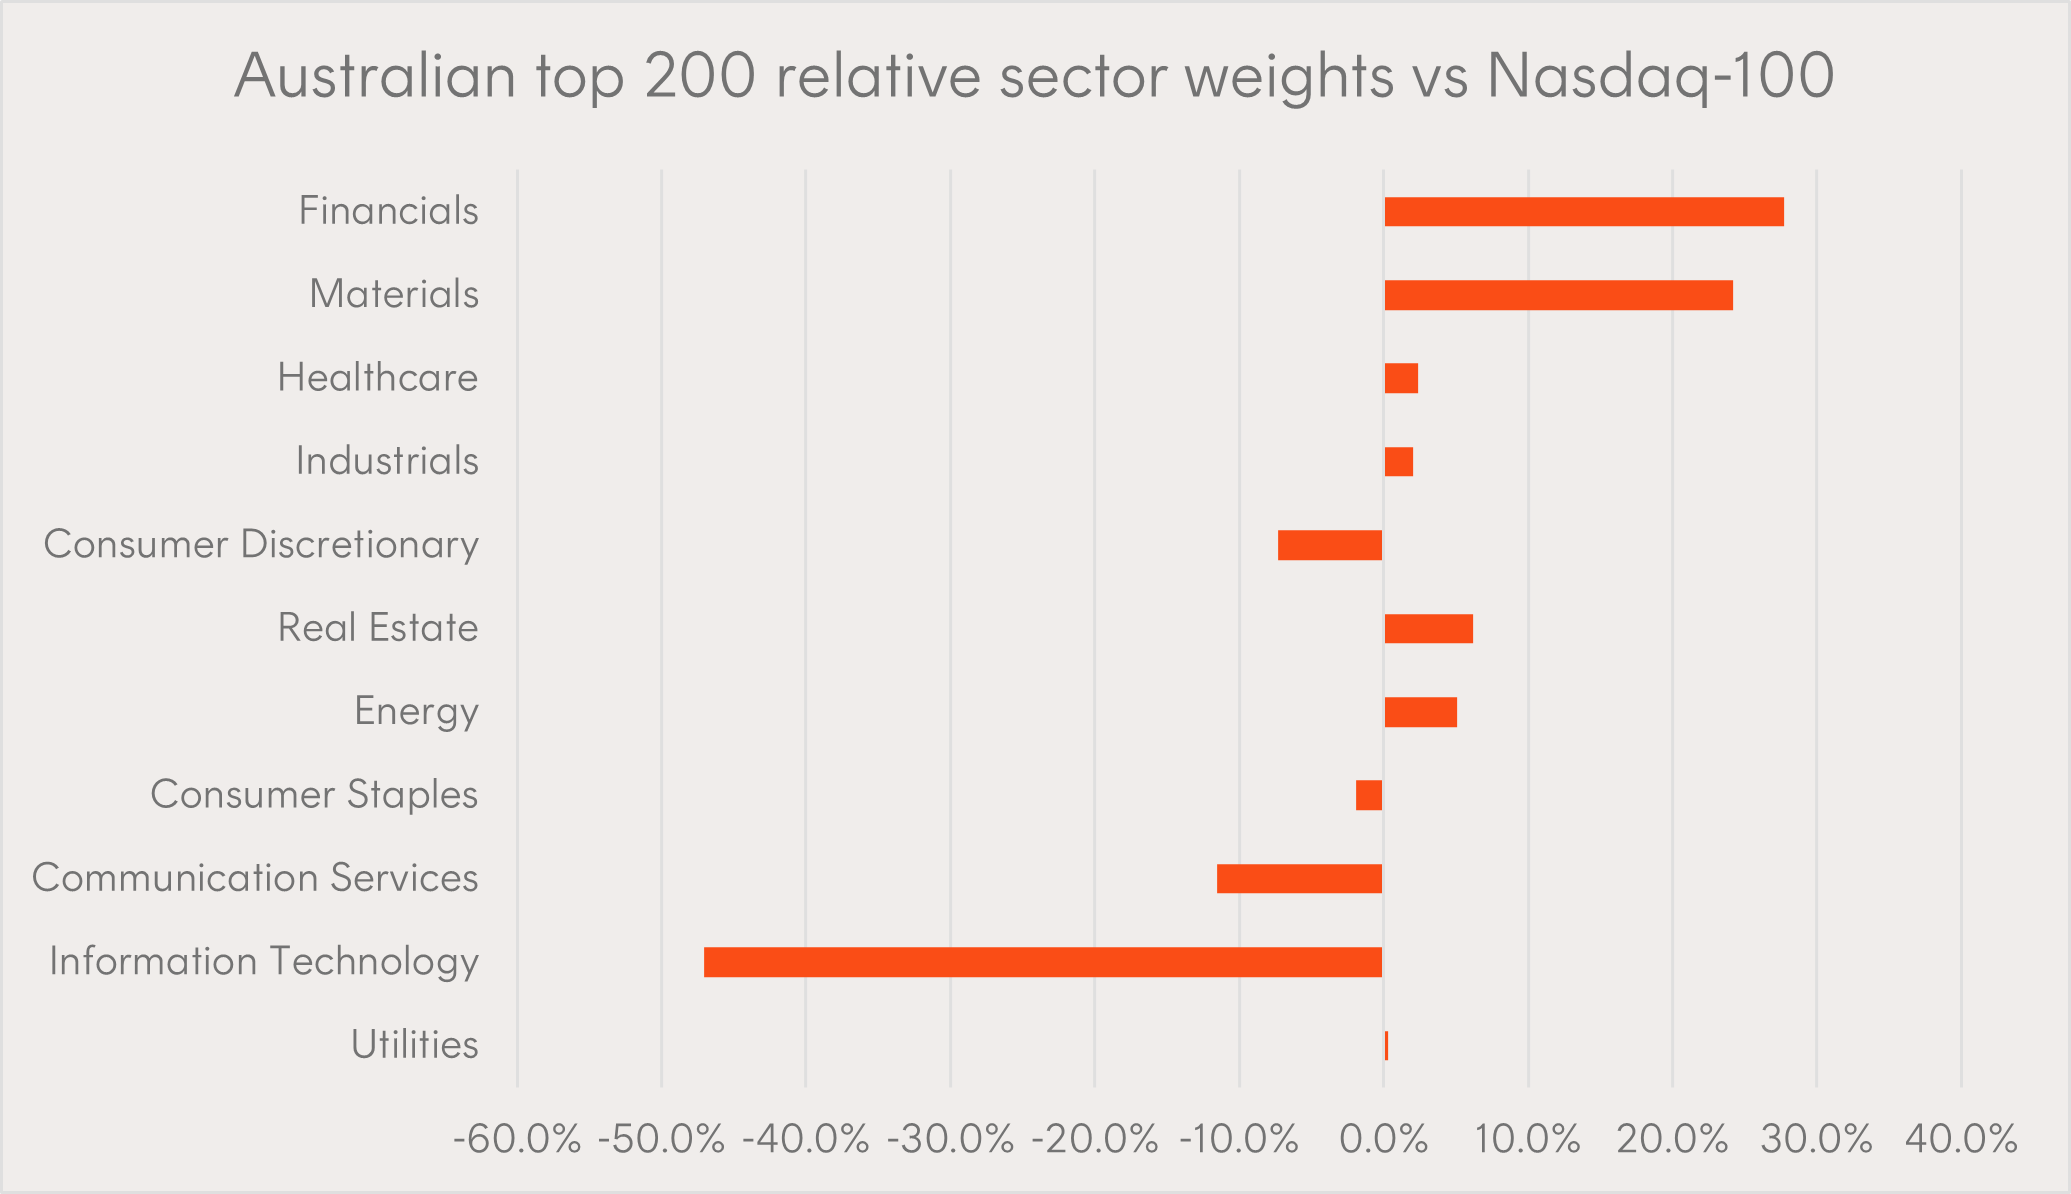
Source: Bloomberg. As at 31 July 2023. Australia top 200 represented by Solactive Australia 200 Index.
Long term growth at a reasonable price
Companies in the NASDAQ-100 Index have grown their earnings by 15.5% p.a. over the last 20 years. This exceeded the S&P 500, which has seen earnings growth of 8.1% p.a. over the same period. Companies are generally valued based on their expected future earnings, so those that can grow over time normally become more valuable.
NASDAQ-100 v S&P 500 Index Earnings (Indexed to 100, 2003)
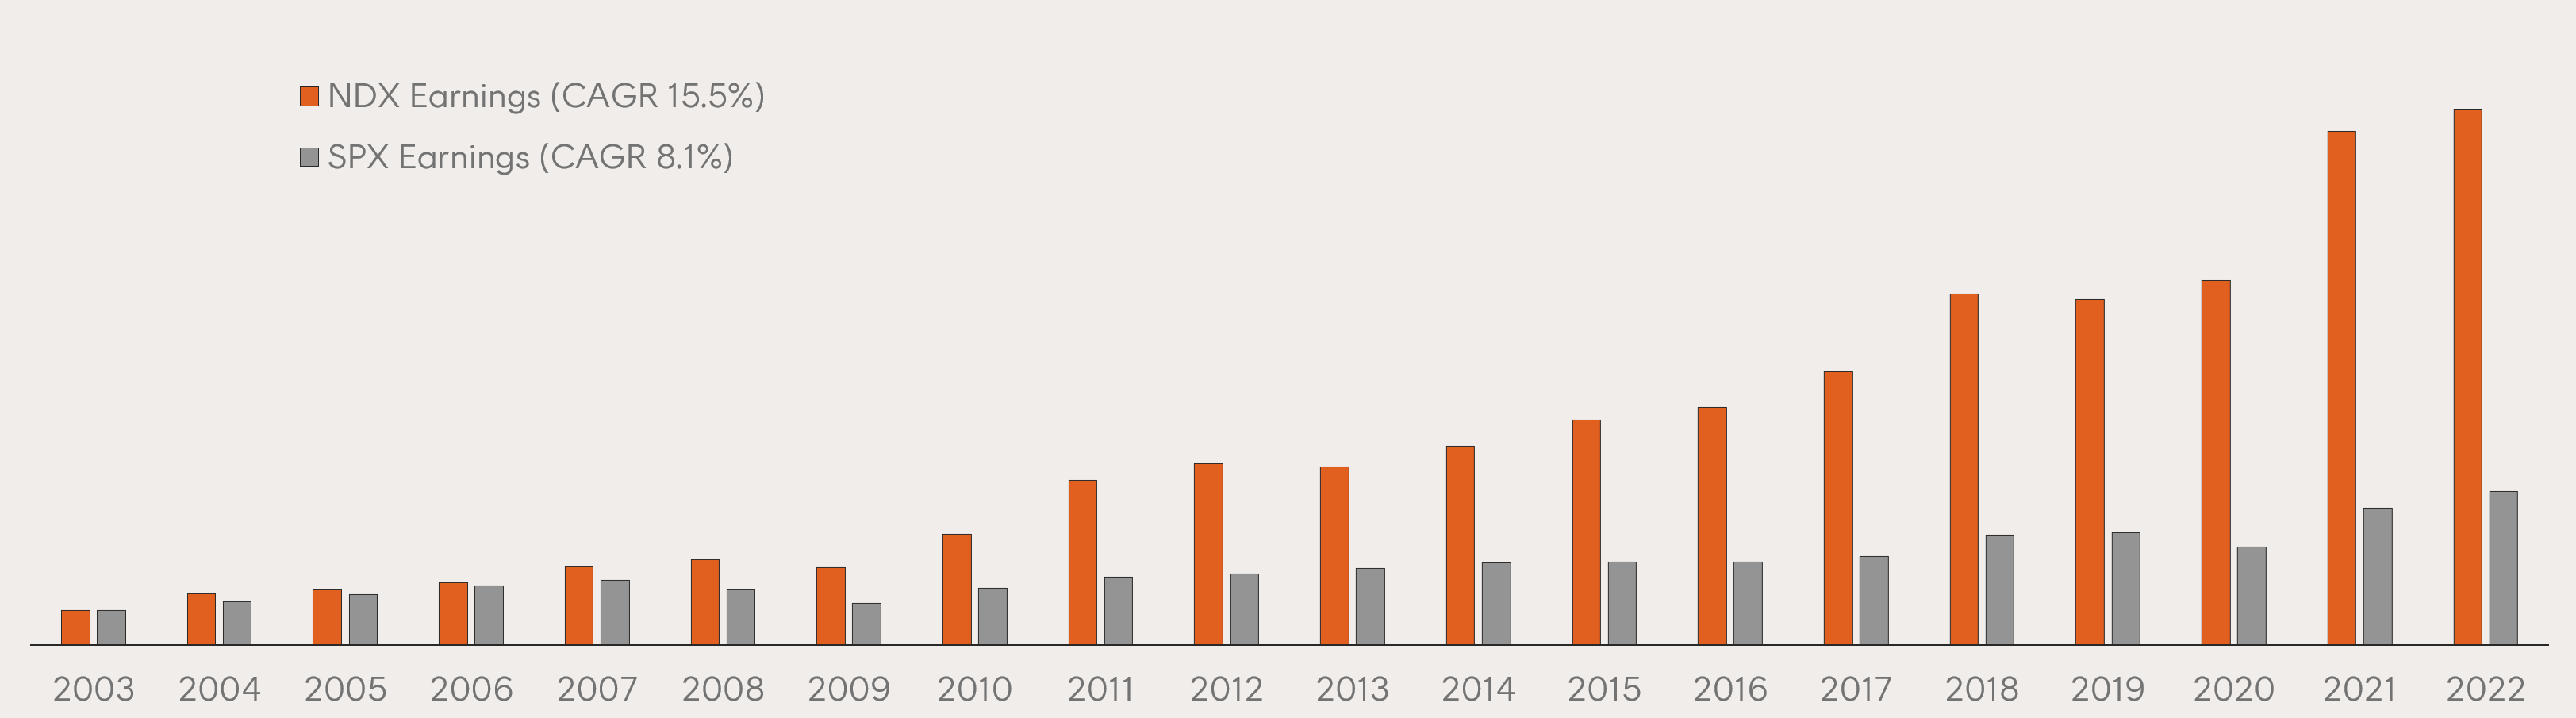
Source: Nasdaq. Past performance is not an indicator of future performance.
The price-to-earnings ratio, or P/E ratio, is a widely used metric that can be used to estimate how ‘cheap’ or ‘expensive’ a share or sharemarket is. “Stocks are too expensive” is a common narrative that appears when sharemarkets rise significantly in a short period.
You might be surprised to learn then, that the P/E ratio for the NASDAQ-100 Index is fairly close to its long-term average, despite the strong recent performance.
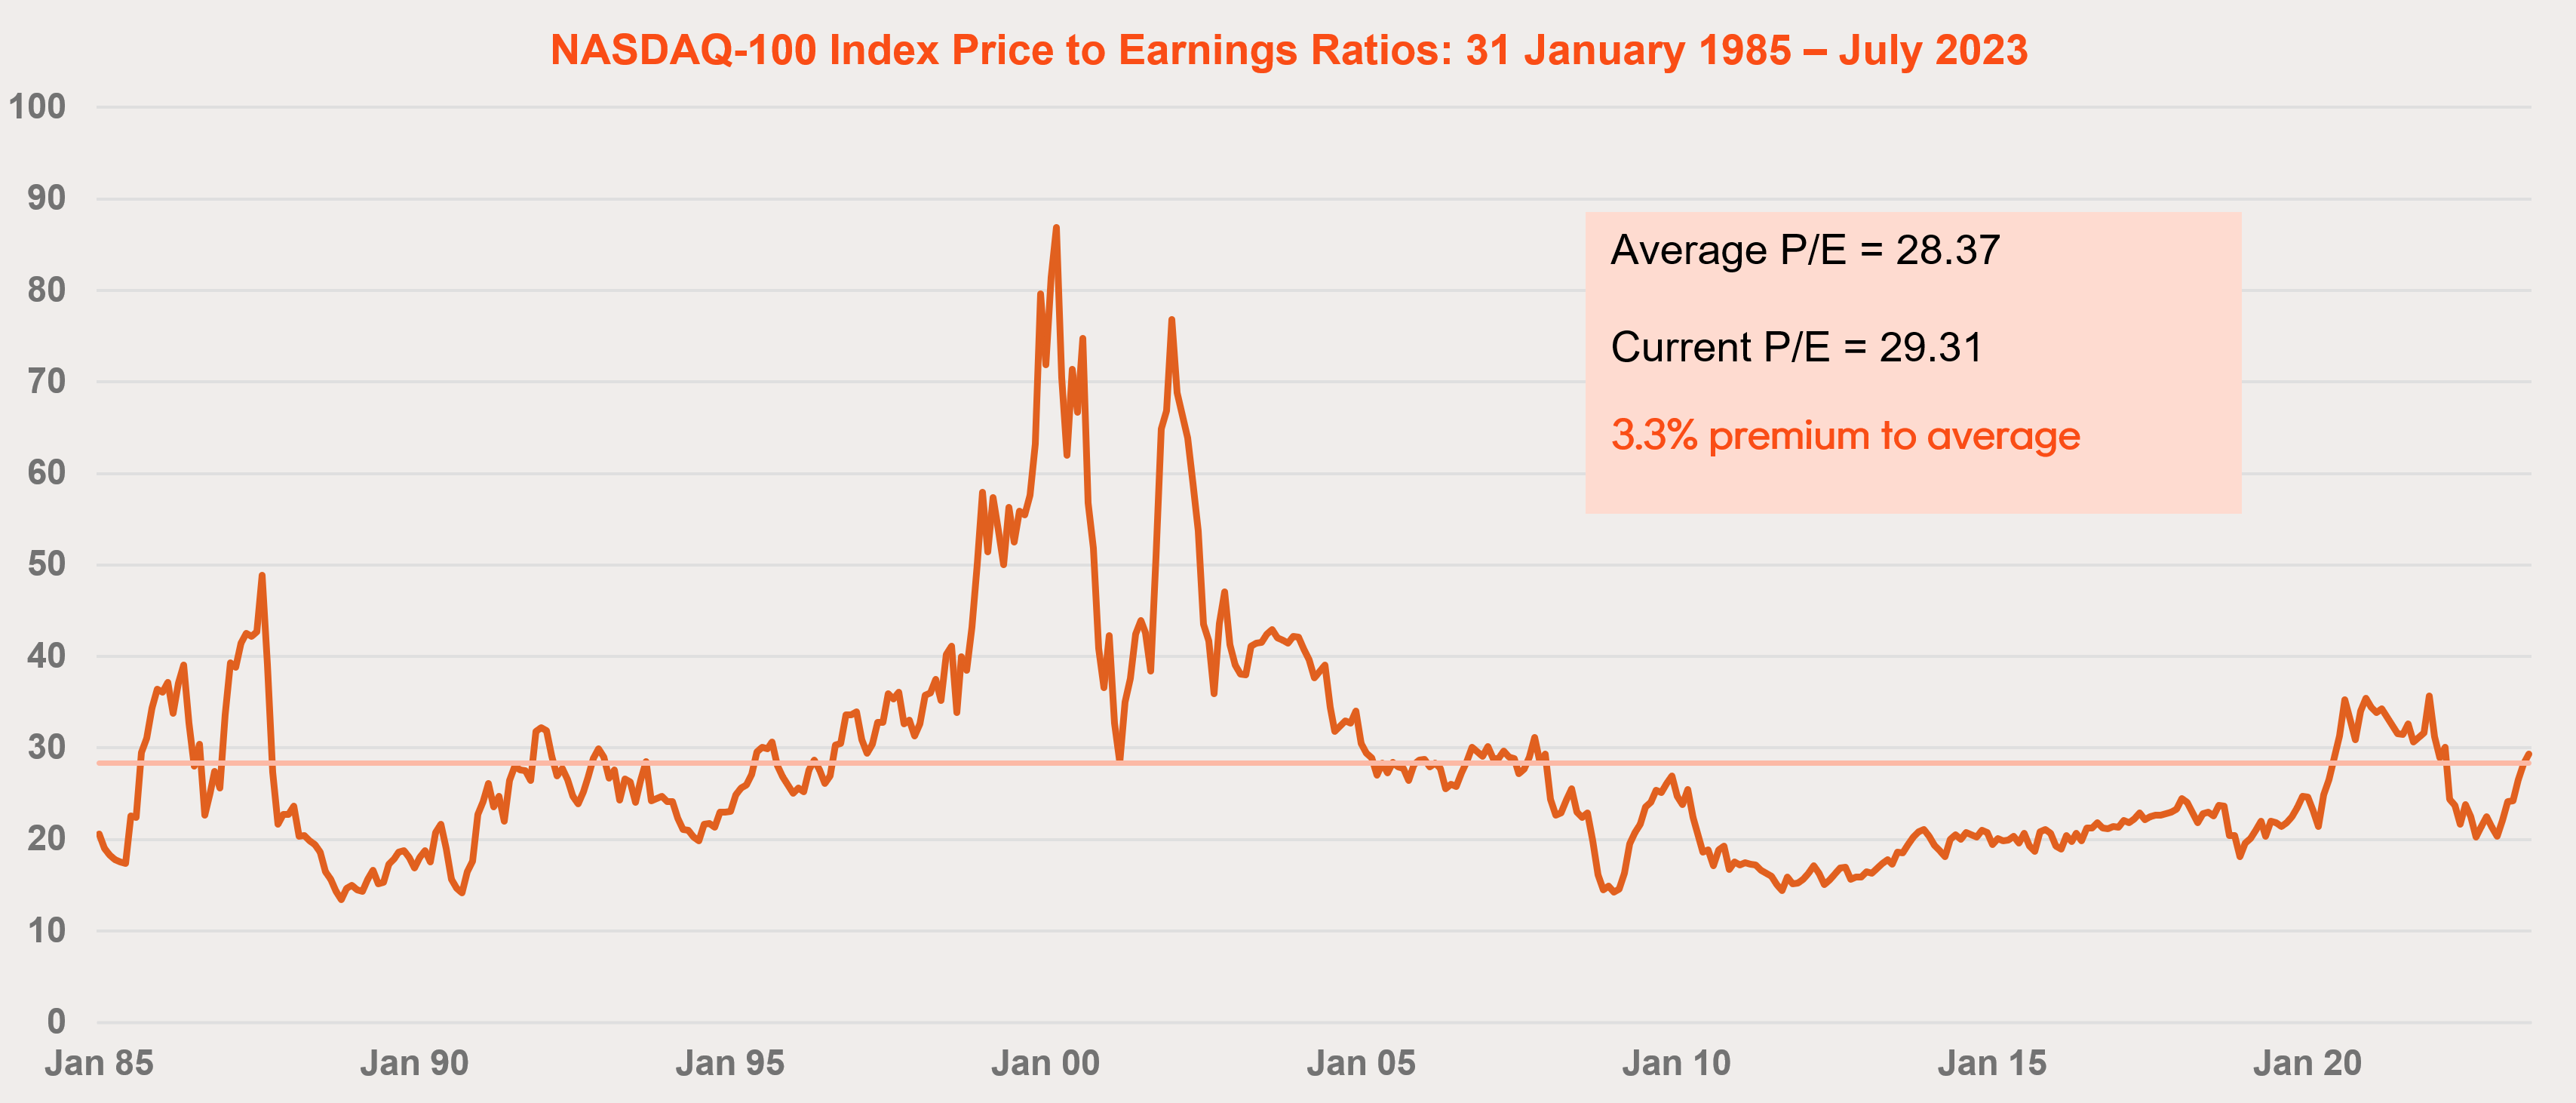
Source: Bloomberg, Thomson Reuters. Past performance is not an indicator of future performance. As at 31 July 2023.
Real businesses, not just hype
In the aftermath of the late 90s tech bubble, it became clear that many of the companies that had been hyped up were just that – hype. But the big tech stocks that dominate the NASDAQ-100 today operate very real, highly valuable businesses.
One of the most talked about companies in the world this year has been Nvidia. Nvidia’s Graphics Processing Units (GPUs) are used in gaming computers, self-driving cars, and in data centres, which power AI models like ChatGPT and Midjourney. The last sector has seen enormous growth in 2023, helping to propel Nvidia to an incredible 843% profit increase in the second quarter of 2024 compared to a year earlier.
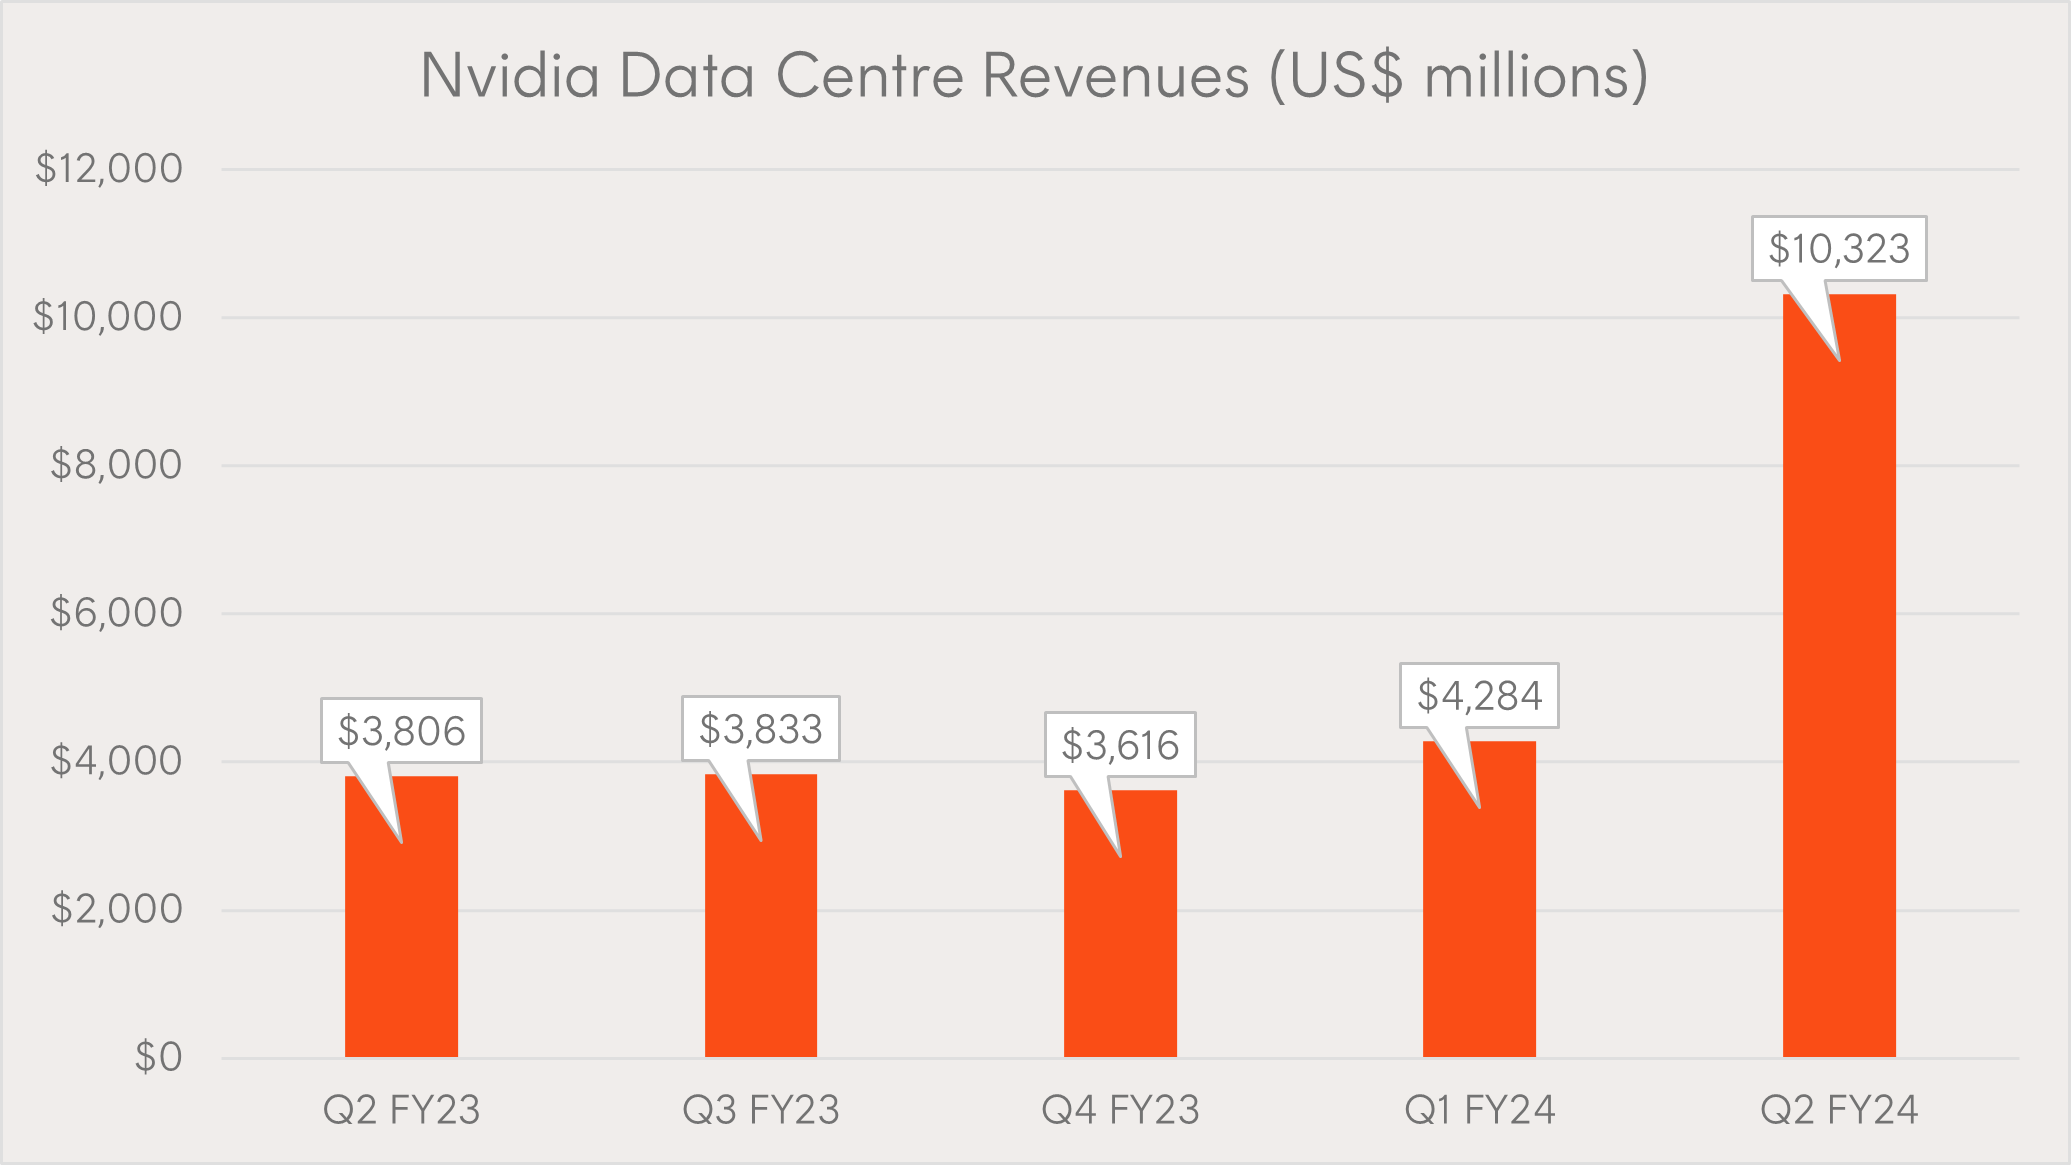
Source: Nvidia.
While AI is helping people be more productive and create artworks that they’d never have been able to previously, it’s also increasingly being used to assist in sophisticated scams and cyberattacks. This, in turn, is driving demand for cybersecurity products and services. Microsoft is probably most well-known for its Office products, however, it also offers sophisticated cybersecurity products such as Microsoft Defender. The NASDAQ-100 also features ‘pure play’ cybersecurity companies such as Palo Alto Networks, CrowdStrike, and Fortinet.
Many other companies in the NASDAQ-100 are integrated into our everyday lives – you might be reading this article on your iPhone or MacBook, or dreaming of buying one of Apple’s new VisionPro headsets next year. There’s a good chance you’ve checked your WhatsApp, Instagram, or Facebook account today – all of which are owned by Meta. Perhaps you’ll watch a movie or series on Netflix tonight. Apple, Meta, and Netflix all feature in the NASDAQ-100.
It’s not just tech companies either. The NASDAQ-100 features leading consumer companies including Pepsico, Costco, and Starbucks.
Picking stocks is hard
Professional equity analysts often spend up to six years studying in order to learn their skills, and many more refining them. They can spend days analysing a single company, trawling through annual reports and research, before issuing a recommendation.
Despite all this work, research from S&P Dow Jones Indices shows that more than 90 per cent of all large-cap funds in the US underperformed the S&P 500 after fees over the 15 years to the end of 20222.
Part of the challenge is that just 2.4% of all firms accounted for all the net global stock market wealth creation between 1990 and December 2020. Given stock pickers a roughly 1 in 40 chance of picking of these rare winners. Not just that, but more than half of all firms underperformed one-month US Treasury bills3– widely considered to be one of the lowest risk assets in the world.
Simple and cost-effective exposure to the ‘new economy’
In a single trade on the ASX, Betashares NDQ Nasdaq 100 ETF offers exposure to companies that change the way we live. NDQ has a strong focus on technology, providing diversified exposure to an under-represented sector on the Australian sharemarket, with the potential for high growth.
There are risks associated with an investment in NDQ including market risk, country risk, currency risk and sector risk. Investment value can go up and down. For more information on risks and other feature of NDQ please see the Product Disclosure Statement (PDS) and Target Market Determination (TMD), both available at www.betashares.com.au.
Buy ETFs effortlessly with Betashares Direct
Betashares Direct is the new investing platform designed to help you build wealth, your way. Access
NDQ
Nasdaq 100 ETF
through Betashares Direct, along with the 340+ other ETFs that trade on the ASX.
Betashares Direct
Invest in all ASX ETFs, and 500+ ASX-traded shares brokerage free. Automated investing. Low-cost managed portfolios. Create your account in minutes.
References:
1. To 31 July 2023. Past performance is not an indicator of future performance.
2. Source: SPIVA Scorecard
3. Source: Long-Term Shareholder Returns: Evidence from 64,000 Global Stocks
4 comments on this
NDQ is actually my most profitable ETF (I’ve got 4 different ones).
Thanks for this. Is there much difference between NDQ and QMAX?
Hi Gye,
QMAX writes covered call options options over the index, aiming to provide regular income along with exposure to a portfolio of the top 100 companies listed on the Nasdaq stock market. For more information on covered calls, you can read this article: https://www.betashares.com.au/insights/enhance-yield-from-shares/
Or for specific information on QMAX, please consult the QMAX fund page: https://www.betashares.com.au/fund/nasdaq-yield-maximiser-fund/
Regards,
Patrick
Thank you Patrick