


ASX: ROYL – Differentiated source of income and diversification
The traditional 60/40 portfolio of stocks and bonds has long served as a foundation for portfolio construction. Developed as a practical application of ‘Modern Portfolio Theory’, it has become a hallmark of the disinflationary era that’s characterised the last four decades while generating some solid returns for investors.
But in a world driven by aggressive monetary policy, higher inflation and rising geopolitical tensions, the historical correlation between stocks and bonds has marched structurally higher following the onset of Covid and the inflation shock of 2022.
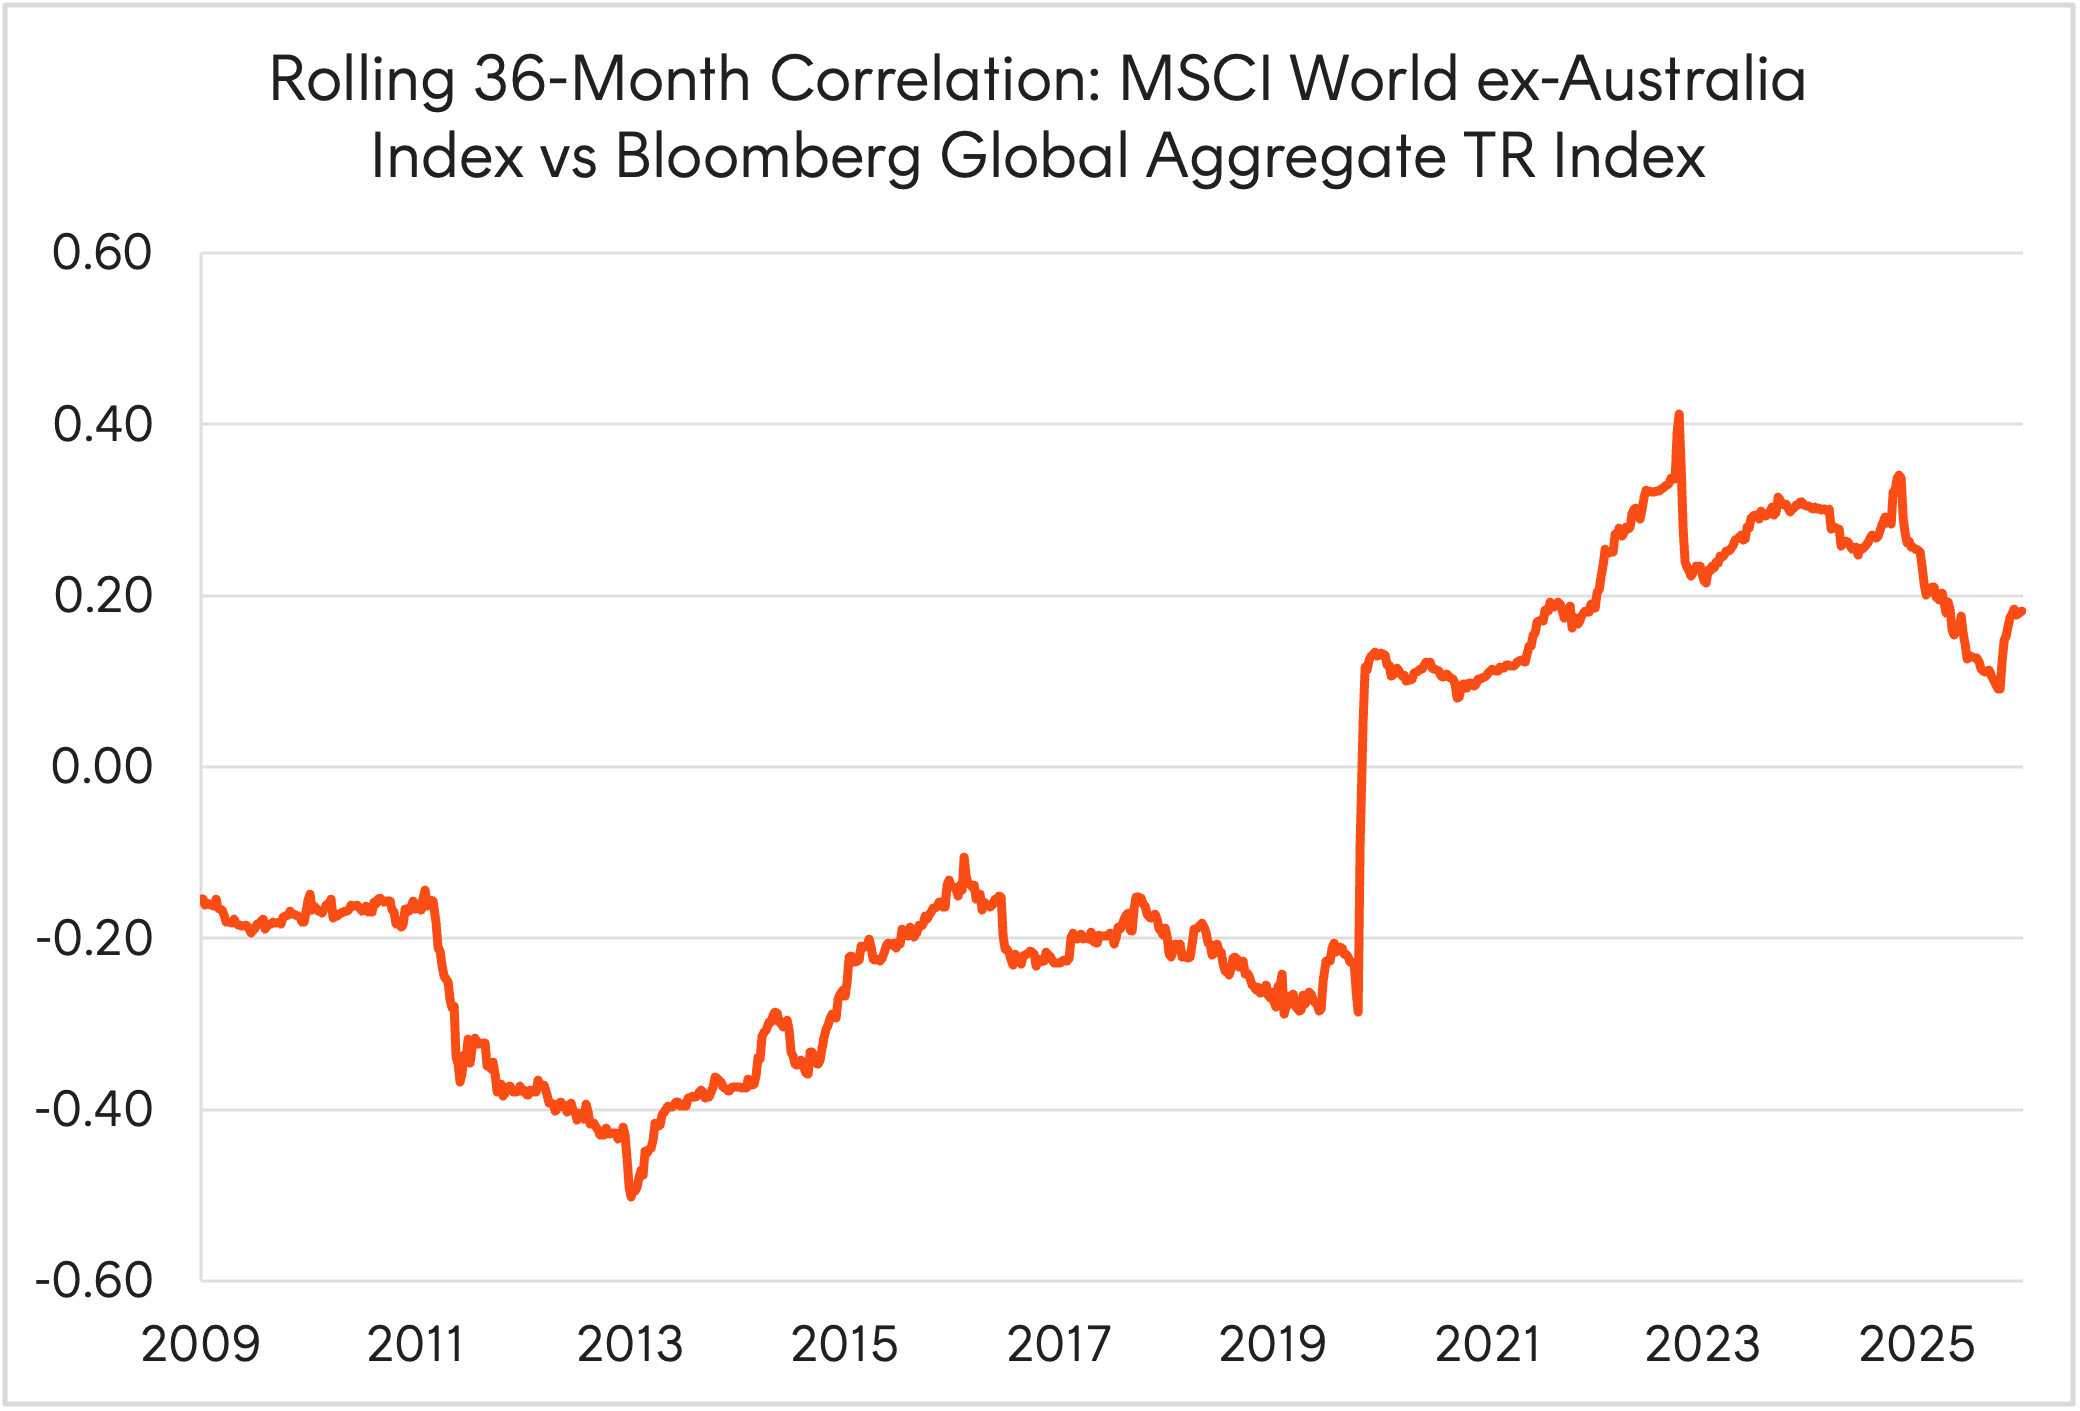
Source: Bloomberg. As at 15 May 2026. Weekly series. In Australian dollars. Past performance is not indicative of future performance. View enlarged chart
In that year, global policy rates shot up rapidly to tame inflationary pressures from supply chain disruptions. Global equities declined, with the MSCI All Country World Index down 18% in US dollar terms.
Typically, during periods of equity market weakness, bonds rally and provide offsetting positive returns as weak equity performance is usually associated with muted economic growth. However, the Bloomberg Global Aggregate Bond Index (in $A hedged terms) was down 12.3% as well in 2022.
That’s not to say there isn’t any value to the 60/40 portfolio. In fact, our analysis of stock and bond returns since 1907 show bonds typically provide positive diversification benefits to stocks – with the former generating positive returns in 31 of the 34 years when equities suffered negative returns.
While 2022 was one of those three exceptional years where both stocks and bonds fell, investors are looking for smarter alternatives which can provide genuine diversification benefits to the traditional 60/40 portfolio.
Unlisted opportunities ranging from private credit, infrastructure, hedge funds and real estate are potential options, however they often require high minimum investment requirements and lock-up periods which tie up your capital.
Instead, ‘liquid alternatives’ have emerged as a solution to this, providing investors access to non-traditional asset classes such as commodities, cryptocurrencies, infrastructure and more through a liquid ETF wrapper.
A liquid alternative: Global royalty companies (ASX: ROYL)
One liquid alternative option that investors may not have heard of are global royalties.
The Betashares ROYL Global Royalties ETF is the world’s first ETF strategy providing investors access to royalty companies which have typically displayed both strong and lower correlated returns to traditional portfolio building blocks.
Rather than producing goods or services themselves, they earn income by owning rights to future revenue streams from a diverse range of sectors, including royalties from resource extraction, pharmaceuticals, or intellectual property licensing.
These are typically sectors that are underrepresented in traditional market-capitalisation weighted global indices which are currently dominated by US technology companies.
The following table are ROYL’s top 10 holdings as of 22 May 2026, highlighting the unique opportunity set of global royalty companies.
| Company | Sector | Subsector |
|---|---|---|
| ARM Holdings | Information Technology | Semiconductors |
| Wheaton Precious Metals | Materials | Gold |
| Texas Pacific Land | Energy | Oil & Gas Exploration & Production |
| Franco-Nevada | Materials | Gold |
| Universal Music Group | Communication Services | Movies & Entertainment |
| Royalty Pharma | Healthcare | Pharmaceuticals |
| Royal Gold | Materials | Gold |
| Genmab A/S | Healthcare | Biotechnology |
| Shionogi & Co | Healthcare | Pharmaceuticals |
| Halozyme Therapeutics | Healthcare | Biotechnology |
Source: Betashares. As at 22 May 2026.
How has ROYL performed this year?
ROYL has returned ~12% total returns this year while global stocks ex Australia and bonds were more muted, demonstrating precisely the kind of resilience that global royalty companies can bring to a traditional 60/40 portfolio.
Equity markets were whipsawed early in the year by Trump’s Greenland tariff threats and geopolitical disruptions, while bonds continue to face pressure from higher policy rates as the oil supply shock feeds through into stickier inflation dynamics.
ROYL’s constituents remain well positioned in today’s environment. Key contributors to ROYL’s year to date performance include:
- Gold exposures – Wheaton Precious Metals, Franco-Nevada and Royal Gold – have benefited earlier in the year from gold’s strong run, with the precious metal surging over 40% in the past 12 months to an all-time high above US$5,500/oz in January amid heightened geopolitical tensions and persistent central bank buying.
- Texas Pacific Land is up over 30% year-to-date after posting record quarterly revenue in Q1 2026 driven by royalty income and fees from major energy operators across its vast Permian Basin land holdings.
- More recently, ARM Holdings (currently ROYL’s largest holding) has surged to an all-time high following the announcement of its first proprietary data centre chip designed for agentic AI workloads, attracting over US$2 billion in committed orders.
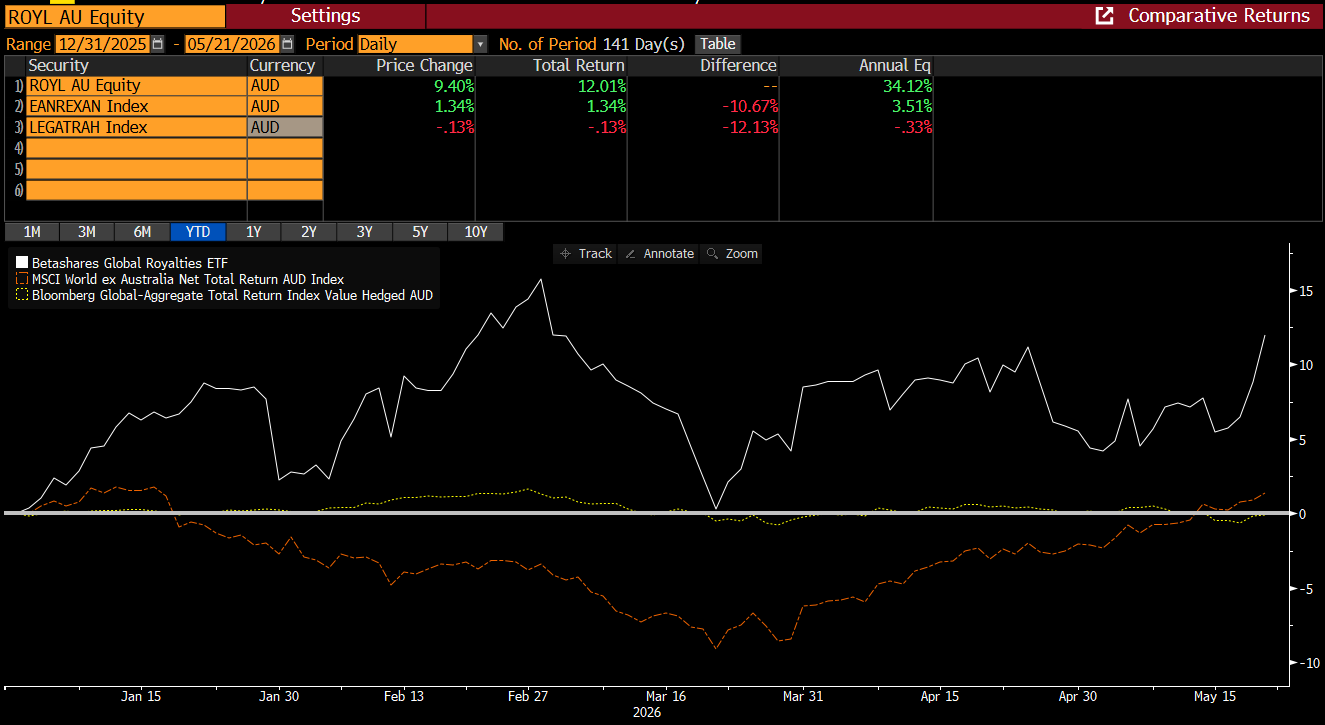
Source: Bloomberg. As at 21 May 2026. Past performance is not an indicator of future performance. You cannot invest in an index. ROYL’s inception date was 9 September 2022. Returns are after fund management costs, assume reinvestment of any distributions and do not take into account tax paid as an investor in the Fund. Past performance is not indicative of future performance. View enlarged chart
Longer term, the Solactive Global Royalties Index (the index that ROYL seeks to track) has delivered returns comparable, if not better, than global benchmarks such as the MSCI World ex-Australia Index.
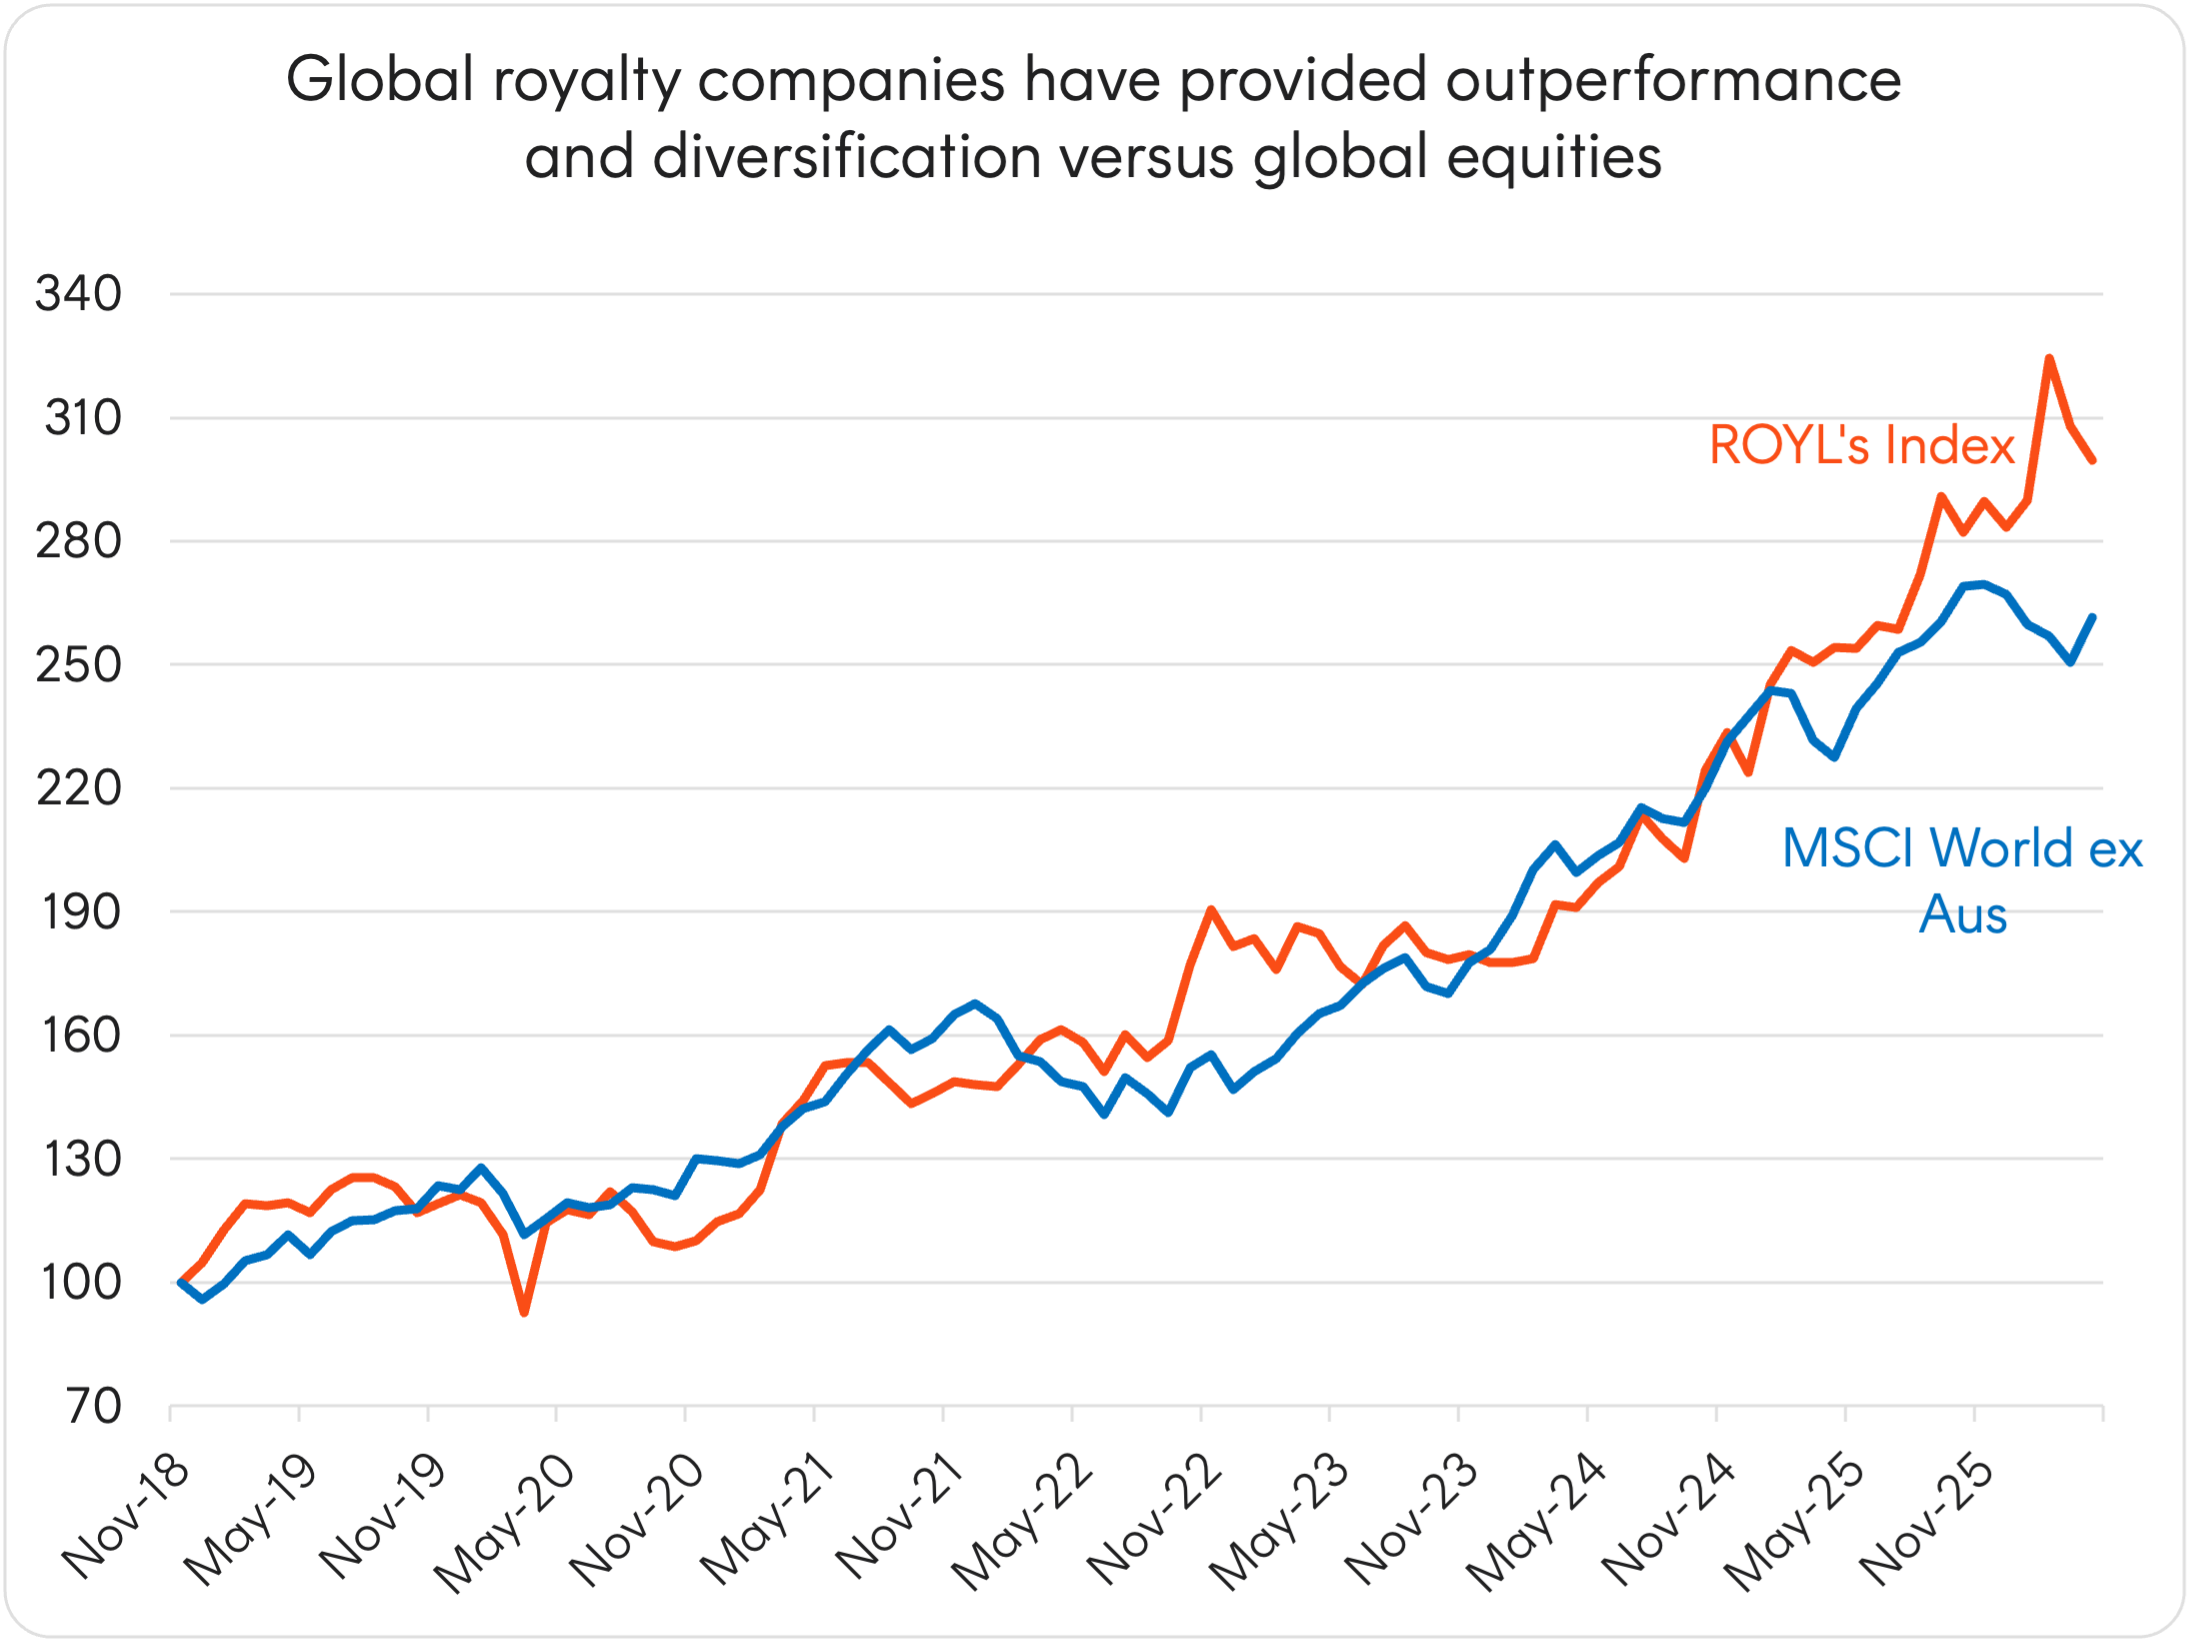
Source: Bloomberg, Betashares. Since inception 30 November 2018 to 30 April 2026. Chart is displaying total return indices, not accounting for fees and expenses You cannot invest directly in an index. Past performance is not an indicator of future performance. View enlarged chart
Importantly, this return series has generally displayed lower correlation to other traditional major asset classes as shown in the table below.
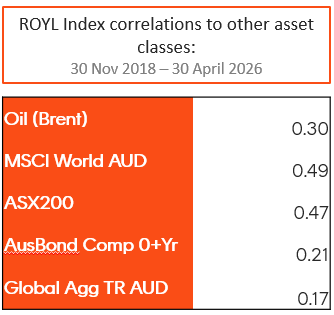
Source: Bloomberg. As at 30 April 2026.
For more information on ROYL, please visit the fund’s web page here. A deeper dive on ROYL can be found in the following brochure.
There are risks associated with an investment in ROYL, including market risk, international investment risk, sector risk, royalties related risks and concentration risk. Investment value can go up and down. An investment in the Fund should only be considered as a part of a broader portfolio, taking into account your particular circumstances, including your tolerance for risk. For more information on risks and other features of the Fund, please see the Product Disclosure Statement and Target Market Determination, both available on www.betashares.com.au.
Past performance is not indicative of future performance.
No assurance is given that any of the companies in ROYL’s portfolio will remain in the portfolio or will be profitable investments.
The information contained in this article is general information only and does not take into account any person’s financial objectives, situation or needs. Investors should consider the appropriateness of the information taking into account such factors and seek financial advice. This article is provided for information purposes only and is not a recommendation to make any investment or adopt any investment strategy.
The Fund is not sponsored, promoted, sold or supported in any other manner by Solactive AG nor does Solactive AG offer any express or implicit guarantee or assurance either with regard to the results of using the Index at any time or in any other respect. The Index is calculated and published by Solactive AG. Neither publication of the Index by Solactive AG nor the licensing of the Index for the purpose of use in connection with the Fund constitutes a recommendation by Solactive AG to invest capital in the Fund nor does it in any way represent an assurance or opinion of Solactive AG with regard to any investment in the Fund.
