

Thong Nguyen
9 minutes reading time
In part two of this series, we delve into the unique investment characteristics of royalty companies, how they can fit into investor portfolios, and their potential to increase income and improve overall risk adjusted returns for investors.
Why include royalty companies in your portfolio?
As we discussed in part one, royalty companies are often considered resilient, capital efficient business. Because they often own the rights to future revenue streams rather than run the operating businesses directly, royalty companies typically offer:
- Protection in inflationary environments
- Attractive underlying fundamentals and strong cash flow growth
- Lower correlation to traditional asset classes and diversification benefits
- Potential for differentiated and attractive returns compared to traditional asset classes
Protection in inflationary environments
Royalty revenues are often linked to the sale prices of final goods and services, meaning they can benefit from rising prices (inflation). At the same time, royalty companies remain insulated from the direct operational risks and rising input costs of manufacturing, mining and distribution. Hence, they can benefit from both rising prices and are less exposed to input cost inflation, providing protection in inflationary environments.
As can be seen in the chart below, ROYL Global Royalties ETF ‘s index has historically exhibited a high correlation with US inflation breakevens. Breakevens are a widely-used measure of inflation expectations. Higher breakeven rates imply that investors anticipate higher inflation in the future.
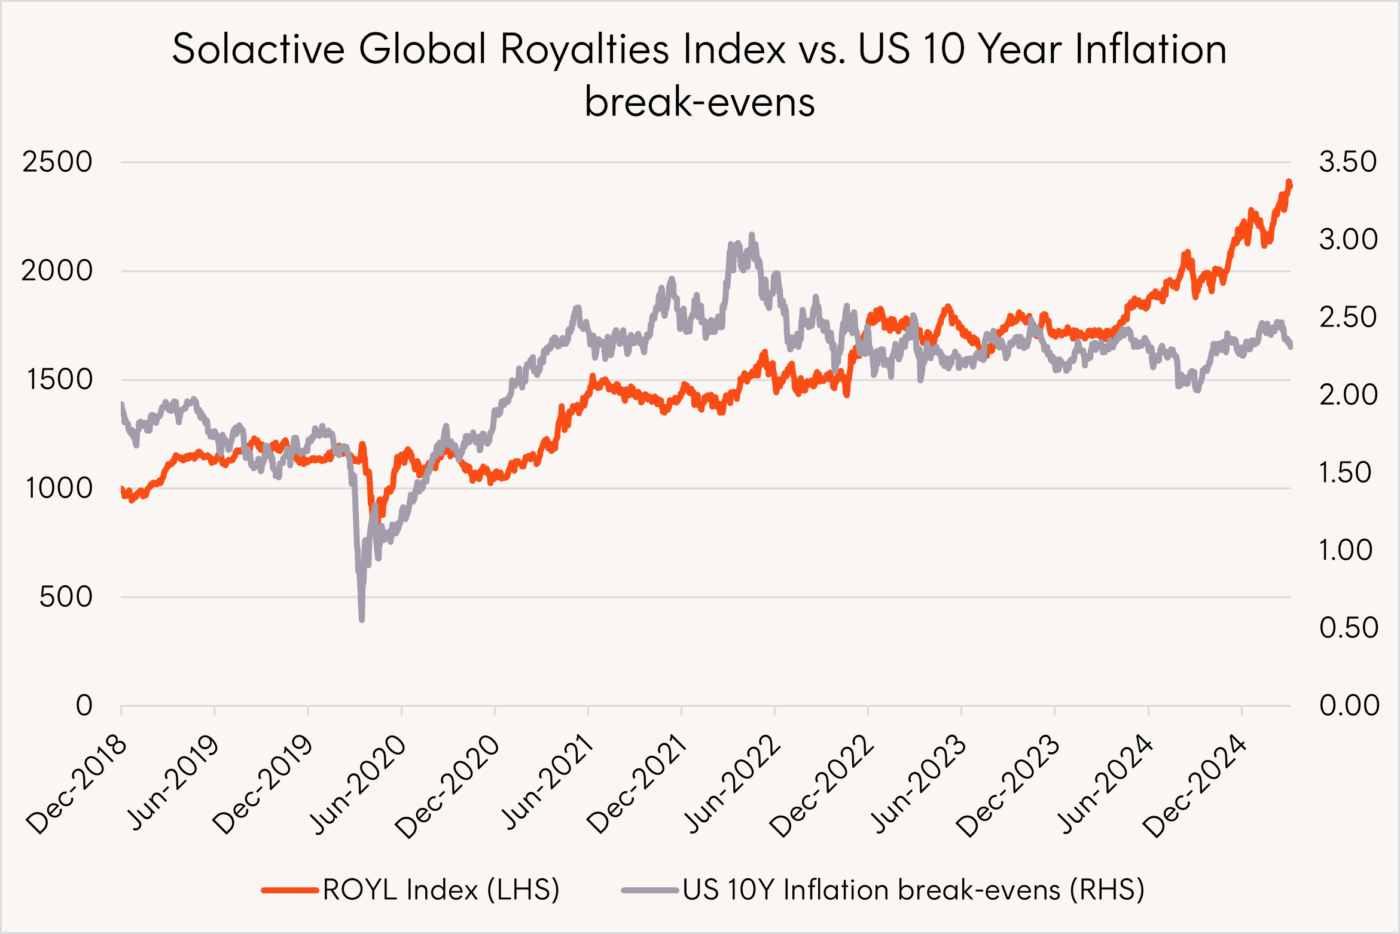
Source: Bloomberg. From November 2018 to June 2025. ROYL’s index is the Solactive Global Royalties Index. Chart denotes index performance and does not include ROYL’s management fee and cost of 0.69% p.a. You cannot invest directly in an index. Past performance is not an indicator of future performance.
Attractive fundamentals
Given their low capital and labour requirements, royalty companies often enjoy stable and scalable business models. They tend to exhibit higher gross margins and stronger return on capital, making them fundamentally attractive when compared to many other companies.
You can see how much more attractive in the following two charts, which compare the gross margin and return on capital of companies in the Solactive Global Royalties Index versus that of companies in the benchmark MSCI World Index.
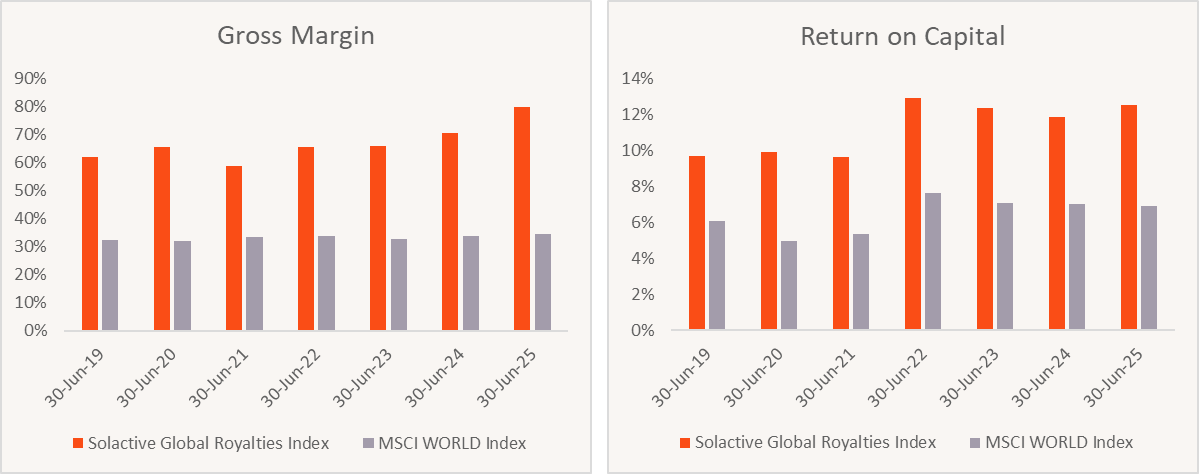
Source: Bloomberg. 30 June 2019 to 30 June 2025.
For the reasons mentioned above, while they may operate in traditionally ‘cyclical’ sectors, as royalty companies grow and diversify, their operating margins can become more stable than the underlying businesses their royalty streams are derived from.
For example, in the below chart, we compare the stability of EBITDA1 margins of the S&P Biotechnology Select Industry Index. This well-diversified representative index is comprised of over 100 biotechnology companies, including Genmab A/S (CPH: GMAB), which is the largest biotech royalty company in ROYL’s index. We can see Genmab A/S has been able to achieve higher and more stable EBITDA margins over time.
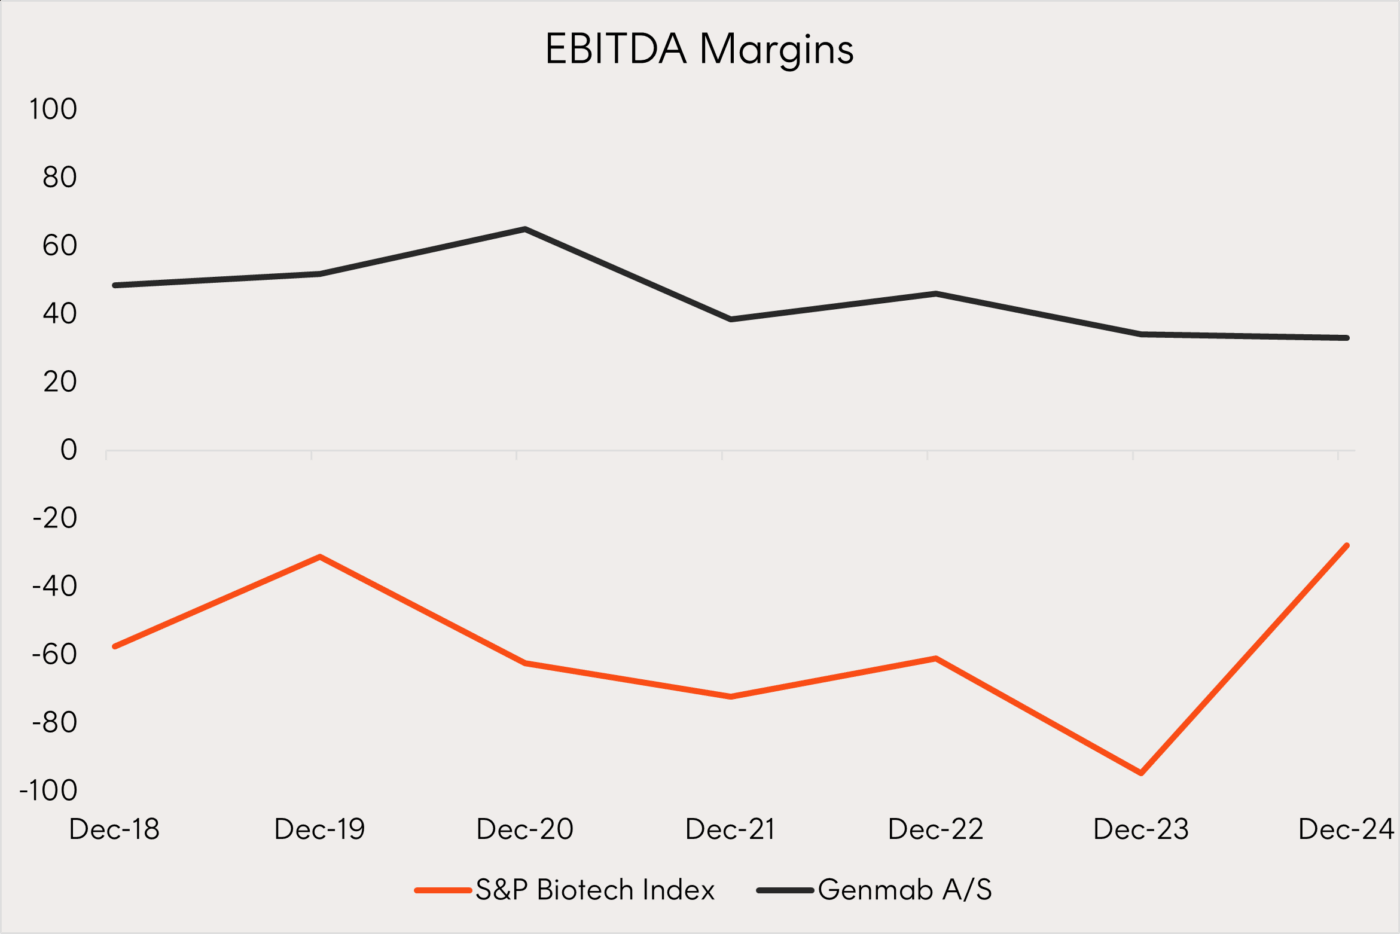
Source: Bloomberg. As at June 2025. EBITDA Margins are generally expressed in percentage terms (%).
The companies in ROYL have also tended to demonstrate robust, resilient cash flow streams, which themselves are underpinned by long-life underlying assets such as mines or licensing agreements for drug treatments.
These durable cash flows have been growing faster than the broader market. Businesses that are capable of generating strong levels of cashflows are less dependent on external capital markets for funding, which positions them more favourably to pursue and capitalise on growth opportunities.
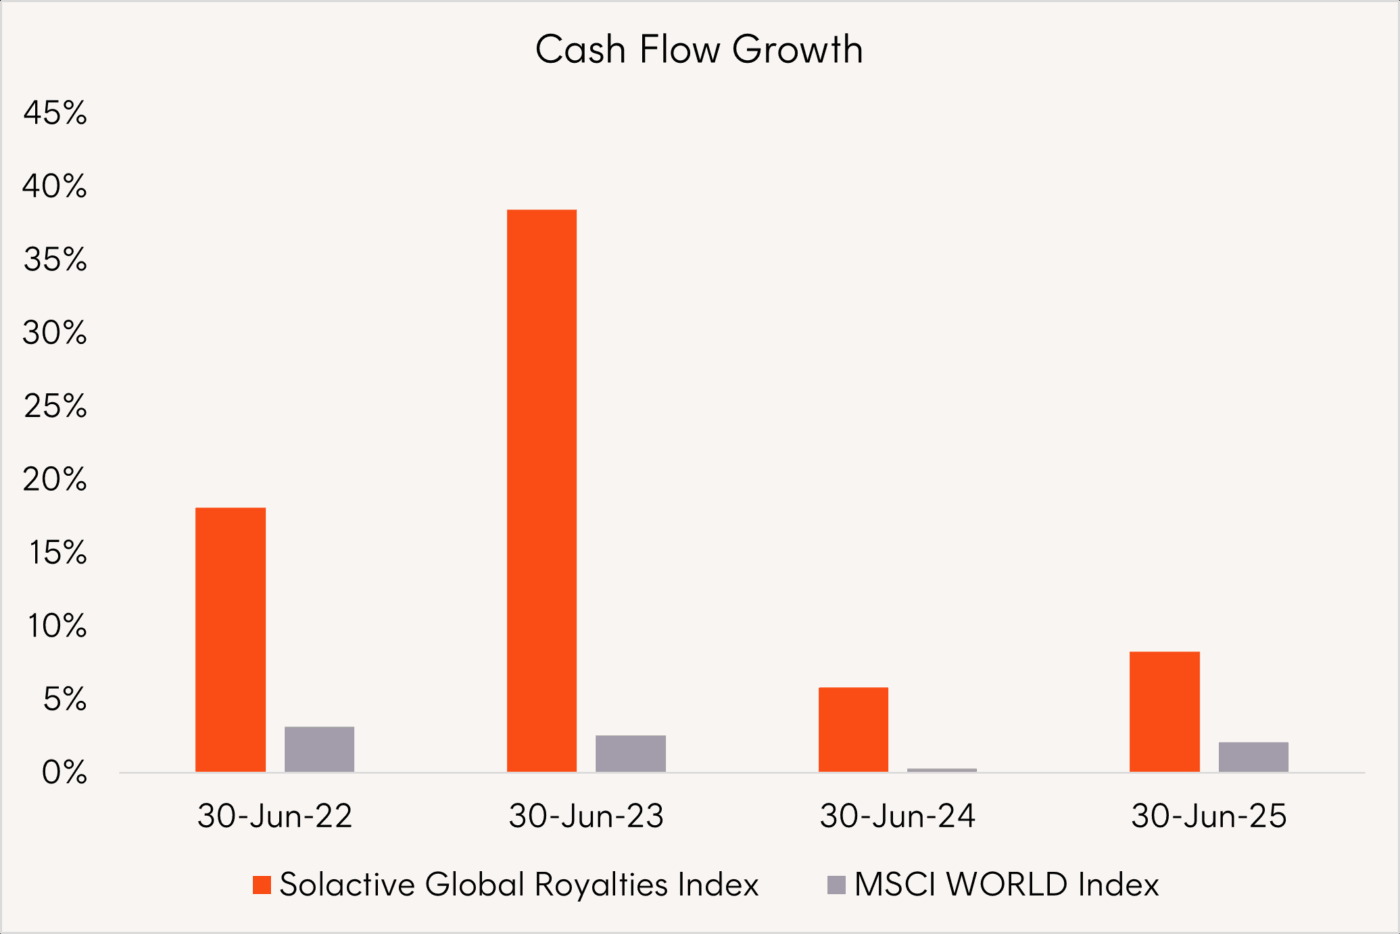
Source: Bloomberg. 30 June 2022 to 30 June 2025.
Potential for attractive, differentiated returns
ROYL’s index has experienced lower correlation with equity and bond benchmarks, offering investors an alternative exposure that could improve the risk-adjusted returns of a diversified portfolio. Correlation measures how closely two investments move together. A low correlation suggests the two assets in focus behave differently, which can help smooth out overall portfolio performance.
|
Correlation to ROYL’s index: Nov 2018 – Jun 2025 |
|||
|
MSCI World AUD |
ASX200 |
Bloomberg AusBond Composite 0+Yr Index |
Bloomberg Global Agg TR AUD |
|
0.58 |
0.18 |
0.02 |
0.04 |
Source: Bloomberg. November 2018 to June 2025. Correlations are based on daily returns.
This alternative return profile can strengthen portfolios in different market environments, particularly when shares and bonds are moving in the same direction (highlighted by shaded blue areas below). Traditional fixed income exposures may be less effective at cushioning market downturns. ROYL’s index, however, has exhibited rising excess returns relative to global equities during these periods.
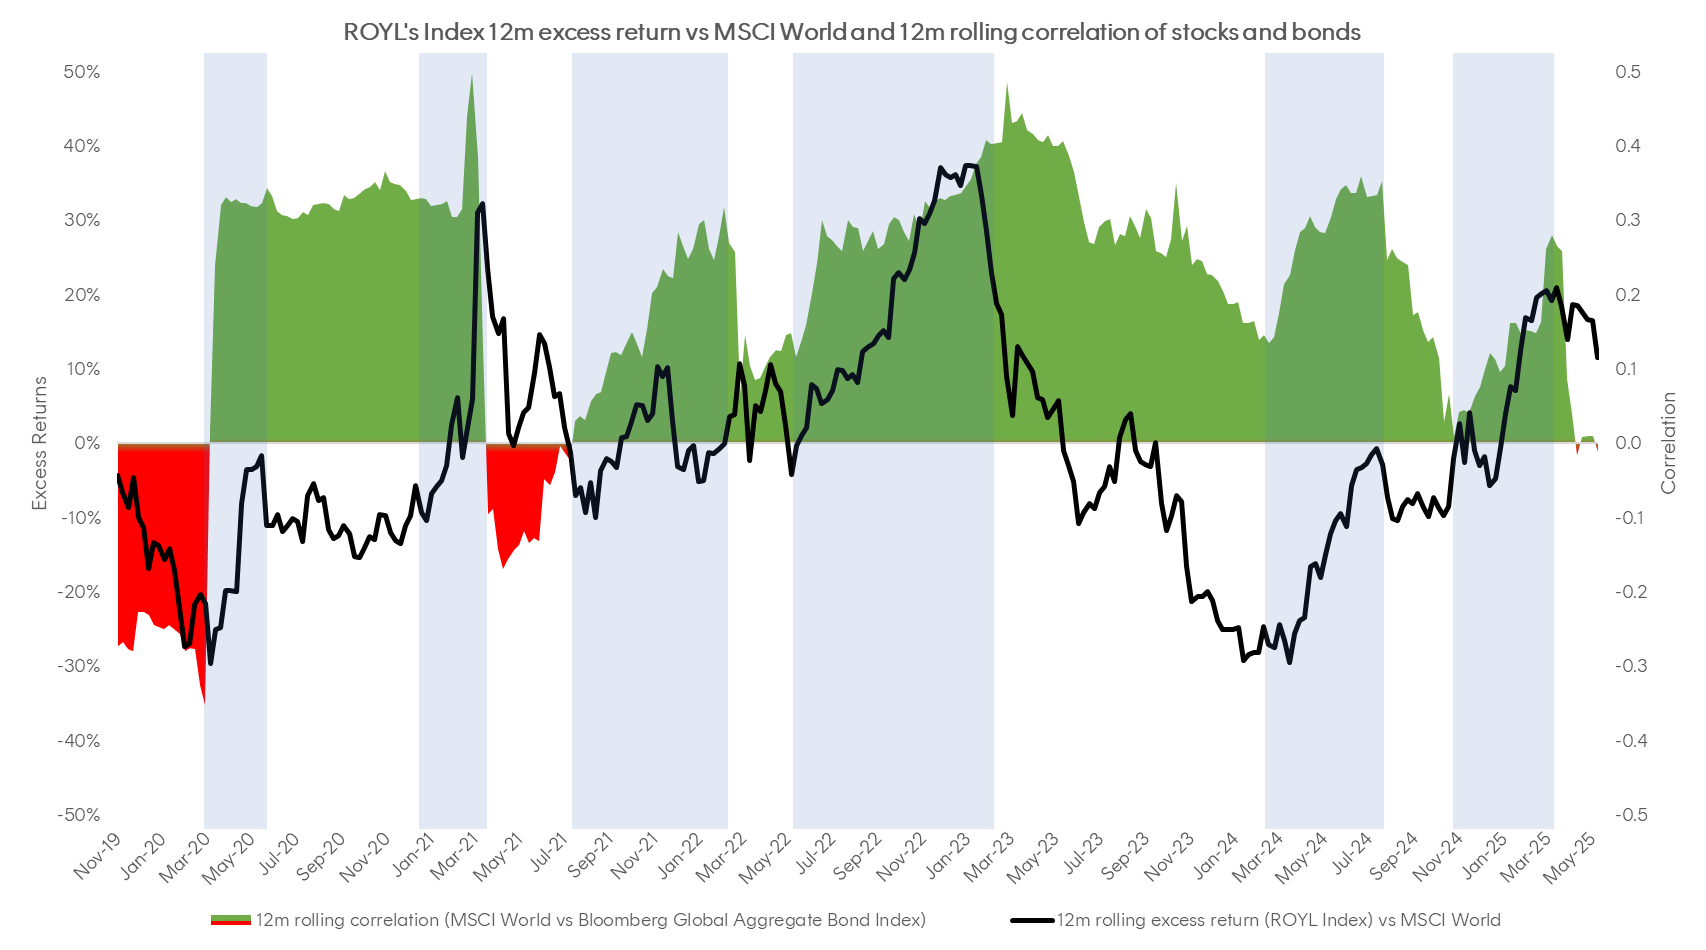
Source: Bloomberg. From November 2018 to June 2025.
As well as providing diversification, ROYL’s unique investment characteristics have delivered attractive returns, both on an absolute and risk-adjusted basis.
From the fund’s inception (9 Sept 2022) until 31 July 2025, ROYL has returned 17.68% p.a. after fees2.
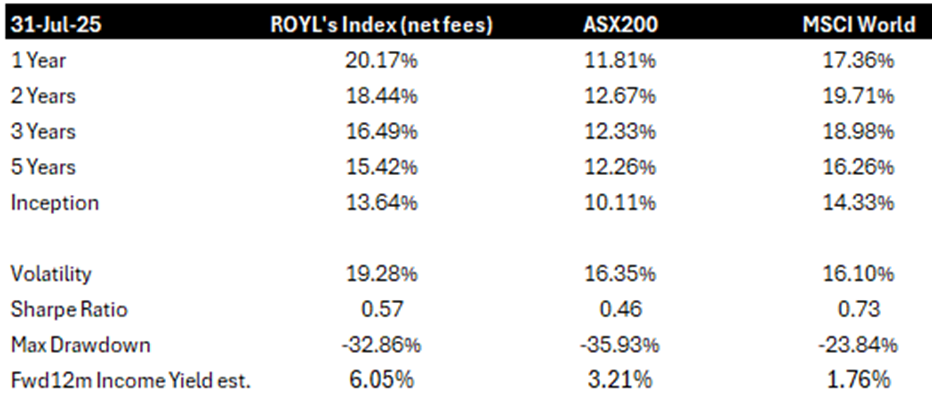
Source: Bloomberg, as at 31 July 2025. Past performance is not indicative of future returns. ROYL’s index inception date was 7 November 2018.
To illustrate the impact of adding royalty companies to a portfolio of Australian shares, let’s consider a hypothetical scenario in which a 20% allocation to royalty companies (represented by ROYL’s index, net of ROYL’s management fees and costs) is combined with an 80% allocation to Australian shares (represented by the S&P/ASX 200).
Since ROYL’s index inception on 7 November 2018 and through to 31 July 2025, we can see that relative to Australian equities alone:
- Total returns would have improved from 10.11% to 11.03%
- Volatility would have reduced from 16.35% to 14.33%
- Sharpe ratio would have increased from 0.46 to 0.59
- While the current forward 12-month expected income yield would increase from 3.21% to 3.78%
A similar hypothetical exercise can be done by adding a 20% allocation to royalty companies (represented by ROYL’s index, net of management fees and costs) to a portfolio of global shares (represented by the MSCI World Index).
The following results in this scenario also showcase improved returns:
- Total returns would have improved from 14.33% p.a. to 14.43% p.a.
- Volatility would have reduced from 16.10% to 15.46%
- Sharpe ratio would have increased from 0.73 to 0.76
- While the current forward 12-month expected income yield would increase from 1.76% to 2.62%
How can you gain access to royalty streams?
Traditionally, royalty investments were opaque and within the domain of private capital and sophisticated investors who were attracted to their high cash flows, low operational risk and upside participation in the growth of the underlying businesses.
Launched in 2022, ROYL was the world’s first ETF to offer a strategy focused purely on royalty companies.
ROYL provides investors with a liquid and listed exposure to pure play global royalty companies spanning multiple sectors including mining, energy, pharmaceuticals and technology. The fund opens access to this unique opportunity to every investor and can also be used as a liquid complement to direct private royalty exposures.
ROYL pays out smoothed monthly distributions that aim to reduce ups and downs, while also aiming to reflect the average cash flow yield of its underlying companies over the past year. The prior 12-month cash flow yield of ROYL’s portfolio was 6.05% p.a. (31 July 2025) and this level can be expected to be paid out monthly equating to approximately 0.50% per month as at 31 July 2025.
There are risks associated with an investment in ROYL, including market risk, international investment risk, sector risk, royalties related risks and concentration risk. Investment value can go up and down. An investment in the Fund should only be considered as a part of a broader portfolio, taking into account your particular circumstances, including your tolerance for risk. For more information on risks and other features of the Fund, please see the Product Disclosure Statement and Target Market Determination, both available on www.betashares.com.au.
Yield will vary and may be lower at time of investment. Past performance is not indicative of future performance.
No assurance is given that any of the companies in the Fund’s portfolio will remain in the portfolio or will be profitable investments.
The Fund is not sponsored, promoted, sold or supported in any other manner by Solactive AG nor does Solactive AG offer any express or implicit guarantee or assurance either with regard to the results of using the Index at any time or in any other respect. The Index is calculated and published by Solactive AG. Neither publication of the Index by Solactive AG nor the licensing of the Index for the purpose of use in connection with the Fund constitutes a recommendation by Solactive AG to invest capital in the Fund nor does it in any way represent an assurance or opinion of Solactive AG with regard to any investment in the Fund.
Footnotes:
1. Earnings before interest, taxes, depreciation and amortisation ↑
2. Past performance is not an indicator of future performance. ↑
5 comments on this
Hi, I am a new investor, can I connect with the author of this article for more information of investing. Thanks
Hi La, please feel free to reach out to our team at [email protected] anytime if you have any questions!
The Fact sheet for ROYL indicates distribution yield is 3.5%. Why then do you quote a cash flow yield of 6.05% in the context of paying distributions?
Hi Brett,
The 3.50% distribution yield currently shown on the website reflects only 7 of the 12 monthly payments. Since ROYL transitioned to monthly distributions starting January 2025, the full 12-month yield has yet to reflect all 12 payments. As this occurs, the trailing 12-month distribution yield is expected to rise.
excellent question Brett, i too would like to better understand the divergence before considering investing