

Hugh Lam
5 minutes reading time
Equity markets grinded higher last year in the face of global trade disruption, growing geopolitical tensions, and market valuation and concentration concerns. Resilient corporate earnings and stronger than expected economic data in the US buoyed headline index levels, alongside AI-related investments.
However, there are significant questions remaining heading into 2026 for investors.
- Will global policy rates diverge?
- What do geopolitical developments in Iran, Venezuela and Greenland mean for markets?
- Are we in an AI bubble?
- And will the US labour market continue to weaken?
Within this context, we asked six Betashares investment experts to nominate a chart that they think investors should be watching for the year ahead.
#1 Global policy divergence
Nominated by: Chamath De Silva, Head of Fixed Income
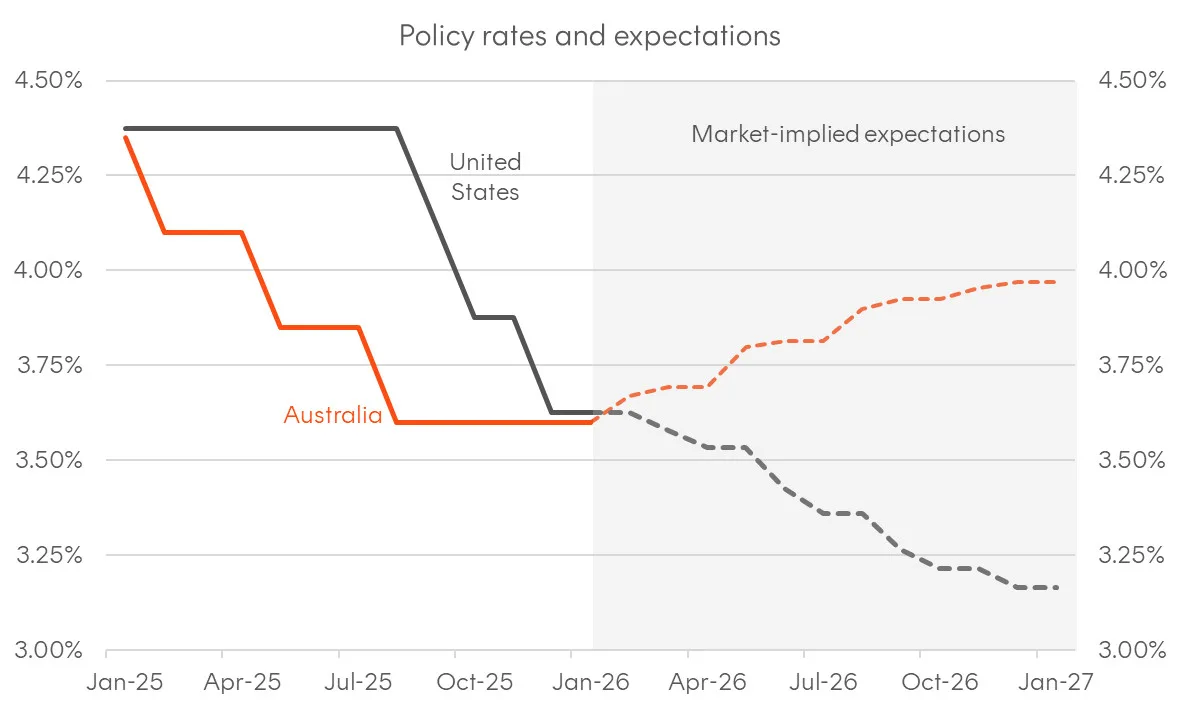
Source: Bloomberg, Betashares. As at 16 January 2026.
Why it’s important: One of the key developments in fixed income markets has been the divergence that’s emerged in global policy rate expectations following a period of largely synchronised easing from major central banks.
Markets are expecting countries like Australia, Canada, and New Zealand to join the Bank of Japan (BoJ) in adopting a tightening bias amid resurgent inflation pressures, whilst the US Federal Reserve is expected to continue cutting rates. Whether reality plays out this way remains to be seen, but policy divergence will have major implications for fixed income returns, and for FX markets and currency hedging decisions.
# 2 Can the RBA keep inflation in check?
Nominated by: David Bassanese, Chief Economist
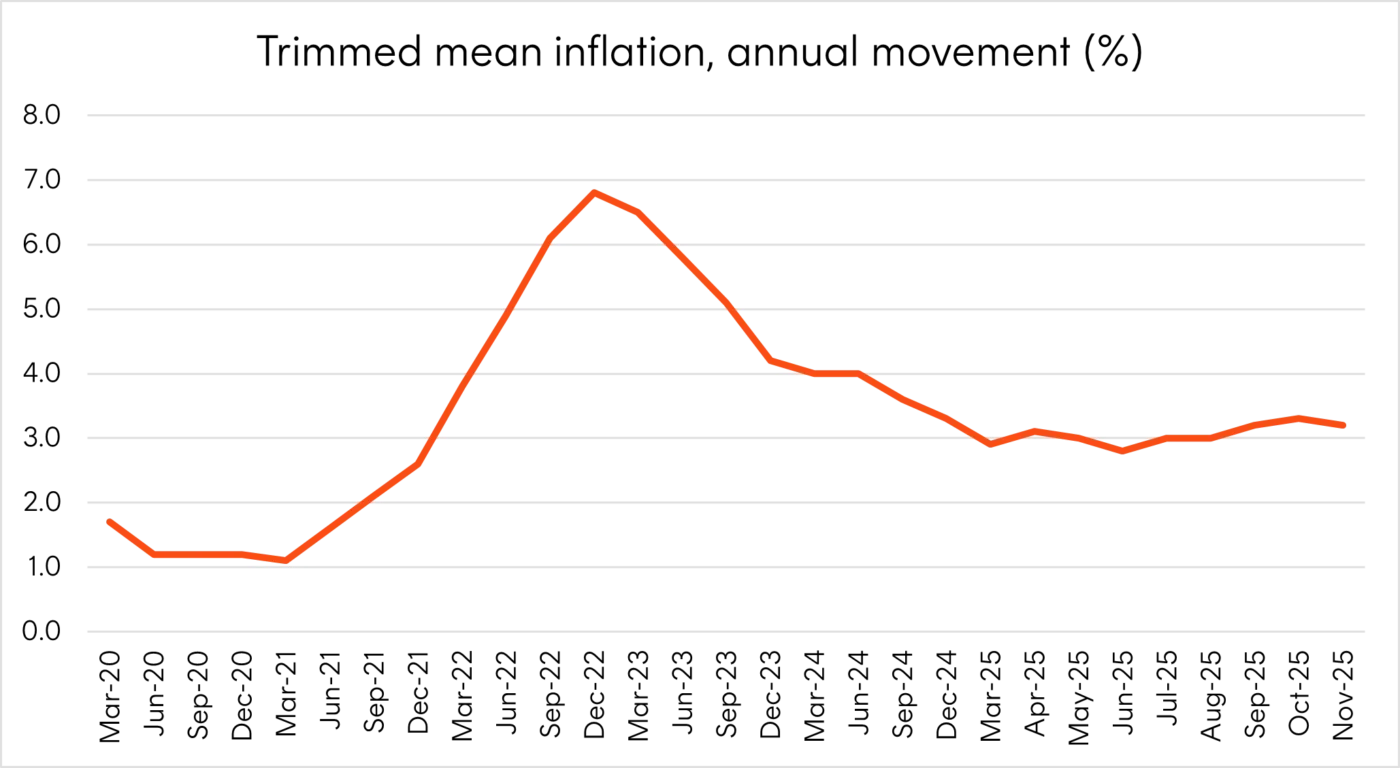
Source: Australian Bureau of Statistics. As at 7 January 2026.
Why it’s important: Critical to the outlook for the Australian economy in 2026 is the outlook for inflation. Despite a recent rebound in price pressures, we anticipate temporary factors such as a lift in global food prices and home builder discounts to fade. Renewed interest rate concerns may also place competitive pressure on profit margins and on consumer spending, limiting underlying price pressures in 2026. Given these factors we maintain a non-consensus base case for one RBA rate cut this year which in turn should continue to support the economy.
#3 Is US employment growth a canary in the coal mine or another false recession indicator?
Nominated by: Tom Wickenden, Investment Strategist
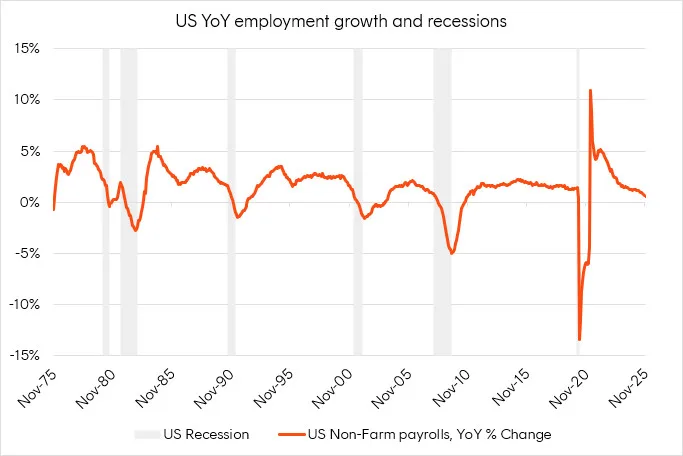
Source: FRED, Bloomberg. November 1975 to November 2025
Why it’s important: The total number of jobs in the US increased by 0.6% over the past year, the slowest growth rate since March 2021. Over the past 50 years, this level of weakness has always preceded a recession and a spike in unemployment.
However, the US labour market is sending mixed signals, complicated by the government shutdown, government job cuts, deportations, and reduced immigration.
Does weak US employment hold the key to the outlook for the US economy in 2026 or could this be yet another false recession indicator, following inverted yield curves in 2022 and the Sahm rule being triggered in 2024?
#4 Will the AI capex juggernaut continue?
Nominated by: Hugh Lam, Investment Strategist
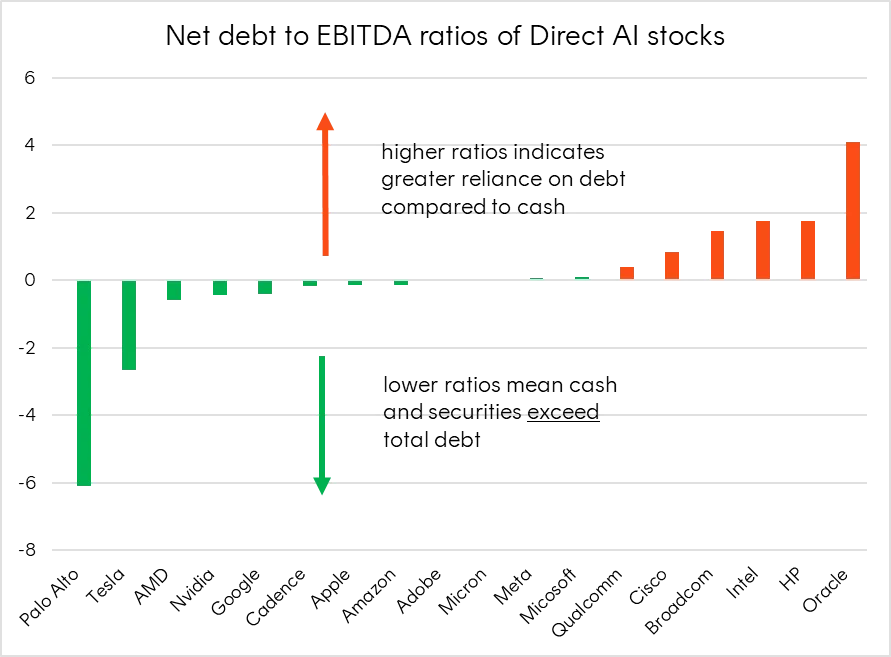
Source: Bloomberg. As at 2 January 2026.
Why it’s important: Much of the AI capex boom is currently being funded by internally generated cash flows from US megacap tech, however concerns have risen with many tapping the debt markets for cheaper sources of funding1.
That said, these companies still have room to issue more debt given the strength of their balance sheets and have net debt to cash flow ratios less than zero.
#5 Investing beyond the US
Nominated by: Cameron Gleeson, Senior Investment Strategist

Source: Factset, Betashares. As at 13 January 2026.
Why it’s important: Global investors have been underweight Emerging Markets over the past few years, but sentiment and flows appear to be at a turning point. Emerging Market fundamentals are the stand out globally – offering similar earnings growth to the Nasdaq 100 at half the cost.[2]
#6 Friend or Foe?
Nominated by: James Fleiter, Director – Private Assets
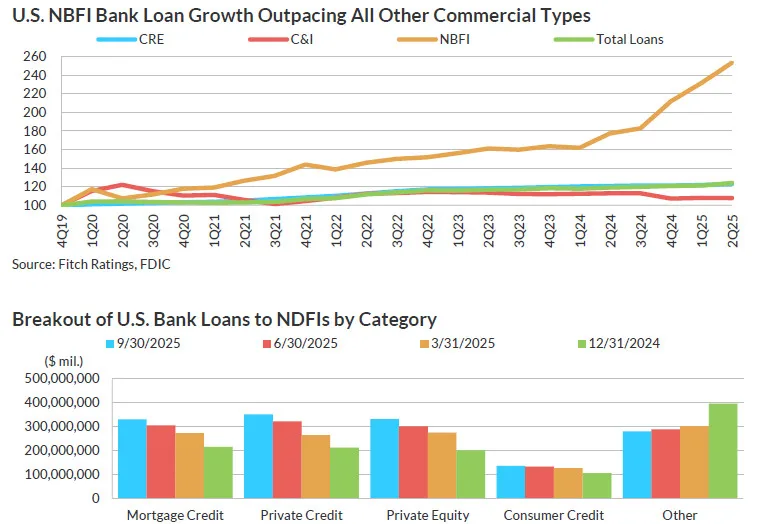
Source: Fitch Ratings, S&P Capital IQ. NDFI – non-depository financial institution. Note: Data reflect balances only for banks with total assets greater than $10 billion, which comprise 98% of overall NDFI lending.
Why it’s important: The narrative permeating the media is that private credit is competing with banks, however the reality appears to be that banks are working in lockstep with private credit. Loans to non-bank financial institutions (NBFIs) is the fastest growing segment of bank balance sheets implying that banks have just found a more capital efficient way to access the same underlying credit risk.
Footnotes:
1. Together, Alphabet, Meta, Oracle, Apple, Microsoft, Amazon, Nvidia, and related-SPVs raised over US$120 billion in debt last year. ↑
2. Earnings growth based on analysis forecast consensus and cost based on forward PE ratios. ↑