
Chamath De Silva
6 minutes reading time
Commentary from the Betashares portfolio management desk by Head of Fixed Income Chamath De Silva, providing an overview of bond markets:
- Amid all the theatre around Powell’s possible successor, market pricing for the Fed Funds rate remains largely captive to the economic data.
- Steep global yield curves create implied forward yields that are too good to ignore.
- The RBA cuts rates and downgrades its GDP and productivity growth forecasts. Is the “neutral” cash rate below 3%?
What‘s priced into a post-Powell Fed?
With the July FOMC behind us, Fed watchers would typically turn their attention to this month’s Jackson Hole symposium for a read on the future direction of policy. But with Powell increasingly viewed as a lame duck chair, and facing relentless criticism from President Trump, the focus has shifted to his likely successor and what that might mean for the FOMC in the back half of 2026.
There’s growing risk that a “shadow FOMC” could emerge, with market pricing from mid-2026 onwards influenced more by Trump’s preferred candidate than the sitting chair. The administration appears to be positioning itself accordingly, with Trump recently appointing Stephen Miran, of “Mar-a-Lago Accord” fame, to fill a vacant seat on the Board of Governors, signalling an intent to stack the FOMC with allies. According to prediction markets, Fed Governor Chris Waller leads the field as Powell’s likely replacement. Waller has notably broken ranks with Powell recently, openly dissenting at July’s meeting (along with Governor Bowman) and calling for an immediate cut. While still a conventional choice who would likely be well-received by markets, his nomination would steer the FOMC in a more dovish direction.
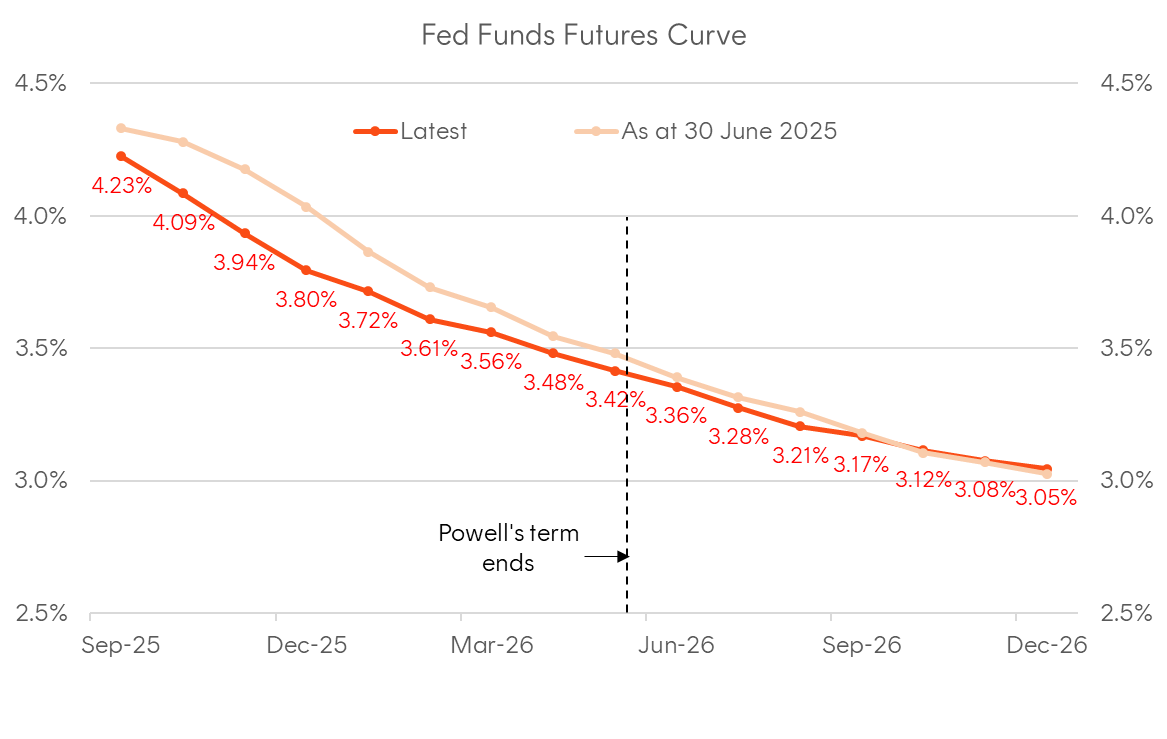
Interestingly though, market pricing largely implies continuity regardless of who takes the helm. Fed funds futures show only 1.5 cuts priced between April and December 2026, hardly the “monster” repricing some might expect from a Trump-appointed chair. This suggests markets believe economic fundamentals, rather than political appointees, will ultimately drive policy. The evolution of Fed funds pricing reinforces this view, with jobs data remaining the primary swing factor even as the succession drama unfolds. Specifically, while the weak July payrolls number has pulled forward rate cut expectations, December 2026 Fed Funds Futures pricing is little changed since the end of June, which is consistent with a Fed largely remaining data dependent. The key question for bonds isn’t whether Trump will get a more compliant Fed chair (that’s a given), but whether economic conditions will warrant the kind of aggressive easing that could drive yields meaningfully lower.
Chart 1: Market implied policy rate expectations (Fed Funds Futures); As at 12 August 2025; Sources: Bloomberg, CME
What‘s priced into long-term yields over the long-term?
Now, while much of the discussion about Powell’s successor and the future of Fed independence is interesting, what‘s arguably more relevant to investors making long-term asset allocation decisions is what‘s priced into rates over the long run. There’s been a bit of attention given to the steepening of global yield curves, led by Japan, but it’s worth diving into what this implies for forward pricing. Remember, the yield curve doesn’t just tell us current yields across maturities; it also reveals what‘s priced into yields at various points in the future. The steepening at the global long-end, particularly in 10s20s and 10s30s spreads, has pushed long-term implied forward 10-year yields across developed markets to levels that can’t be ignored.
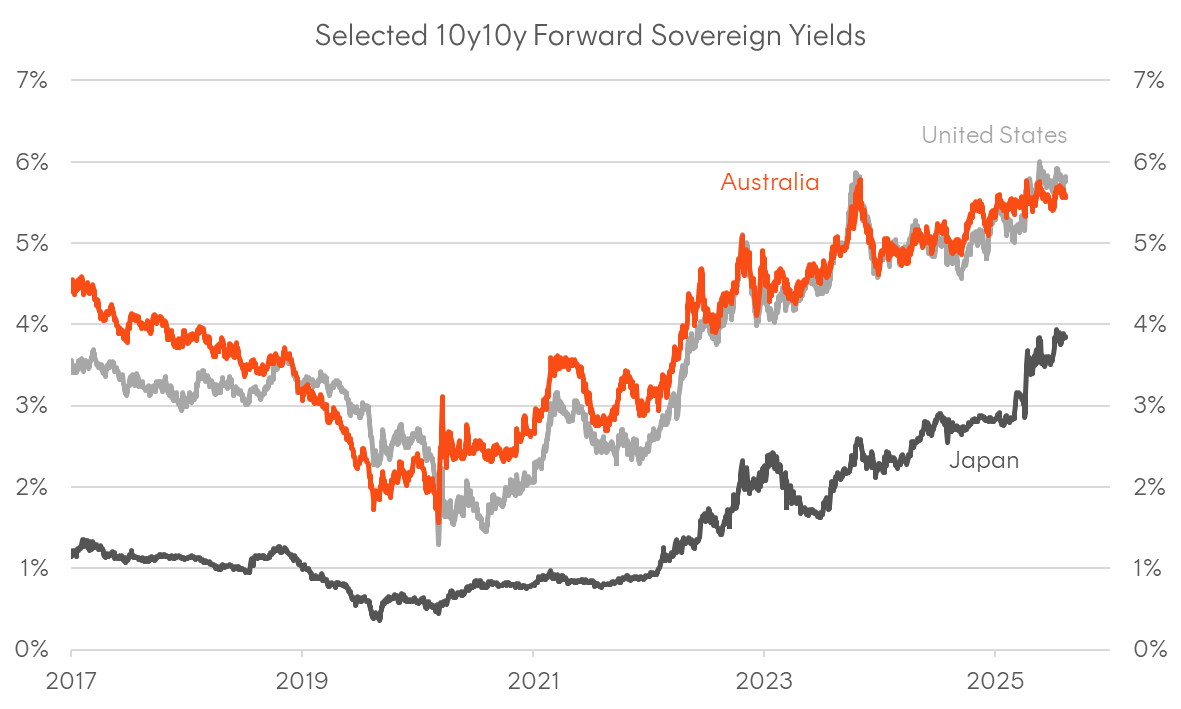
Looking at nominal curves for Australia, the US, and Japan, we see 10y10y forward yields sitting at multi-year highs. For Australia and the US, this measure is hovering around 5.5%, while Japan sits close to 4%. To me, that screams compelling long-term value, and I simply don’t believe policy rates will average anywhere near those levels, assuming inflation remains broadly within target bands.
But what about if inflation proves stickier than expected? Turning to long-term inflation-linked bond markets, we can examine 10y10y real yields, which show what‘s priced in for 10-year CPI-indexed yields a decade from now. Both Australia and the US are pricing in 3% forward real yields – a massive risk premium in my view, given where neutral real rates will likely settle over time.
Chart 2: Selected 10y10y forward sovereign yields; as at 12 August 2025; Source: Bloomberg
The RBA’s latest cut and what it means for bonds
As expected, the RBA cut rates by 25 basis points at yesterday’s meeting and guided towards further rate cuts on the back of some marginally dovish forecast revisions. At the time of writing, we’ve got a full rate cut priced in for Melbourne Cup Day, with the terminal rate expected to reach 3% by the first quarter of next year.
Probably the most interesting aspect of the forecast revisions was the significant drop to GDP and productivity growth estimates. While the governor was quick to point out during the press conference that the downward revisions to productivity numbers aren’t reflective of long-term productivity growth assessments, the lack of productivity has become the number one concern for policymakers and economists.
In my view, productivity growth will remain under pressure amid a combination of unfavourable demographics and a lack of political will or mandate to undertake major structural reform. Unless AI creates a major productivity dividend across the broader Australian economy over the next few years, I see it increasingly likely that the RBA will be forced to revise down its real neutral rate estimate further.
Assuming inflation remains under control, a “neutral” nominal cash rate might be well below 3% and we could see a repeat of the pre-covid rate cutting dynamic where both the cash rate and market pricing had to be taken progressively lower as the economy repeatedly failed to find any kind of escape velocity and “secular stagnation” took hold.
What all this means for bonds is straight forward and we shouldn’t overcomplicate it. Rate cuts generally provide a tailwind for duration, especially when the yield curve is at a steep starting point. Coming back to my earlier point about 10y10y yields, the Australian long-end is well placed to perform well on the back of a combination of carry, rolldown, and increasingly, portfolio insurance amid extended equity valuations and a structural growth picture for the Australian economy that’s looking increasingly suspect.
Chart 3: Evolution of RBA’s economic forecasts for December 2025; Source: RBA
