
Jing Jia
9 minutes reading time
- Fixed income, cash & hybrids
Faced with an environment of declining investments’ income, with equity dividend yields trending lower and the gradual phase out of Australian bank hybrids; many investors are looking for ways of filling the income gap in their portfolios.
The good news is investors no longer have to stretch outside of their defensive asset allocation bucket and take on higher risk from equity-like exposures to maintain a high level of income.
The ECRD Australian Enhanced Credit Income Complex ETF has been designed to deliver a monthly income above what is typically available from existing bank hybrids, and with a lower volatility profile, while maintaining investment grade credit quality.
Simulated historical strategy performance illustration
The simulated historical strategy performance included in this document shows simulated historical performance of a geared Australian credit income strategy (as measured by 50% the Solactive Australian Investment Grade Corporate Bond Select DH Index and 50% the Solactive Australian Major Bank Subordinated FRN Index) for the period from 28 February 2019 to 19 November 2025.
All simulated performance information is provided for illustrative purposes only and is not representative of actual fund performance. The information provided is not a recommendation or offer to make any investment or to adopt any particular investment strategy. Simulated past performance is not indicative of future performance or any fund or strategy. Please refer to the end of the email for important information and key assumptions.

Source: Solactive, Bloomberg, Betashares. As at 1 December 2025. This information is provided for illustrative purposes only and is not representative of actual fund volatility. Actual outcomes may differ materially. You cannot invest directly in an index. The information provided is not a recommendation or offer to make any investment or to adopt any particular investment strategy. Simulated past performance is not indicative of future performance of any fund or strategy.
Simulated and actual volatility is daily volatility calculated from Index minus MER daily returns from 28 February 2019 to 28 November 2025. BHYB’s index and MER are the Solactive Australian Banking Preferred Shares GTR Index and 0.35% p.a., BSUB’s are the Solactive Australian Major Bank Subordinated FRN Index and 0.29% p.a., HCRD’s are the Solactive Australian Investment Grade Corporate Bond Select DH Index and 0.29% p.a.. Yield may vary at the time of investment. Yield net of fees represents different yield types for each fund: BSUB, HCRD and ECRD is estimated yield to worst plus rolldown yield; BHYB is gross running yield. Rolldown yield comes from bonds shortening in maturity and moving to lower-yielding points on the curve, thus generating price gains. This assumes the yield curve remains upward-sloping. Rolldown yield increases with the slope of the yield curve and may turn negative if the yield curve inverts. Please refer to the bottom of the article for important information, assumptions and disclaimers.
In seeking to replace the high level of gross income that bank hybrids will leave behind once phased out, investors are left with no single ‘silver bullet’ alternative. Traditional investment grade corporate bonds don’t offer enough yield, while private credit doesn’t meet many investors’ liquidity and credit quality requirements.
ECRD on the other hand ticks most of the boxes, and whilst it doesn’t offer franking credits (only shares will offer that after the hybrids phase-out), its cash yield currently exceeds the gross of franking yields of Australian bank hybrids.

1 Estimated excess yield over RBA Cash represents long-term averages through the cycle. Bank hybrids figures are inclusive of franking credits. Not all Australian Investors will be able to receive the full value of franking credits. Yield may vary at the time of investment. Past performance is not indicative of future performance of any fund or index.2 Volatility was calculated over a historical period of 28/02/2019 to 28/11/2025. Australian Enhanced Credit Income based on simulated past performance, please refer to the bottom of the article for important information, assumptions and disclaimers.
Except for Australian Enhanced Credit Income, all the bank hybrid alternatives presented above are represented by existing ETFs and/or unlisted funds that provide exposure to the relevant asset classes listed above.
With the exception of ECRD, all of the bank hybrid alternatives presented above are represented by existing Australian ETFs and/or unlisted funds that provide exposure to the relevant asset classes listed above.
Simulated historical performance shows strong total returns compared with the gross returns of bank hybrids, with a Sharpe ratio – a common measure of risk-adjusted returns – nearly twice as high.


Source: Solactive, Bloomberg, Betashares. 28 February 2019 to 28 November 2025. Bank hybrids represented by gross returns of Solactive Australian Banking Preferred Shares GTR Index, net of 0.29% p.a. BHYB management fees. Major Bank Tier 2 FRNs represented by Solactive Australian Major Bank Subordinated FRN Index, net of 0.29% p.a. BSUB management fees. Please refer to the bottom of the article for important information, assumptions and disclaimers. This information is provided for illustrative purposes only and is not representative of actual fund performance. Actual outcomes may differ materially. You cannot invest directly in an index. The information provided is not a recommendation or offer to make any investment or to adopt any particular investment strategy. Simulated past performance is not indicative of future performance of any fund or strategy.
ECRD’s investment strategy
- ECRD enhances the yield on a portfolio of investment grade senior corporate bonds and subordinated Big 4 bank bonds obtained via investments in Betashares Australian Major Bank Subordinated Debt ETF (ASX: BSUB) and Betashares Interest Rate Hedged Australian Investment Grade Corporate Bond ETF (ASX: HCRD).
- Income potential is boosted by increasing exposure to the underlying fixed income securities and earning a net interest margin – achieved through internal gearing at institutional borrowing rates.
- ECRD hedges against interest rate risk by investing in only floating rate and interest rate hedged bonds.
- The leverage range of ECRD is between 300% to 350%, with the portfolio leverage brought back to the midpoint of 325% at the end of the day if leverage moves outside of this range.
Where ECRD can fit into an investor’s portfolio
- ECRD can form a core part of a credit income allocation
- It may be suitable for investors seeking a high-yielding alternative to bank hybrids
- ECRD’s TMD profile is medium for consumer’s risk and return
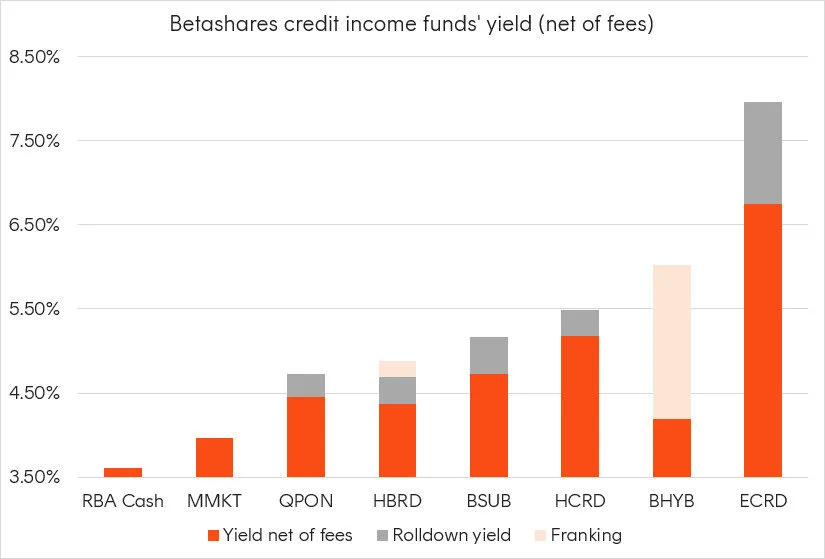
Sources: Bloomberg; Solactive, Betashares. As at 1 December 2025. Yield may vary at the time of investment. Yield net of fees represents different yield types for each fund: MMKT is yield to maturity; QPON is estimated yield to maturity; HBRD, BSUB, HCRD and ECRD is estimated yield to worst; BHYB is gross running yield. Rolldown yield comes from bonds shortening in maturity and moving to lower-yielding points on the curve, thus generating price gains. This assumes the yield curve remains upward-sloping. Rolldown yield increases with the slope of the yield curve and may turn negative if the yield curve inverts.
For more information on ECRD, please visit the fund page here. You can also sign up for a webinar discussing ECRD in more detail at 11am on the 9th of December here. By signing up you will also receive the slides and a recording of the webinar after the event.
Simulated historical strategy performance illustration – Enhanced Australian credit income strategy assumptions
Important information
- The simulated hypothetical is based on simulated historical performance of a geared Australian credit income strategy (as measured by 50% the Solactive Australian Investment Grade Corporate Bond Select DH Index and 50% the Solactive Australian Major Bank Subordinated FRN Index) for the period from 28 February 2019 to 19 November 2025. It is based on certain assumptions (see below) and is subject to certain inherent limitations. It is provided for illustrative purposes only and is not representative of actual fund performance. Actual outcomes may differ materially.
- You cannot invest directly in an index.
- The information provided is not a recommendation or offer to make any investment or to adopt any particular investment strategy. Financial advisers should make their own professional assessment of the suitability of such information, relying on their own inquiries.
- Future results are inherently uncertain. This information may include forward-looking statements which are subject to various risks and uncertainties. Forward-looking statements are based on certain assumptions which may not be correct.
- Simulated past performance is not indicative of future performance of any fund or strategy.
Key assumptions
- Simulated strategy performance is shown net of management fee and costs, being 0.29% p.a. of gross asset value.
- For the strategy, a gearing ratio of 66.7-71.4% is applied, with the ratio brought back to the target neutral (69.2%) at end of day if the ratio moves outside of this range.
- Borrowing costs are based on the rates/margins agreed with the prime broker for ECRD.
- All returns assume reinvestment of distributions. Does not take into account transaction costs.