

Hans Lee
7 minutes reading time
Contrary to popular opinion, what separates great investors from good investors often has little to do with market timing, complex formulas or knowing every detail about every asset.
More often than not, successful investing comes down to fundamental principles and remaining disciplined through all market cycles. Investors encounter these principles everywhere – from Warren Buffett quotes to articles in the financial media – but they often feel abstract without practical application.
The following four ratios offer something different: quantifiable benchmarks that can help to guide decisions through market cycles and different stages of life.
1. The 50/30/20 rule: Creating capacity to invest
For most Australians, the barrier to building wealth is often not finding the right investment, it’s creating the capacity to consistently invest. This is where the 50/30/20 rule may help.
The guide, originated by US Senator Elizabeth Warren and her daughter in their book All Your Worth: The Ultimate Lifetime Money Plan, proposes that 50% of an investor’s after-tax income should go towards essential needs, 30% toward discretionary spending and 20% toward savings or investments.
However, these ratios are guidelines and not rigid mandates. A 25-year-old graduate may find a 50/40/10 ratio more realistic while managing HECS debt and entry level income. Someone paying off their first mortgage may well consider a 60/30/10 split. And someone in their 60s may comfortably reach a 40/30/30 split if their mortgage is paid off and their children are independent.
But regardless of the exact ratio, the lesson from this rule is around discipline to invest or save consistently. Even if you are starting with a small ratio of your income, the habit of regular allocation can put you in good stead for the future.
2. The rule of 72: Understanding compounding’s timeline
Almost every investor would prefer to be wealthy sooner rather than later. But how long might it take for an investor to actually reach their financial goals?
Some clues may lie in the rule of 72. Dividing 72 by the annualised return gives investors an estimate of how many years it will take to double their capital. In the following chart, we have used the 10-year annualised returns of the six familiar asset classes, represented by five major equity indices and gold, all in AUD terms) to illustrate the Rule of 72 in action.
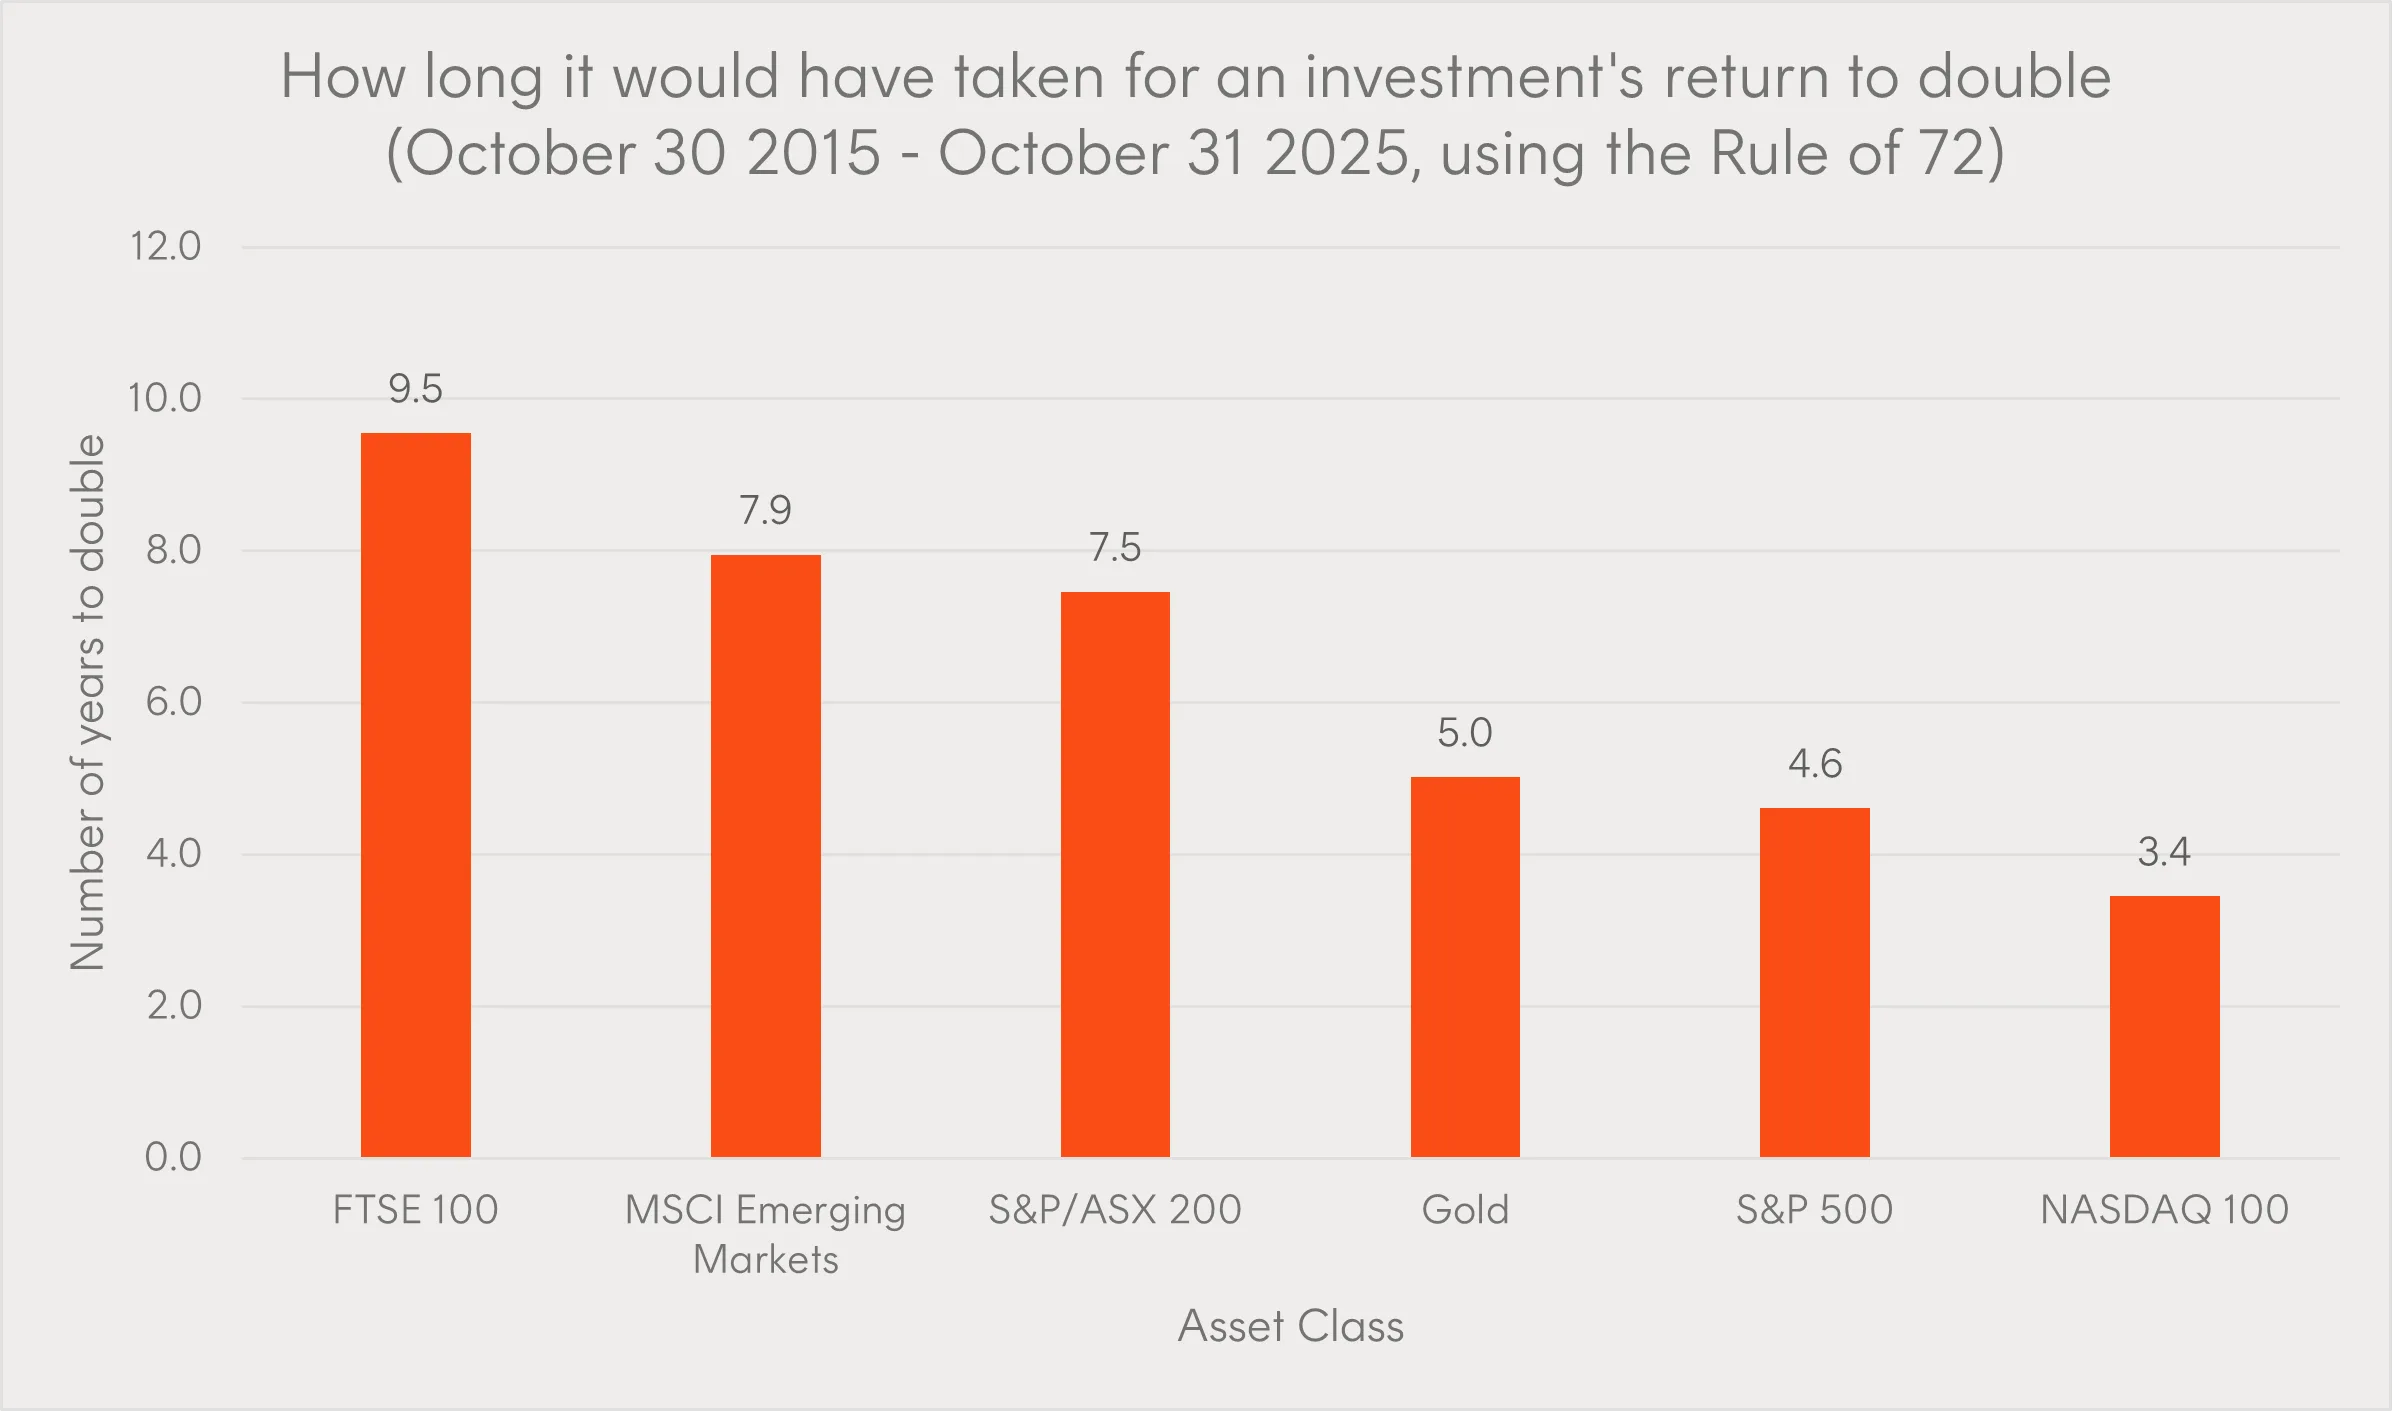
Source: Bloomberg, Betashares. Return figures are for 10-year periods ending on 31 October 2025. Selected index returns based on 10 year annualised returns: FTSE 100: 7.54% p.a. MSCI Emerging Markets Index: 9.06% p.a. S&P/ASX 200: 9.65% p.a. Gold: 14.35% p.a. S&P 500: 15.62% p.a. NASDAQ 100: 20.89% p.a. Past performance is not an indicator of future performance. You cannot invest directly in an index. Returns shown do not account for any management fees and costs, distributions or taxes. For illustrative purposes only.
For instance, if we used the S&P/ASX 200’s 10-year annualised return of 9.65% p.a., the starting capital would double every 7.5 years if future returns matched this historical rate. In contrast, if we used the NASDAQ 100’s 10-year annualised return of 20.89% p.a., the starting capital would take 3.4 years to double under the same assumption. Note all of these figures are as at 31 October 2025 and that these are hypothetical examples only – future returns may differ significantly from historical performance.
Nonetheless, this example reveals why time in market matters more than timing the market. Consider an Australian investor with $200,000 in superannuation at age 55. At a 6% p.a. return, and using the rule of 72, that balance would double to $400,000 by age 67 – without additional contributions or withdrawals. An investor who begins regular contributions at a young age and maintains them until retirement could see substantially greater growth over time.
The rule of 72 can also help set realistic return expectations. While chasing 15% annual returns might double money every five years, it typically requires accepting volatility that can just as easily halve capital during downturns.
3. The 60/40 rule: Portfolio construction made easy
Portfolio construction can paralyse investors caught between diversification and conviction. The 60-40 rule is one approach that could mitigate that.
In essence, it is a structure that divides capital into two purposes:
- Equities – represented by single stocks or low-cost broad market ETFs – make up 60% of the portfolio.
- Fixed income – represented by bond ETFs or funds – make up the other 40% of the portfolio.
The 60/40 split serves as a guide rather than a rigid rule. An investor with higher risk tolerance might shift to an 80/20 allocation or even 100/0 for young accumulators, while someone more conservative could opt for a 40/60 combination.
Some investors have gone a step further and created a 40/40/20 allocation: 40% equities, 40% bonds and 20% alternatives like commodities or private assets. What matters is understanding the role of each asset class in portfolio construction and choosing an allocation that matches your risk appetite and maintaining it through market cycles. Seeking the assistance of a financial adviser can help investors determine these levels.
4. The 4% rule: Converting capital into sustainable income
In 1994, financial planner William Bengen analysed 66 years of US stock and bond market returns to determine how much retirees could safely withdraw each year. His research suggested 4% as the maximum annual withdrawal rate that would preserve capital over a 30-year retirement, assuming a balanced portfolio, though it does not account for individual tax considerations.
While this rule originated from the US, it is still a great rule that supports the importance of retirement income planning.
Understanding required retirement income allows investors to structure portfolios for appropriate compounding growth before retirement. The 4% rule can also help investors of all ages estimate their retirement capital needs. For perspective, maintaining a $40,000 annual income for 30 years would require approximately $1 million in invested capital outside superannuation.
|
Total amount invested |
Target yearly income at 4% of total amount invested |
Target monthly income |
Target weekly income |
|
$3,000,000 |
$120,000 |
$10,000 |
$2,307.69 |
|
$2,000,000 |
$80,000 |
$6,666.67 |
$1,538.46 |
|
$1,000,000 |
$40,000 |
$3,333.33 |
$769.23 |
|
$500,000 |
$20,000 |
$1,666.67 |
$384.62 |
|
$250,000 |
$10,000 |
$833.33 |
$192.31 |
For illustrative purposes only. Does not take into account any fees, expenses, taxes or distributions.
In the Australian context, regulatory requirements diverge from this approach. Australia imposes government-mandated minimum withdrawals starting at 5% annually from age 65. This number increases as retirees age – making careful retirement planning and diversified income sources increasingly important for long-term financial security.
Making these numbers work
Building wealth that lasts rarely requires perfect timing or access to exclusive information. It requires steady discipline, clear principles and the confidence to stay invested when others panic. With the help of these four financial ratios, investors can learn how to measure their progress, adjust their strategy and, ultimately, achieve their long-run financial aspirations.