Betashares
11 minutes reading time
- The Australian ETF industry closed the year with an all time high in funds under management (FUM), hitting a range of new records in terms of assets and net flows – including inflows to International and Australian equities, fixed income and gold
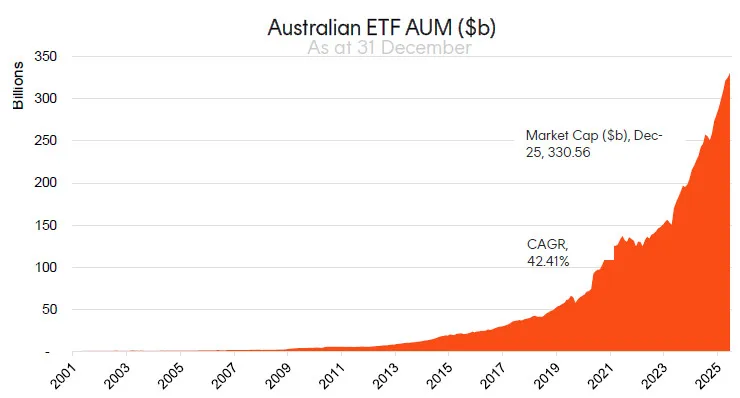
- FUM: The Australian ETF industry ended the year at an all time high, with the total industry market capitalisation sitting at $330.6B, representing 34.2% year on year growth. The industry grew $84.3B in 2025 – an industry record in terms of annual growth
- Net Flows: ETF industry flows shattered the record set in 2024, with net new money for the year of $53B, well clear of the $30B of net flows received in 2024 (it in fact passed that mark in August)
- Trading: The Australian ETF industry continued to experience strong trading values, annual ASX ETF trading value increased 39% on 2024. In total, a record $196B of ETF value was traded on the ASX (compared to $141B in 2024)
- Issuer Flows: Flows remain concentrated despite an increase in the number of new issuers joining the market. Vanguard, Betashares and iShares were the top three issuers in terms of flows this year, recording ~$37.5B in net inflows between them. Collectively, the top 3 issuers this year (Vanguard, Betashares and iShares) took over 70% of industry flows.
- Product Launches: It was another big year for new product development, with a record 71 new ETFs launching during 2025, while 15 funds closed during the year – for a net product change of 56 ETFs
- Active/Passive flows: In terms of product types, 2025 was all about passive investing, with funds of this type receiving $38.9B in inflows. Smart beta funds received $8.2B while Active ETFs were third at $6.3B (despite a significant number of Active ETF launches)
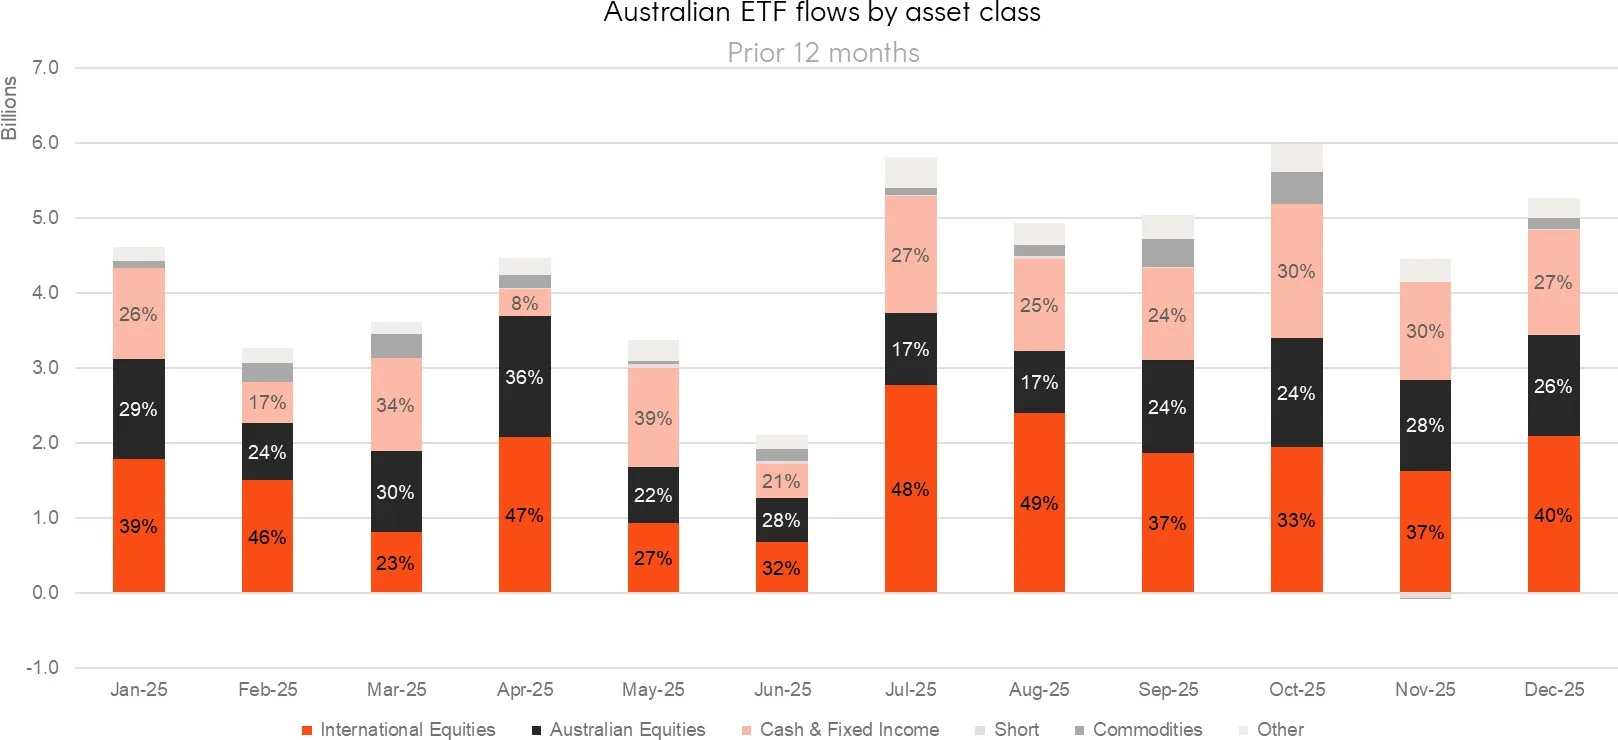
- Flows by category: All major asset classes broke records in terms of net flows during 2025. Investors favoured International Equities, followed by Australian Equities and then Fixed Income ETFs. Gold ETFs also had their best year on record in terms of inflows, receiving $1.8B in 2025 – passing the previous record set in 2020.
- International equities ETFs remained in first place receiving $20.9B of net inflows (v. $15.1B in 2024)
- Australian Equities ETFs came in 2nd with $13.2B in flows (vs $7.1B in 2024)
- Fixed Income ETFs came in 3rd, with $11.6B received (vs $6.1B in 2024)
- Performance: It was gold miner and energy transition metal ETFs that topped the performance tables for the ETF industry for 2025. Specifically, the MNRS Global Gold Miners Currency Hedged ETF topped the performance table with a 148.84% return during 2025.
- Industry Forecast: In our year-end report for 2024, we wrote: “Looking ahead, we expect the ETF industry will exceed $300B by the end of 2025 should market conditions remain positive.”
While we were correct regarding positive inflows and market growth, we again underestimated the scale of net flows by some margin, while market conditions assisted the growth in market size.
With respect to 2026, we believe the ETF industry will pass $400B during 2026 with monthly inflows to remain consistently above $5B. We also forecast that the industry will exceed $500 billion during 2028 – although it’s increasingly likely that this may even occur in 2027.
Market Size and Growth: End of Year 2025
Market Cap
- Australian ETFs Market Cap (ASX + CBOE): $330.6B – new all time high
- ASX CHESS Market Cap: $282.5B1
- Market Cap increase for the year: 34.2%, $84.3B – industry record $ annual growth
Net Flows
- Net flows for the year: $53B – significant increase in net flows compared to $30B last year
Issuers and Products
- 453 Exchange Traded Products trading on the ASX & CBOE
- New products: 71 new products launched in the year
- There are currently 65 issuers of ETFs in Australia
Trading Value
- Annual ASX trading value was a record $196B (39% higher compared to 2024)
Performance
It was gold miner and energy transition metal ETFs that topped the performance tables for the ETF industry for 2025. Specifically, the Betashares Global Gold Miners Currency Hedged ETF (ASX: MNRS) led with a 148.84% return during 2025.
1Since February 2023, the ASX started reporting additional data on a CHESS-only basis. The primary use of such data is that it will exclude, amongst other things, the FUM and Flows in ‘dual class’ Active ETFs and potentially provide a more accurate picture of exchange traded activity.
Top 10 products: End of Year 2025
|
Ticker |
Product |
Issuer |
Market Cap |
Rank Movement |
2024 Rank |
2025 Rank |
|
|
VAS |
Vanguard Australian Shares Index ETF |
Vanguard |
$22,585,311,471 |
– |
1 |
1 |
|
|
VGS |
Vanguard MSCI Index International Shares ETF |
Vanguard |
$14,192,453,264 |
+1 |
3 |
2 |
|
|
IVV |
iShares S&P 500 ETF |
iShares |
$13,110,350,204 |
-1 |
2 |
3 |
|
|
A200 |
Betashares Australia 200 ETF |
Betashares |
$8,879,818,425 |
+2 |
6 |
4 |
|
|
QUAL |
VanEck Vectors MSCI World Ex-Australia Quality ETF |
VanEck |
$8,069,512,690 |
– |
5 |
5 |
|
|
IOZ |
iShares Core S&P/ASX 200 ETF |
iShares |
$7,798,195,765 |
+1 |
7 |
6 |
|
|
NDQ |
BetaShares NASDAQ 100 ETF |
Betashares |
$7,690,159,961 |
+1 |
8 |
7 |
|
|
DACE |
Dimensional Australian Core Equity Trust (Managed Fund) |
Dimensional |
$6,434,462,640 |
+3 |
11 |
8 |
|
|
MGOC |
Magellan Global Fund (Open Class) (Managed Fund) |
Magellan |
$6,372,438,808 |
-5 |
4 |
9 |
|
|
VTS |
Vanguard US Total Market Shares Index ETF |
Vanguard |
$6,361,059,526 |
-1 |
9 |
10 |
There was one new entrant to the top funds leaderboard over 2025. The biggest move was MGOC, falling 5 places on the leaderboard and is no longer the largest Active ETF in Australia.
|
Top 10 Inflows (by $) – 2025 |
||
|
Ticker |
Product |
Inflow Value |
|
VAS |
Vanguard Australian Shares Index ETF |
$3,044,602,013 |
|
VGS |
Vanguard MSCI Index International Shares ETF |
$2,590,778,855 |
|
A200 |
Betashares Australia 200 ETF |
$2,101,781,675 |
|
VBND |
Vanguard Global Aggregate Bond Index (Hedged) ETF |
$1,628,273,251 |
|
VHY |
Vanguard Australian Shares High Yield ETF |
$1,616,628,511 |
|
VGAD |
Vanguard MSCI Index International Shares (Hedged) ETF |
$1,410,638,044 |
|
BGBL |
Betashares Global Shares ETF |
$1,402,378,171 |
|
SUBD |
VanEck Vectors Australian Subordinated Debt ETF |
$1,166,404,739 |
|
IVV |
iShares S&P 500 ETF |
$1,145,137,672 |
|
AAA |
Betashares Australian High Interest Cash ETF |
$1,096,554,609 |
Core allocations remained the preference for investors in 2025, with the largest flows going to broad market Equity ETFs. However, Cash and Fixed Income was also well represented in the top 10 list as investors continue to allocate to the asset class.
|
Top 10 Outflows (by $) – 2025 |
||
|
Ticker |
Product |
Inflow Value |
|
MGOC |
Magellan Global Fund (Open Class) (Managed Fund) |
-$1,296,412,166 |
|
MHHT |
Magellan High Conviction Trust (Managed Fund) |
-$453,014,311 |
|
AMVE |
AB Managed Volatility Equities Fund (Managed Fund) |
-$310,390,654 |
|
XALG |
Alphinity Global Equity Fund (Managed Fund) |
-$232,007,465 |
|
FRGG |
Franklin Global Growth Fund (Managed Fund) |
-$205,947,063 |
|
MICH |
Magellan Infrastructure Fund (Currency Hedged) (Managed |
-$154,785,856 |
|
PIXX |
Platinum International Fund (Quoted Managed Hedge Fund) |
-$147,269,226 |
|
GBND |
BetaShares Sustainability Leaders Diversified Bond ETF – |
-$140,391,766 |
|
USTB |
Global X US Treasury Bond (Currency Hedged) ETF |
-$109,661,238 |
|
XARO |
ActiveX Ardea Real Outcome Bond Fund (Managed Fund) |
-$102,339,480 |
Magellan’s Global Fund had the highest outflows, with $1.3B.
By Average Daily Trading Value (12 month)
|
Ticker |
Product |
Issuer |
ADTV 12 month |
Rank Movement |
|
VAS |
Vanguard Australian Shares Index ETF |
Vanguard |
$49,327,425 |
– |
|
AAA |
Betashares Australian High Interest Cash ETF |
BetaShares |
$36,302,500 |
– |
|
IVV |
iShares S&P 500 ETF |
iShares |
$33,292,205 |
+1 |
|
VGS |
Vanguard MSCI Index International Shares ETF |
Vanguard |
$25,394,555 |
+2 |
|
A200 |
Betashares Australia 200 ETF |
BetaShares |
$22,170,725 |
-2 |
|
IOZ |
iShares Core S&P/ASX 200 ETF |
iShares |
$21,067,665 |
-1 |
|
NDQ |
BetaShares NASDAQ 100 ETF |
BetaShares |
$20,834,415 |
– |
|
GOLD |
Global X Physical Gold |
Global X |
$17,804,540 |
+3 |
|
VHY |
Vanguard Australian Shares High Yield ETF |
Vanguard |
$14,116,120 |
+5 |
|
STW |
SPDR S&P/ASX 200 |
State Street |
$13,117,155 |
-1 |
The Australian ETF industry continued to experience strong trading values, annual ASX ETF trading value increased 39% on 2024. In total, a record $196B of ETF value was traded on the ASX (compared to $141B in 2024)
New product launches – 2025
It was another big year for new product development, with a record 71 new ETFs launching during 2025, while 15 funds closed during the year – for a net product change of 56 ETFs.
Analysis of Inflows: 2025
|
Product Style |
Inflow Value |
2025 (%) |
2024 (%) |
2023 (%) |
2022 (%) |
2021 (%) |
|
Index |
$38,909,156,299 |
74% |
81% |
91% |
99% |
83% |
|
Smart Beta |
$8,204,021,327 |
16% |
21% |
15% |
19% |
9% |
|
Active |
$5,746,576,208 |
11% |
-2% |
-6% |
-19% |
8% |
Passive exposures again led the way for flows in 2025, largely via market cap oriented passive ETFs, which received 74% of total flows. Smart beta products received ~16% of flows, whilst Active ETFs saw increased net inflows to 11%, a turn around from the net outflows observed in in 2024.
|
Top 5 Category Inflows (by $) – 2025 |
||
|
Category |
Inflow Value |
Rank Movement |
|
International Equities |
$20,507,089,766 |
– |
|
Australian Equities |
$13,182,520,928 |
– |
|
Fixed Income |
$11,615,022,843 |
– |
|
Commodities |
$2,213,345,394 |
+1 |
|
Cash |
$2,035,452,991 |
+1 |
|
Top 5 Sub-Category Inflows (by $) – 2025 |
||
|
Sub-Category |
Inflow Value |
Rank Movement |
|
International Equities – Developed World |
$9,942,943,777 |
– |
|
Australian Equities – Broad |
$9,494,386,726 |
– |
|
Australian Bonds |
$8,139,251,575 |
+1 |
|
International Equities – US |
$4,364,251,565 |
-1 |
|
Global Bonds |
$3,297,201,547 |
+1 |
All major asset classes broke records in terms of net flows during 2025. Investors favoured International Equities followed by Australian Equities and then Fixed Income ETFs. Gold ETFs also had their best year on record in terms of inflows after receiving $1.8B in 2025 – passing the previous record set in 2020.
No broad categories received outflows.
|
Category 4 |
Inflow Value |
|
Fixed Income – E&R – Ethical |
-$79,280,390 |
|
Australian Equities – Short |
-$28,378,452 |
|
Oil |
-$14,725,519 |
|
Australian Equities – E&R – Impact |
-$7,084,391 |
Performance
Top Performing Products – 2025
|
Ticker |
Product Name |
Performance (%) |
|
MNRS |
Betashares Global Gold Miners Currency Hedged ETF |
148.84% |
|
GDX |
VanEck Gold Miners ETF |
138.68% |
|
ETPMAG |
Global X Physical Silver |
130.11% |
|
ETPMPT |
Global X Physical Platinum |
104.90% |
|
XMET |
Betashares Energy Transition Metals ETF |
96.25% |
|
IKO |
iShares MSCI South Korea Capped Index ETF |
81.14% |
|
GMTL |
Global X Green Metal Miners ETF |
80.49% |
|
WIRE |
Global X Copper Miners ETF |
78.42% |
|
ETPMPM |
Global X Precious Metals Basket |
72.17% |
|
QAU |
Betashares Gold bullion ETF – Currency Hedged |
62.70% |
It was gold miner and energy transition metal ETFs that topped the performance tables for the ETF industry for 2025. Specifically, MNRS led the performance table with a 148.84% return during 2025.
ETF manager inflows –2025
|
Provider |
Inflow Value |
% Industry |
|
Vanguard |
$15,895,242,636 |
30.1% |
|
Betashares |
$13,692,648,572 |
25.9% |
|
iShares |
$7,940,346,666 |
15.0% |
|
VanEck |
$5,383,534,681 |
10.2% |
|
Global X |
$2,853,187,123 |
5.4% |
|
Macquarie |
$1,191,884,917 |
2.3% |
|
Pinnacle |
$1,186,728,473 |
2.2% |
|
State Street |
$1,171,609,572 |
2.2% |
|
Dimensional |
$885,731,863 |
1.7% |
|
Coolabah Capital Investments |
$875,187,836 |
1.7% |
|
Perth Mint |
$579,446,022 |
1.1% |
|
Lazard |
$447,043,614 |
0.8% |
|
Talaria Asset Manage |
$385,178,944 |
0.7% |
|
Perpetual |
$371,337,952 |
0.7% |
|
GCQ |
$248,336,916 |
0.5% |
|
JPMorgan |
$234,169,074 |
0.4% |
|
Schroder |
$230,222,542 |
0.4% |
|
Munro Partners |
$214,881,168 |
0.4% |
|
Russell |
$173,817,154 |
0.3% |
|
L1 Capital |
$162,203,841 |
0.3% |
|
Monochrome |
$154,411,620 |
0.3% |
|
Hyperion |
$153,274,249 |
0.3% |
|
Janus Henderson |
$130,369,648 |
0.2% |
|
Loftus Peak |
$122,200,749 |
0.2% |
|
Pimco |
$106,503,809 |
0.2% |
|
Aoris |
$105,762,752 |
0.2% |
|
Franklin Templeton |
$96,287,215 |
0.2% |
|
Ausbil Investment Management |
$92,638,040 |
0.2% |
|
Morningstar |
$61,407,940 |
0.1% |
|
ETF Shares |
$53,684,998 |
0.1% |
|
First Sentier Investors |
$44,377,608 |
0.1% |
|
Montgomery |
$42,922,696 |
0.1% |
|
Investors Mutual Limit |
$40,935,185 |
0.1% |
|
Antipodes |
$39,322,454 |
0.1% |
|
Nanuk Asset Management |
$35,441,288 |
0.1% |
|
Bennelong Funds Man |
$30,134,654 |
0.1% |
|
Seed Funds Management |
$22,417,210 |
0.0% |
|
Fidelity |
$16,024,912 |
0.0% |
|
Lakehouse Capital |
$13,114,248 |
0.0% |
|
Kapstream |
$11,530,750 |
0.0% |
|
Triple Eight Capital |
$11,048,771 |
0.0% |
|
India Avenue |
$10,289,818 |
0.0% |
|
Perennial |
$7,772,764 |
0.0% |
|
DigitalX Asset Management |
$7,608,998 |
0.0% |
|
Elstree |
$6,074,566 |
0.0% |
|
Avantis |
$4,190,123 |
0.0% |
|
Ironbark Asset Manag |
$4,031,875 |
0.0% |
|
Paradice |
$2,479,774 |
0.0% |
|
Australian Ethical |
$2,346,917 |
0.0% |
|
Savana |
$744,951 |
0.0% |
|
abrdn |
$337,640 |
0.0% |
|
Income Asset Manage |
-$25,071 |
0.0% |
|
Ellerston |
-$1,270,716 |
0.0% |
|
K2 Asset Management |
-$3,096,890 |
0.0% |
|
Apostle Funds Management |
-$3,744,697 |
0.0% |
|
Switzer |
-$4,736,552 |
0.0% |
|
Milford |
-$4,928,685 |
0.0% |
|
Lanyon |
-$9,657,529 |
0.0% |
|
Hejaz |
-$13,050,567 |
0.0% |
|
Investsmart |
-$17,805,331 |
0.0% |
|
Claremont Global |
-$31,581,739 |
-0.1% |
|
Platinum |
-$237,320,860 |
-0.4% |
|
AllianceBernstein |
-$310,390,654 |
-0.6% |
|
Fidante |
-$338,940,681 |
-0.6% |
|
Magellan |
-$1,716,123,978 |
-3.2% |
Flows remain concentrated despite an increase in the amount of new issuers joining the market. Vanguard, Betashares and iShares were the top three issuers in terms of flows this year, recording ~$37.5B in net inflows between them. Collectively the top 3 issuers this year (Vanguard, Betashares and iShares) accounted for over 70% of industry flows.
Industry Report: December 2025
Market Cap & Net Flows
- Market Cap growth for the month: 1.74%, $5.7B
- Industry Net Flows: $5.3B
- New/closed products: 3 new ETFs launched this month
Trading Value
- ASX ETF trading value was $16B
Performance
- Precious metal ETFs were the top performing products for December 2025
Top 10 Products: December 2025
|
Top 10 Inflows (by $) – Month |
||
|
Ticker |
Product |
Inflow Value |
|
WBND |
Betashares Global Aggregate Bond Currency Hedged ETF |
$451,746,452 |
|
VAS |
Vanguard Australian Shares Index ETF |
$350,043,081 |
|
VGS |
Vanguard MSCI Index International Shares ETF |
$258,507,810 |
|
A200 |
Betashares Australia 200 ETF |
$218,819,115 |
|
IVV |
iShares S&P 500 ETF |
$212,172,891 |
|
VHY |
Vanguard Australian Shares High Yield ETF |
$188,774,612 |
|
SUBD |
VanEck Australian Subordinated Debt ETF |
$148,290,121 |
|
VGAD |
Vanguard MSCI Index International Shares (Hedged) ETF |
$122,368,137 |
|
VAF |
Vanguard Australian Fixed Interest Index ETF |
$121,659,509 |
|
PGA1 |
Plato Global Alpha Complex ETF |
$119,384,136 |
|
Top 10 Outflows (by $) – Month |
||
|
Ticker |
Product |
Inflow Value |
|
VBND |
Vanguard Global Aggregate Bond Index (Hedged) ETF |
-$181,806,078 |
|
MGOC |
Magellan Global Fund (Open Class) (Managed Fund) |
-$162,480,846 |
|
HGBL |
Betashares Global Shares Currency Hedged ETF |
-$64,185,770 |
|
FRGG |
Franklin Global Growth Fund (Managed Fund) |
-$41,373,273 |
|
TBIL |
VanEck 1-3 Month US Treasury Bond ETF |
-$25,354,381 |
|
MCSI |
MFG Core Infrastructure Fund (Managed Fund) |
-$20,263,065 |
|
GGOV |
Betashares U.S. Treasury Bond 20+ Year ETF – Currency Hedged |
-$16,985,943 |
|
USTB |
Global X US Treasury Bond (Currency Hedged) ETF |
-$14,830,345 |
|
MOAT |
VanEck Morningstar Wide Moat ETF |
-$14,803,165 |
|
TLRH |
Talaria Global Equity Fund Currency Hedged (Managed Fund) |
-$14,291,566 |
Industry Net Flows: December 2025
|
Top 5 Category Inflows (by $) – Month |
|
|
Broad Category |
Inflow Value |
|
International Equities |
$2,091,390,241 |
|
Australian Equities |
$1,351,511,974 |
|
Fixed Income |
$1,284,311,586 |
|
Multi-Asset |
$205,905,116 |
|
Commodities |
$143,250,596 |
|
Sub-Category |
Inflow Value |
|
Australian Equities – Broad |
$923,362,050 |
|
International Equities – Developed World |
$896,474,075 |
|
Australian Bonds |
$894,849,864 |
|
International Equities – US |
$494,482,818 |
|
Global Bonds |
$380,999,915 |
There were no outflows by broad category.
|
Sub-Category |
Inflow Value |
|
Australian Equities – Large Cap |
-$8,386,570 |
|
US Equities – Short |
-$2,462,224 |
|
Australian Equities – E&R – Impact |
-$658,809 |
|
Broad Commodities |
-$555,086 |
Performance
Top Performing Products – Month
|
Ticker |
Product Name |
Performance (%) |
|
ETPMAG |
Global X Physical Silver |
31.27% |
|
ETPMPT |
Global X Physical Platinum |
21.50% |
|
WIRE |
Global X Copper Miners ETF |
13.42% |
|
ETPMPM |
Global X Precious Metals Basket |
9.77% |
|
IKO |
iShares MSCI South Korea Capped Index ETF |
9.69% |