


Betashares
3 minutes reading time


- The Australian ETF industry surged past $300 billion following elevated inflows and positive market performance.
- Another month of inflows above $5 billion, combined with positive market performance, pushed the Australian ETF industry to a new record high of $309.3 billion in funds under management– a rise of $9.9 billion or 3.31%
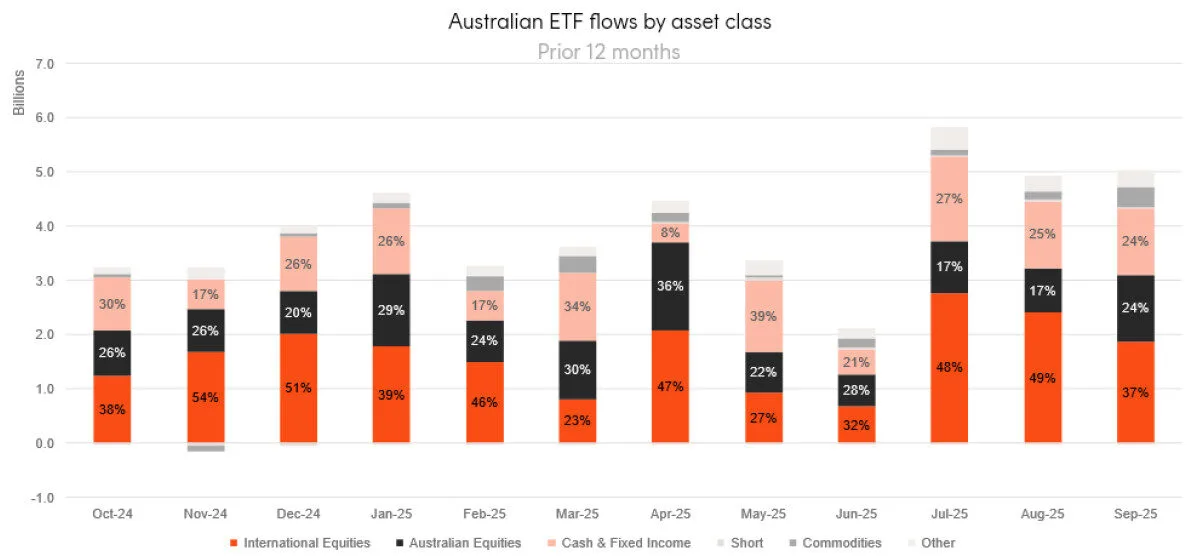
- Industry inflows for the month were an elevated $5 billion – the second time the industry has recorded inflows above $5 billion in a single month.
- ASX trading value was ~$16 billion in September
- Over the last 12 months the Australian ETF industry has grown by 36.3%, or $82.4 billion
- Five new funds, including the Betashares Wealth Builder Global Shares Geared (30-40% LVR) Complex ETF (ASX: GGBL), launched in September.
- The Betashares Global Gold Miners Currency Hedged ETF (ASX: MNRS) was the best performing fund.
- International Equity ETFs continued their streak of receiving the highest level of flows with $1.9 billion, Australian Equities returned to second place with $1.2 billion, while Fixed Income ($1.1 billion) rounded out the top three.
Australian ETF Industry AUM: July 2001 – September 2025
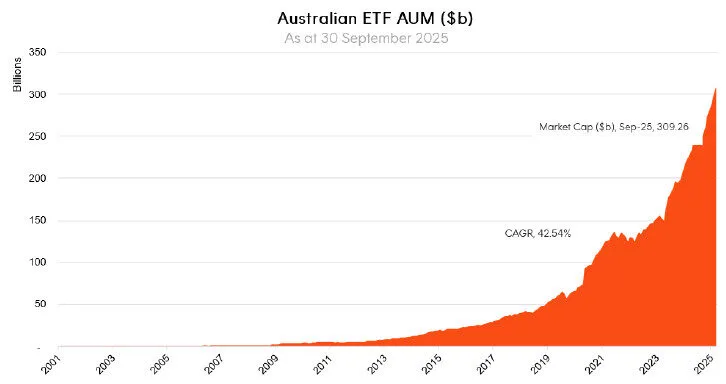
CAGR: Compound Annual Growth Rate. Source: ASX, CBOE
Top 10 Products
By Market Cap
|
Ticker |
Product |
Market Cap |
|
VAS |
Vanguard Australian Shares Index ETF |
$22,463,356,819 |
|
VGS |
Vanguard MSCI Index International Shares ETF |
$13,141,836,321 |
|
IVV |
iShares S&P 500 ETF |
$12,322,187,268 |
|
A200 |
Betashares Australia 200 ETF |
$8,463,575,669 |
|
IOZ |
iShares Core S&P/ASX 200 ETF |
$7,707,946,787 |
|
QUAL |
VanEck MSCI World Ex-Australia Quality ETF |
$7,673,330,146 |
|
NDQ |
Betashares NASDAQ 100 ETF |
$7,321,857,817 |
|
MGOC |
Magellan Global Fund (Open Class) (Managed Fund) |
$6,794,930,890 |
|
DACE |
Dimensional Australian Core Equity Trust (Managed Fund) |
$6,396,004,978 |
|
STW |
SPDR S&P/ASX 200 |
$6,252,247,979 |
Top 10 Inflows (by $) – Month
|
Ticker |
Product |
Market Cap |
|
VGS |
Vanguard MSCI Index International Shares ETF |
$254,363,852 |
|
IVV |
iShares S&P 500 ETF |
$243,371,538 |
|
VHY |
Vanguard Australian Shares High Yield ETF |
$201,836,077 |
|
BGBL |
Betashares Global Shares ETF |
$165,621,509 |
|
A200 |
Betashares Australia 200 ETF |
$164,124,671 |
|
SUBD |
VanEck Australian Subordinated Debt ETF |
$136,027,065 |
|
IOZ |
iShares Core S&P/ASX 200 ETF |
$120,085,308 |
|
NDQ |
Betashares NASDAQ 100 ETF |
$116,140,596 |
|
OZBD |
Betashares Australian Composite Bond ETF |
$112,005,057 |
|
VAS |
Vanguard Australian Shares Index ETF |
$111,899,734 |
Industry Net Flows
Top Category Inflows (by $) – Month
|
Broad Category |
Inflow Value |
|
International Equities |
$1,870,819,537 |
|
Australian Equities |
$1,231,630,226 |
|
Fixed Income |
$1,077,584,093 |
|
Commodities |
$378,137,539 |
|
Multi-Asset |
$209,559,578 |
Top Sub-Category Inflows (by $) – Month
|
Sub-Category |
Inflow Value |
|
Australian Bonds |
$886,742,842 |
|
Australian Equities – Broad |
$772,592,286 |
|
International Equities – US |
$618,408,378 |
|
International Equities – Developed World |
$575,394,021 |
|
International Equities – Sector |
$477,981,117 |
Top Category Outflows (by $) – Month
No outflows recorded by broad category
Top Sub-Category Outflows (by $) – Month
|
Sub-Category |
Inflow Value |
|
Fixed Income – E&R – ESG Lite |
-$29,893,724 |
|
International Equities – Europe |
-$12,338,456 |
|
International Equities – Geared |
-$8,813,094 |
|
Australian Equities – Short |
-$7,851,634 |
|
Fixed Income – E&R – Ethical |
-$4,503,862 |
Top Performing Products – Month
|
Ticker |
Product name |
Performance % |
|
MNRS |
Betashares Global Gold Miners Currency Hedged ETF |
22.56 |
|
HGEN |
Global X Hydrogen ETF |
19.59 |
|
GDX |
VanEck Gold Miners ETF |
19.44 |
|
WIRE |
Global X Copper Miners ETF |
19.35 |
|
CRYP |
Betashares Crypto Innovators ETF |
19.00 |