
Tom Wickenden
9 minutes reading time
August’s corporate reporting season came at a crucial period for the Australian share market, given it had recently risen to a 20x forward P/E for only the third time in the past 25 years1. At the ASX 200 level, earnings were negative for the second year in a row, falling 1.7% and 11.1% respectively from the 2024 and 2023 financial years2.
Earnings also came in 1.1% lower than expected at the start of the reporting season, and 17% below the peak expectations seen in June 2023, highlighting the extent of weakness over the past two years3.
Sector performance was mixed with poor Materials sector earnings (-19.8%) weighing heavily on the broader market and the very strong IT (26.4%) and Communication Services (26.9%) results having little impact, given these sectors’ relative weights in the index4.
|
Sector |
FY’25 YoY earnings |
|
ASX200 Communication Services |
26.90% |
|
ASX200 Information Technology |
26.40% |
|
ASX200 Industrials |
15.50% |
|
ASX200 Financials ex Property |
8.80% |
|
ASX200 Utilities |
6.30% |
|
ASX200 Healthcare |
5.80% |
|
ASX200 Property |
2.60% |
|
S&P/ASX 200 Weighted Avg |
-1.70% |
|
ASX200 Consumer Discretionary |
-1.80% |
|
ASX200 Consumer Staples |
-8.00% |
|
ASX200 Energy |
-8.90% |
|
ASX200 Materials |
-19.80% |
Source: FactSet data. As at 1 September 2025.
While beats and misses were broadly in line, just over half of the ASX 200 companies that report full-year earnings in August recorded growth from the year prior5. Market headlines were around price reaction volatility with a record 46% of stocks moving +/- 5% on earnings. There were particularly sizeable moves in large caps with significant reporting day price declines in names such as CSL, Woolworths, James Hardie, AGL and Amcor.
Against this backdrop, Betashares Australian Quality Leaders ETF (ASX: AQLT)’s 40 stock portfolio had another standout reporting period.
AQLT holds the largest companies, by market capitalisation, listed on the ASX but reweights them by quality metrics, namely high return on equity, earnings stability, and low levels of leverage, rather than market capitalisation. This translates to higher exposure to names like Telstra and Macquarie and lower exposure to BHP and CBA, alongside high-quality names from the mid and small caps, including Pro Medicus, HUB24 and Breville.
High quality earnings period
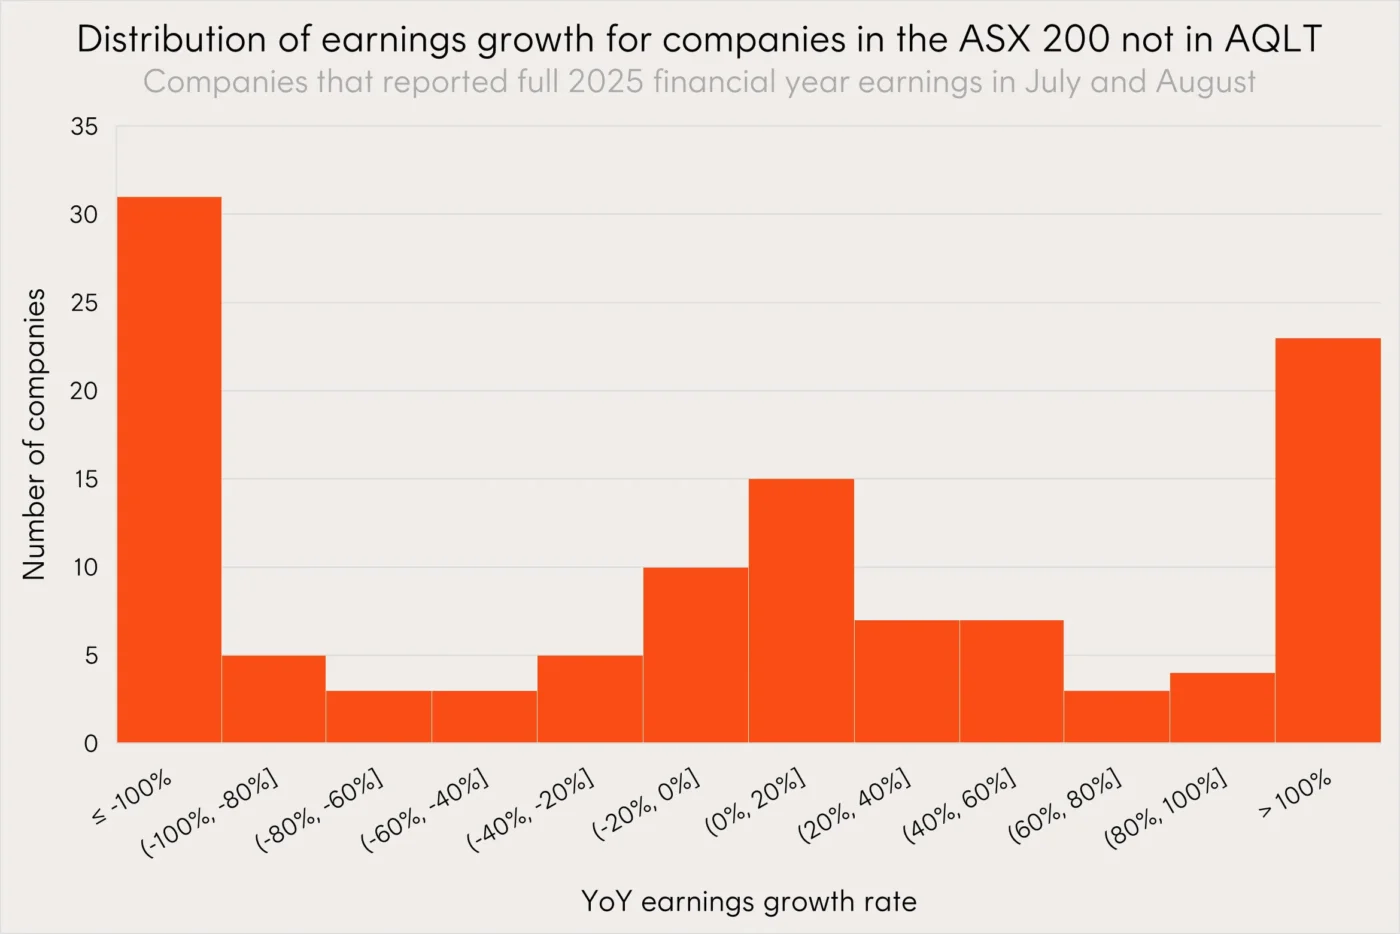
28 of AQLT’s 40 portfolio holdings reported full-year results this period, delivering a weighted average earnings growth rate of 14.5% – significantly higher than the ASX 200’s 1.7% decline6.
Of the companies that reported, only four reported negative YoY growth with eleven companies reporting growth of 20% or more. By comparison, nearly half of the ASX 200 companies not held in AQLT reported negative earnings growth.

Source: Bloomberg. As at 1 September 2025. AQLT is the Betashares Australian Quality ETF (ASX: AQLT). Past performance is not an indicator of future performance.
Source: Bloomberg. As at 1 September 2025. AQLT is the Betashares Australian Quality ETF (ASX: AQLT). Past performance is not an indicator of future performance.
The negative outlier in AQLT’s portfolio was construction and mining contractor NRW Holdings (ASX: NWH), which saw net income fall 74% due to margin pressures7.
Despite the drop in earnings, NRW’s share price has risen 12.1% from the date of reporting (21 August 2025 to 2 September 2025) as investors were encouraged by strong revenue growth (+12.2%) and the company’s record order book ($6.1bn)8. Margin recovery will be a key metric to watch in the coming year to restore strong net income growth.
Getting the big decisions right
Promisingly, AQLT avoided holding many of the large caps that suffered the most on reporting days including screening out Woolworths, James Hardie, AGL and Amcor. As AQLT maintains exposure to the ten companies that make up the top 50% of the ASX 200’s market capitalisation, it does hold CSL.
AQLT reweights these large cap companies by their quality metrics rather than their size. All re-weighted positions except BHP (-0.37%), due to a 2.2% underweight, and Westpac (-0.1%), due to a 0.6% underweight, led to relative outperformance from 1 July 2025 to 1 September 2025 versus the benchmark. AQLT’s slight underweight to CSL led to 0.1% of relative outperformance versus the ASX 200.
The following chart shows the average difference in weight for the large caps in AQLT’s portfolio compared to those same companies’ weights in the ASX 200 (the average active weight) and the relative returns that those weight differences led to for AQLT’s portfolio (the active return).
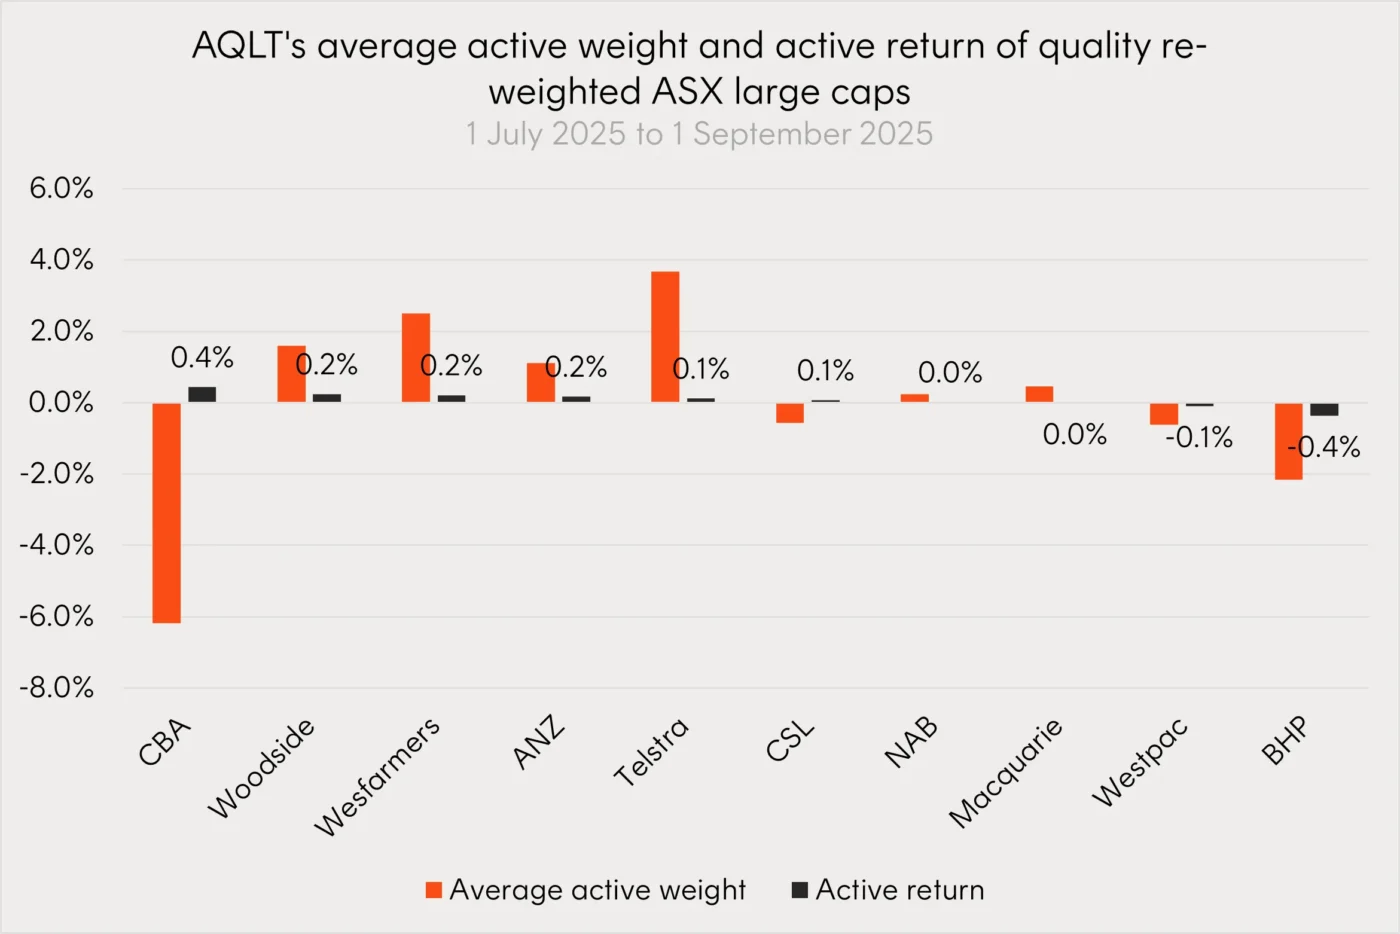
Source: Bloomberg, Betashares. Performance based on attribution data of Betashares Australian Quality ETF (AQLT) and ASX 200 Index from 1 July 2025 to 1 September 2025 and includes stocks held within AQLT during the period. There is no guarantee these stocks will remain in AQLT’s portfolio or be profitable investments. Past performance is not an indicator of future performance.
AQLT’s largest underweight position, CBA, has historically led to underperformance for the fund. However, despite an earnings report featuring record profits and the company’s largest full year dividend ever, CBA is trading down for the financial year.
Prior to its earnings, CBA was trading on a forward price to earnings ratio of 29x. For context, that is a similar figure to Apple and Microsoft, implying not only was there no room for error but consensus was not good enough as investors have been taking profits. This meant CBA, historically AQLT’s largest detractor, was the strongest large cap contributor to relative performance.
Strong outperformance driven by the majority of positions
Over the financial year to date, including the full reporting season, AQLT has outperformed the ASX 200 by 3.1%. The portfolio had 31 positive contributors and nine negative contributors. Only three companies detracted -0.2% or more from performance, while 16 companies added 0.2% or more – highlighting a strong positive skew in relative performance versus the ASX 200.
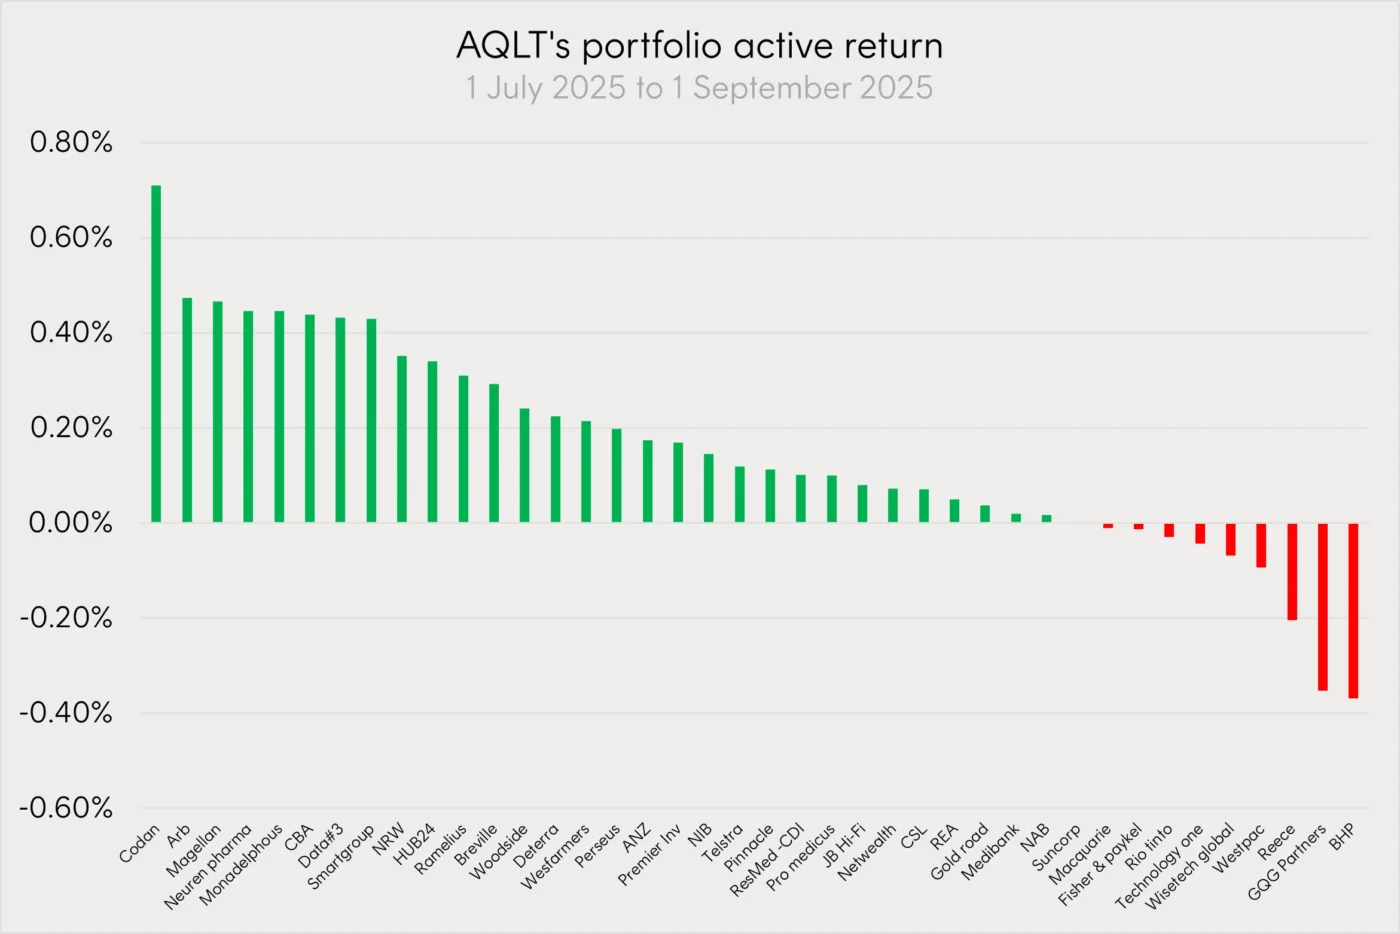
Source: Bloomberg, Betashares. Performance based on attribution data of Betashares Australian Quality ETF (AQLT) and Solactive Australia 200 Index from 24 June 2024 to 19 June 2025 and includes stocks held within AQLT during the period. There is no guarantee these stocks will remain in AQLT’s portfolio or be profitable investments. Past performance is not an indicator of future performance.
Neuren Pharmaceuticals (ASX: NEU), one of the worst performing stocks on the ASX last financial year as highlighted in our annual FY report card insight, was a standout in its August half year report (Neuren follows a calendar year financial reporting cycle). Neuren delivered record profit, increasing 88% YoY, driven by surging royalties for its signature drug, Daybue, with US sales almost doubling and further global expansion. AQLT maintained its position in the company in its most recent June rebalance, due to its strong quality characteristics, and has been rewarded with a 57.6% return since9.
Ramelius Resources (ASX: RMS) was a strong performer within the struggling Materials sector. Ramelius, a gold mining and production company, saw profits surge 119% YoY driven by both higher output and stronger gold prices. With robust free cash flow and strong cash and bullion positions, we believe Ramelius is well-positioned to continue benefiting from gold’s recent highs.10.
Finally, Monadelphous Group (ASX: MND), one of the highest quality ranking companies on AQLT’s last rebalance, reported a 34.6% YoY rise in net profits. Monadelphous, a leading engineering group to the resource, energy and infrastructure sectors, recorded record maintenance revenues alongside strong construction and engineering results highlighting the breadth of their income stream. Most promisingly, the group secured $2.5 billion of new contracts and lifted dividends by 24% underpinned by a strong cash position11.
Investment implications
In what was a volatile period for Australian equities and tricky market for stock pickers, AQLT’s basket of high-quality companies, on average, reported strong earnings growth and were rewarded in most cases with strong price performance.
AQLT can serve as the core of investor portfolios – balancing an allocation to Australia’s largest companies, re-weighted by their quality attributes, with a mix of Australia’s highest quality mid-caps. AQLT’s approach can help investors find higher earnings growth from the Australian market that, at the ASX 200 level, has suffered due to slower growth large cap companies.
Since its inception on 4 April 2022, AQLT has outperformed the ASX 200 by, on average, 5.07% p.a.12
For more information, please visit AQLT’s fund page here.
There are risks associated with an investment in AQLT, including market risk and non-traditional index methodology risk. Investment value can go up and down. An investment in the Fund should only be made after considering your particular circumstances, including your tolerance for risk. For more information on risks and other features of the Fund, please see the Product Disclosure Statement and Target Market Determination, both available on this website.
Betashares Capital Limited (ACN 139 566 868 / AFS Licence 341181) (“Betashares”) is the issuer of this information. It is general in nature, does not take into account the particular circumstances of any investor, and is not a recommendation or offer to make any investment or to adopt any particular investment strategy. Future results are impossible to predict. Actual events or results may differ materially, positively or negatively, from those reflected or contemplated in any opinions, projections, assumptions or other forward-looking statements. Opinions and other forward-looking statements are subject to change without notice. Investing involves risk.
To the extent permitted by law Betashares accepts no liability for any errors or omissions or loss from reliance on the information herein.
Sources:
1. Bloomberg. As at 1 September 2025. ↑
2. FactSet data. As at 1 September 2025. ↑
3. FactSet data. As at 1 September 2025. ↑
4. FactSet data. As at 1 September 2025. ↑
5. Bloomberg data. As at 1 September 2025. ↑
6. Bloomberg. As at 1 September 2025. ↑
7. NRW Holdings 2025 Full Year Results August 2025. ↑
8. NRW Holdings 2025 Full Year Results August 2025. ↑
9. Source: Neuren Pharmaceuticals Half Year Report August 2025. ↑
10. Source: Ramelius Resources Full Year Results August 2025. ↑
11. Source: Monadelphous Group Full Year Results August 2025. ↑
12. As at 31 August 2025. ↑