

Tom Wickenden
11 minutes reading time
Last quarter we backed US markets to continue climbing a wall of cautious optimism, Australia’s size rotation to continue, and discussed the next leg of Asian technology’s breakout needing to move beyond valuation expansion.
This quarter we look under the surface of the S&P/ASX 200’s muted Q4 returns, discuss ex-US outperformance and ponder what divergence in central bank policy pricing might mean for markets in the year ahead.
3 things we learned
Sector rotations beneath Australia’s subdued headline returns
The Australian market ended the year with a muted 0.9% Q4 decline. However, this headline figure masked significant moves under the surface.
Over the past few years both earnings growth and returns in Australia’s large cap space have been driven by the Financials sector. In fact, the second largest sector, Materials, had been the largest contributor to the ASX 200’s two consecutive financial years of earnings declines1.
Q4 marked a change in market leadership, Materials was the only sector to record meaningful returns – posting a gain of 13.0%. A rebound in forward earnings estimates for Materials also helped the ASX 200 find a local bottom in future expected earnings following years of decline2.
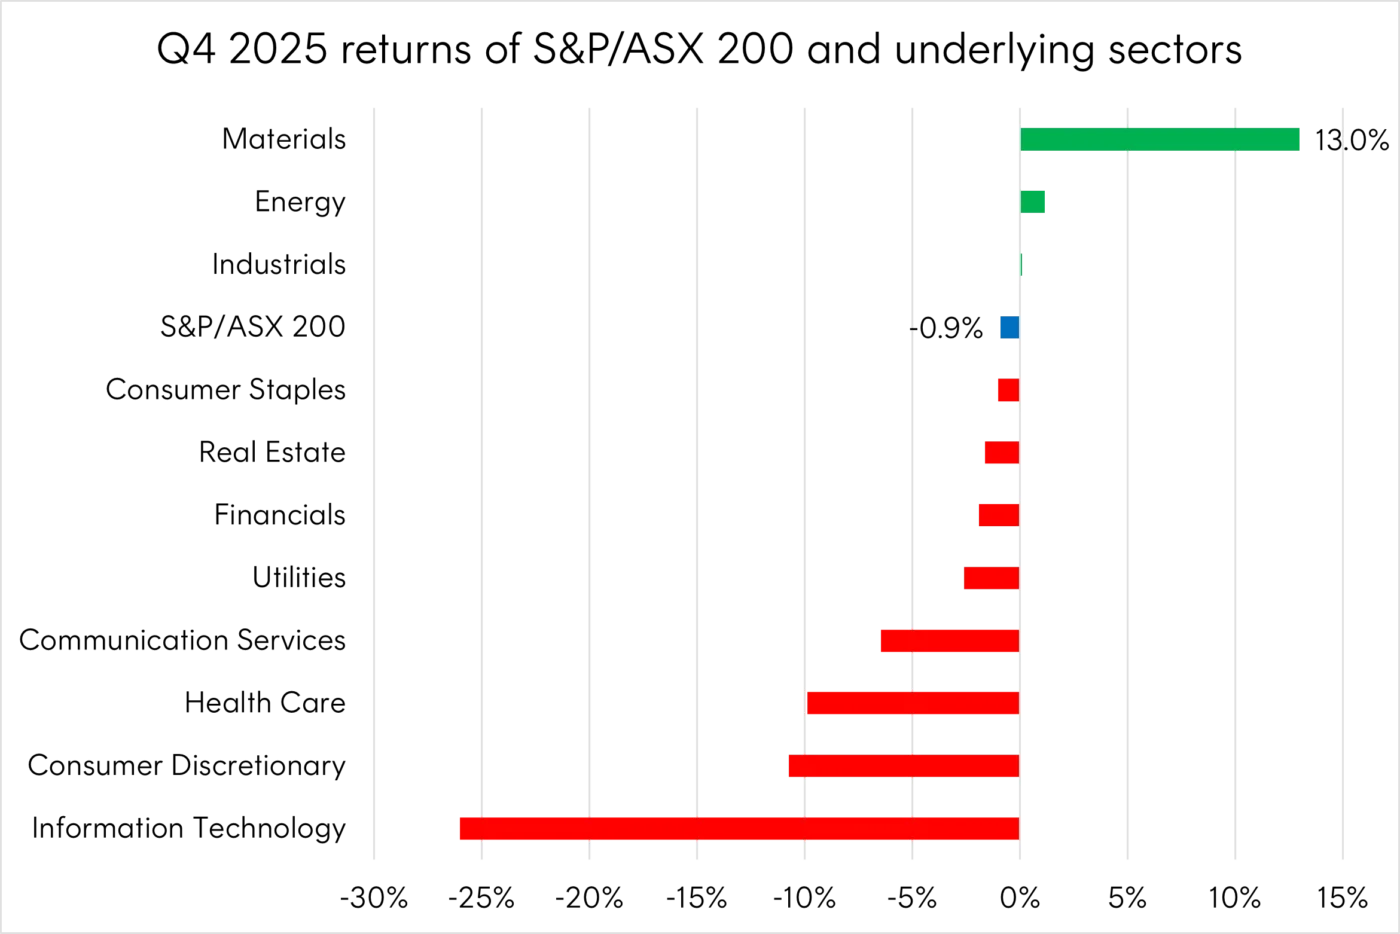
Source: Bloomberg. 1 October 2025 to 31 December 2025. You cannot invest directly in an index. Past performance is not an indicator of future performance.
The recovery in Materials was broad – 39 of the 44 companies in the ASX 200 Materials sector recorded positive returns in Q43.
Copper demand is being driven by the AI infrastructure buildout and energy transition, with BHP now the world’s largest producer deriving 45% of its earnings from copper – up from 29% a year ago4.
Iron ore has held above expectations, exceeding US$100 per tonne since August. Iron ore has been supported by China’s new property sector stimulus announced in late September which has prevented iron ore from collapsing below key levels but has been insufficient to drive a meaningful recovery in what was historically steel’s largest demand driver.
Meanwhile gold has been one of the best performing assets over the past few years, reaching a new record US$4,400 per ounce during Q4, supporting strong growth in Australian gold mining stocks. Australia’s gold exports grew 42% in the 2024-25 financial year and expectations are for a further 28% gain in the current FY. This trajectory would take the value of exports to $60bn which would make gold Australia’s second largest export after iron ore5.
The breadth of the Materials rally has also been the key contributor of Australia’s size rotation. Materials make up over 25% of the ASX Small Ords Index and, on average, Australia’s smaller miners experienced outsized gains in Q4 leading small caps to outperform large caps.
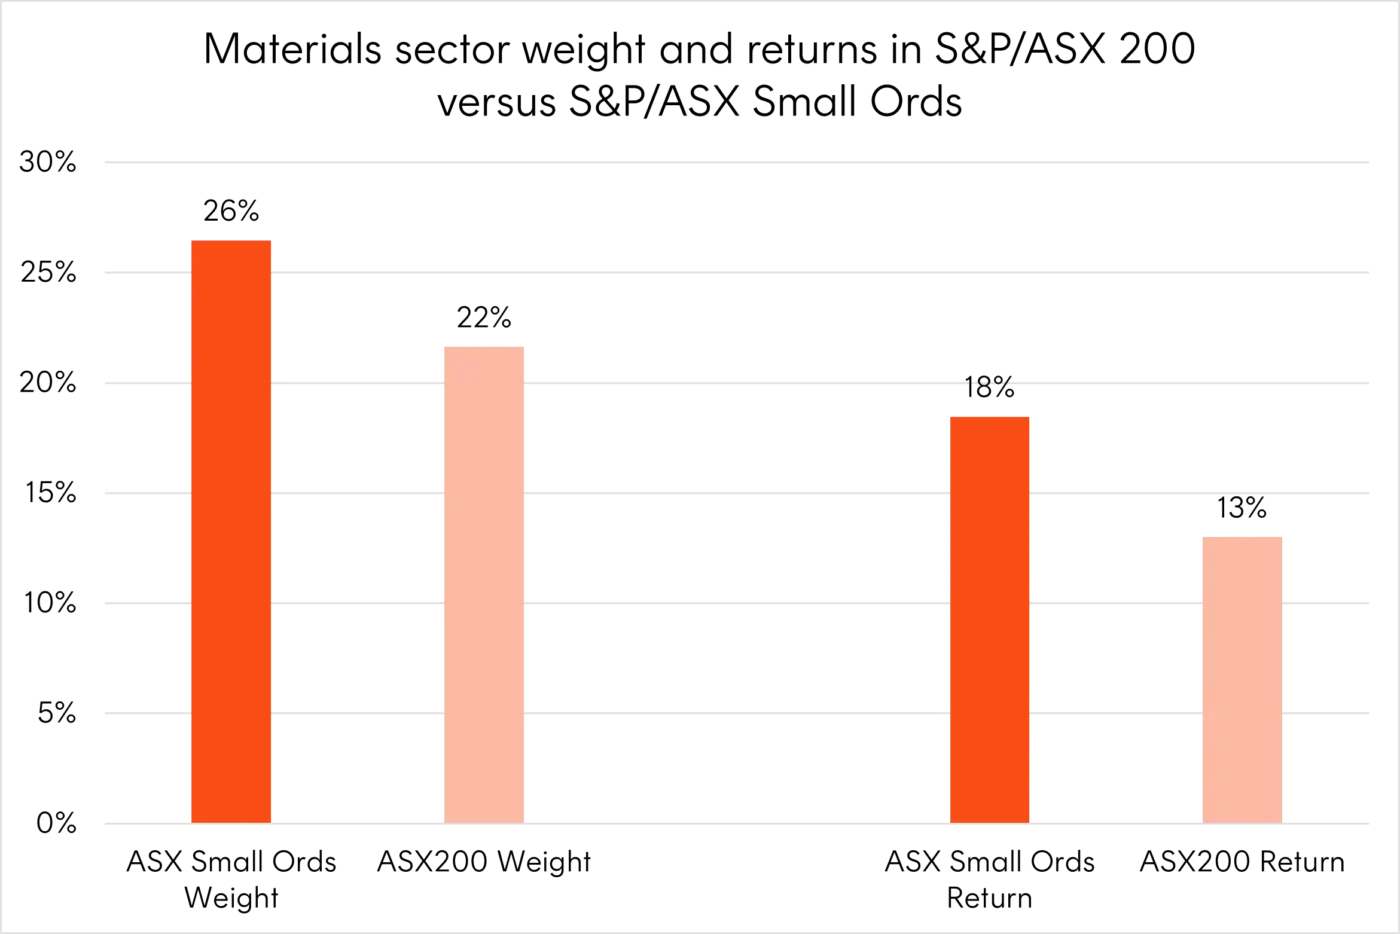
Source: Bloomberg. 1 October 2025 to 31 December 2025. You cannot invest directly in an index. Past performance is not an indicator of future performance.
Japan and India close out compelling ex-US year
Markets outside of the US delivered their strongest relative performance in several years during 2025 with the MSCI Emerging Markets and Solactive Developed Markets ex US ex Australia indices both returning over 30% in USD terms6. USD weakness contributed meaningfully to these returns in some instances.
While Europe and China dominated headlines during periods throughout the year investors returned to the strong structural stories of Japan and India in Q4.
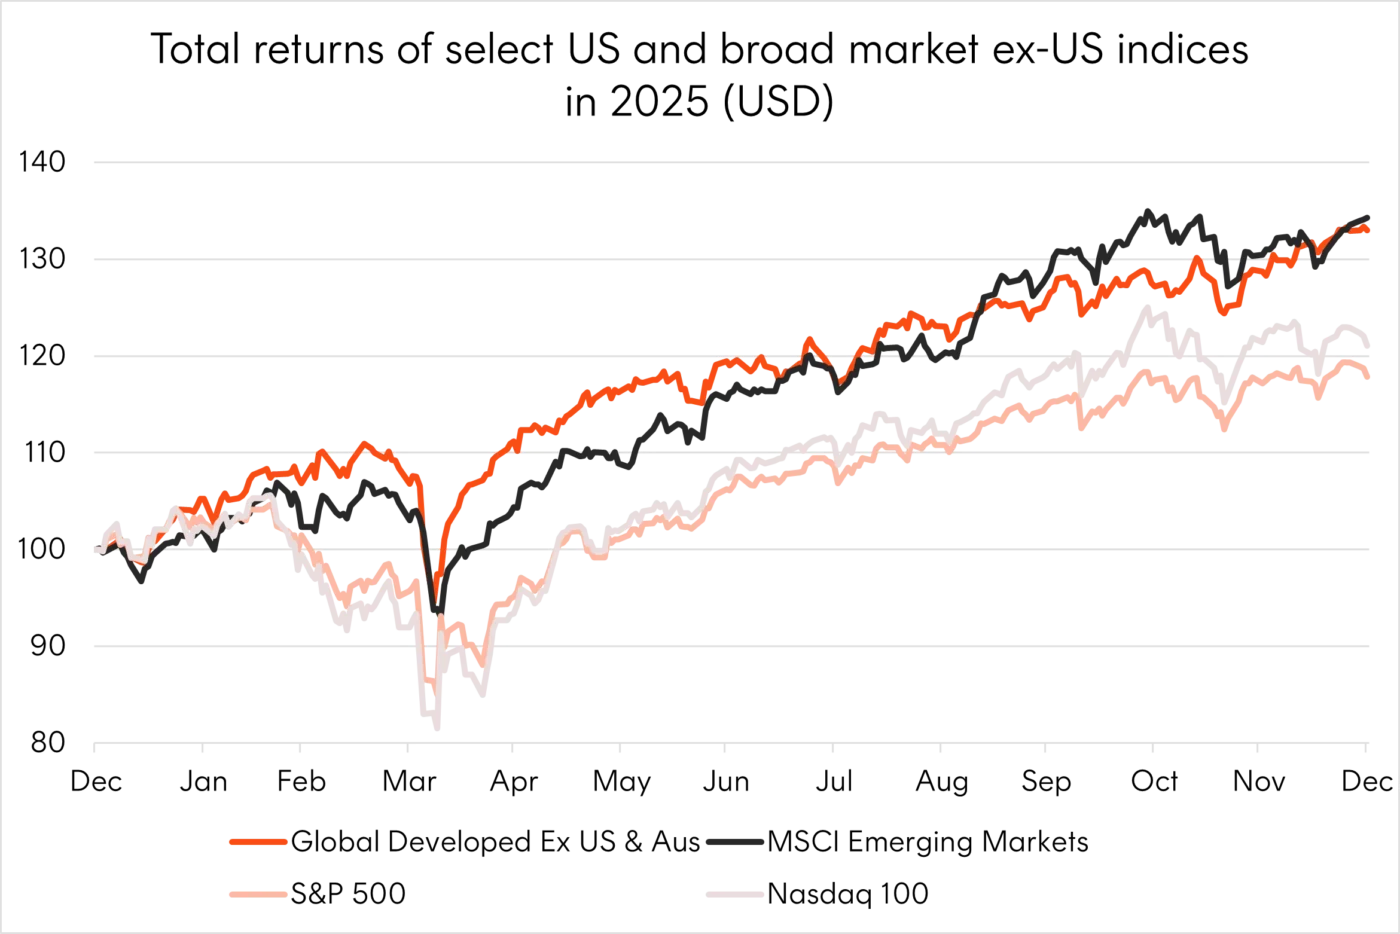
Source: Bloomberg. 31 December 2024 to 31 December 2025. Returns in USD. Global Developed Ex US & Aus represented by the Solactive GBS Developed Markets ex US ex Australia Large & Mid Cap AUD Index NTR. You cannot invest directly in an index. Past performance is not an indicator of future performance.
The appointment of Sanae Takaichi as Japan’s first woman prime minister in October injected fresh optimism into local markets, with investors viewing her pro-growth economic policies and ties to former Prime Minister Shinzo Abe’s agenda as supportive for equities.
The market’s strong Q4 performance reflected positive sentiment around ongoing fundamental shifts in Japan’s economic architecture. The Bank of Japan’s December rate hike to 0.75%, the highest level since 1995, furthers the decisive break from decades of ultra-loose monetary policy. While unconventional, the combination of rising rates and a weakening yen proved supportive for equity markets, as currency weakness boosted export competitiveness precisely when rates signalled economic confidence. Corporate Japan continues benefiting from improving governance, sustained wage growth, and the normalisation of inflation.
India’s path through the year to the start of Q4 proved more volatile and lacklustre compared to expectations. India suffered its worst relative performance in decades through the first three quarters of 2025 as substantial foreign flows into China came at the region’s expense. However, Indian equities staged a powerful year end recovery as foreign institutional investors turned net buyers for the first time in months.
The catalyst was substance over speculation. India’s GST 2.0 reform in September cut taxes on everyday consumer goods, supporting domestic spending. Meanwhile, economic growth forecasts were increased to over 7% for the current fiscal year after the July-September quarter delivered 8.2% growth7. Real progress on manufacturing incentives continued attracting investment, with Apple’s iPhone exports under India’s Production-Linked Incentive (PLI) scheme surpassing $50 billion in December8.
Finally, India’s Systematic Investment Plans (SIPs), which allow investors to make regular recurring payments into mutual funds, saw continued growth in 2025. Monthly SIP flows exceeded ~AU$5.2 billion in December9, helping to absorb over AU$25 billion in foreign selling during the year. These developments prompted markets to recognise that India’s structural growth story was delivering tangible results.
Both markets remain strong contenders for long-term growth. Alongside the Asian technology sector, they pose compelling growth alternatives to US mega-cap tech.
AI rally on notice
The fourth quarter presented the biggest test for US equity markets since their dramatic early year crash and rebound. Following losses to start the year, culminating in a three-day bear market after the Liberation Day tariff announcements, the tech heavy Nasdaq 100 had returned over 50% to mid-October leading global markets higher.
Unlike in H1, when the market narrative was dominated by policy uncertainty, it was fears over an AI bubble that dominated Q4.
In the second week of October, the Bank of England, IMF, Goldman Sachs, JPMorgan, and Morgan Stanley all independently released reports aimed at the AI-driven rally and whether it was becoming, or had already become, a bubble. This convergence of negative reports soured investor sentiment and raised the biggest questions yet over AI’s ultimate payoff.
The key questions that have been asked are around:
- Valuations: With measures used by some, like the P/E ratio of the S&P 500, approaching or exceeding dot-com bubble levels
- Market concentration: Extreme levels of market concentration in a small number of companies with related earnings drivers
- Capital expenditure: The amount of money being spent and planned on AI infrastructure rollout exceeds any equivalent in history
- AI’s return on investment (ROI): The ultimate profits required to justify current investment levels would therefore need to be historically unprecedented
- Debt and financing: Concerns around growing levels of debt issuance from AI companies alongside circular financing deals
In a special edition of our weekly newsletter, three of my colleagues tackled these questions from a historical, credit and equity market perspective ultimately remaining positive at this stage of the market cycle whilst outlining clear signs for investors to keep an eye on.
2 charts we’re watching
1 – China’s dominance in critical future-economy sectors
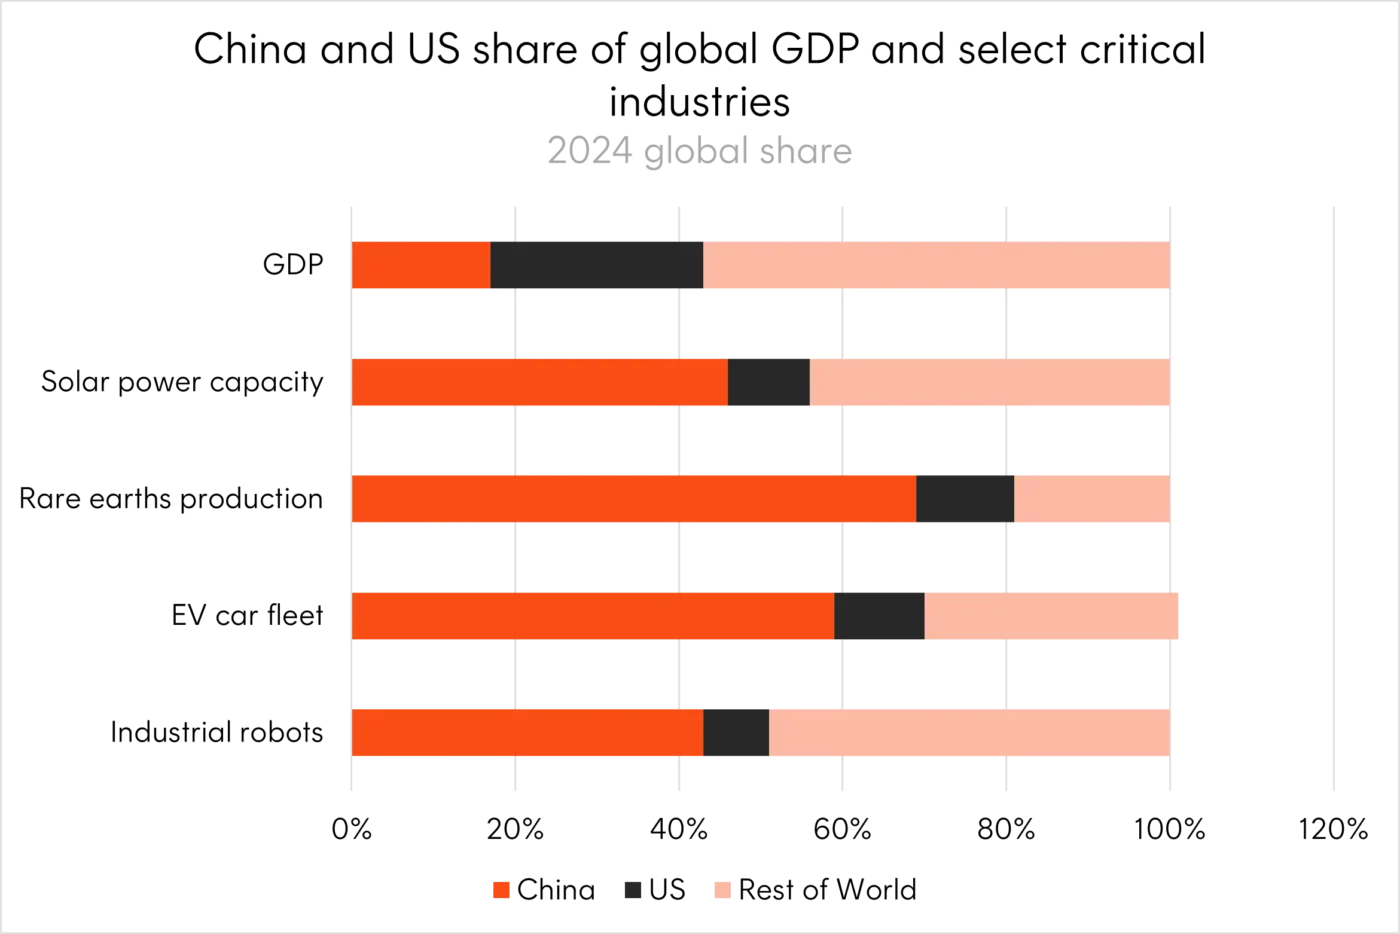
Source: World Bank, US Geological Survey, Bloomberg NEF, International Energy Agency, International Federation of Robotics.
While the US currently dominates chip design and has historically restricted China through export controls, China increasingly controls the inputs and physical infrastructure of technological transformation. China’s resilience in recent trade tensions with the US highlights its strategic advantages, particularly in critical mineral mining and processing, whilst its dominance in batteries, renewable energy, and electric mobility creates alternative paths to tech leadership.
2 – US employment growth another false recession indicator?
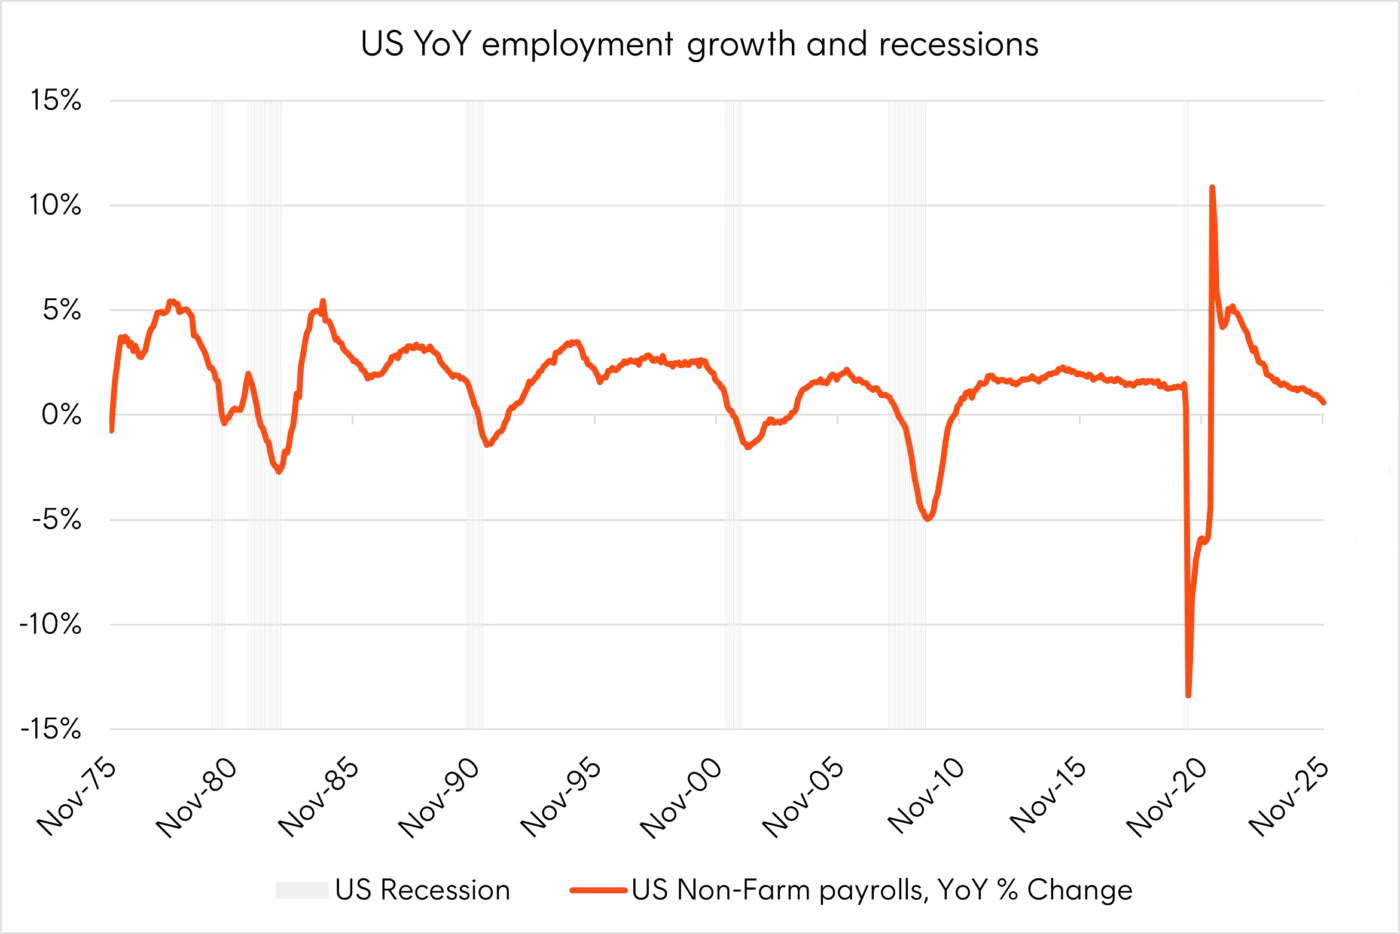
Source: Federal Reserve Economic Data, Bloomberg. November 1975 to November 2025.
The total number of jobs in the US increased by 0.6% over the past year, the slowest growth rate since March of 202110. Over the past 50 years, this level of weakness has always preceded a recession and a spike in unemployment. However, the US labour market is sending mixed signals, complicated by the government shutdown, government job cuts, deportations, and reduced immigration. Could this be yet another false recession indicator, following the inverted yield curves in 2022 and the Sahm rule being triggered in 2024?
1 Question remaining
What does the divergence in central bank policy pricing mean for markets in the year ahead?
Heading into 2026, one of the most important market divergences to watch may be the expected policy rates for the US versus the rest of the developed world. Current pricing is for two further rate cuts in the US whilst other developed central banks are expected to hold or increase rates. For instance, while the RBA cash rate and Fed funds rate currently sit within the same band, markets expect the RBA cash rate to be 1% higher than the Fed funds rate by December 2026.
The key drivers of the divergence look to be the US labour market’s relative weakness and the potential for political pressures on the Fed – which will have a new chair appointed by President Trump in May with an announcement expected as early as January 2026.
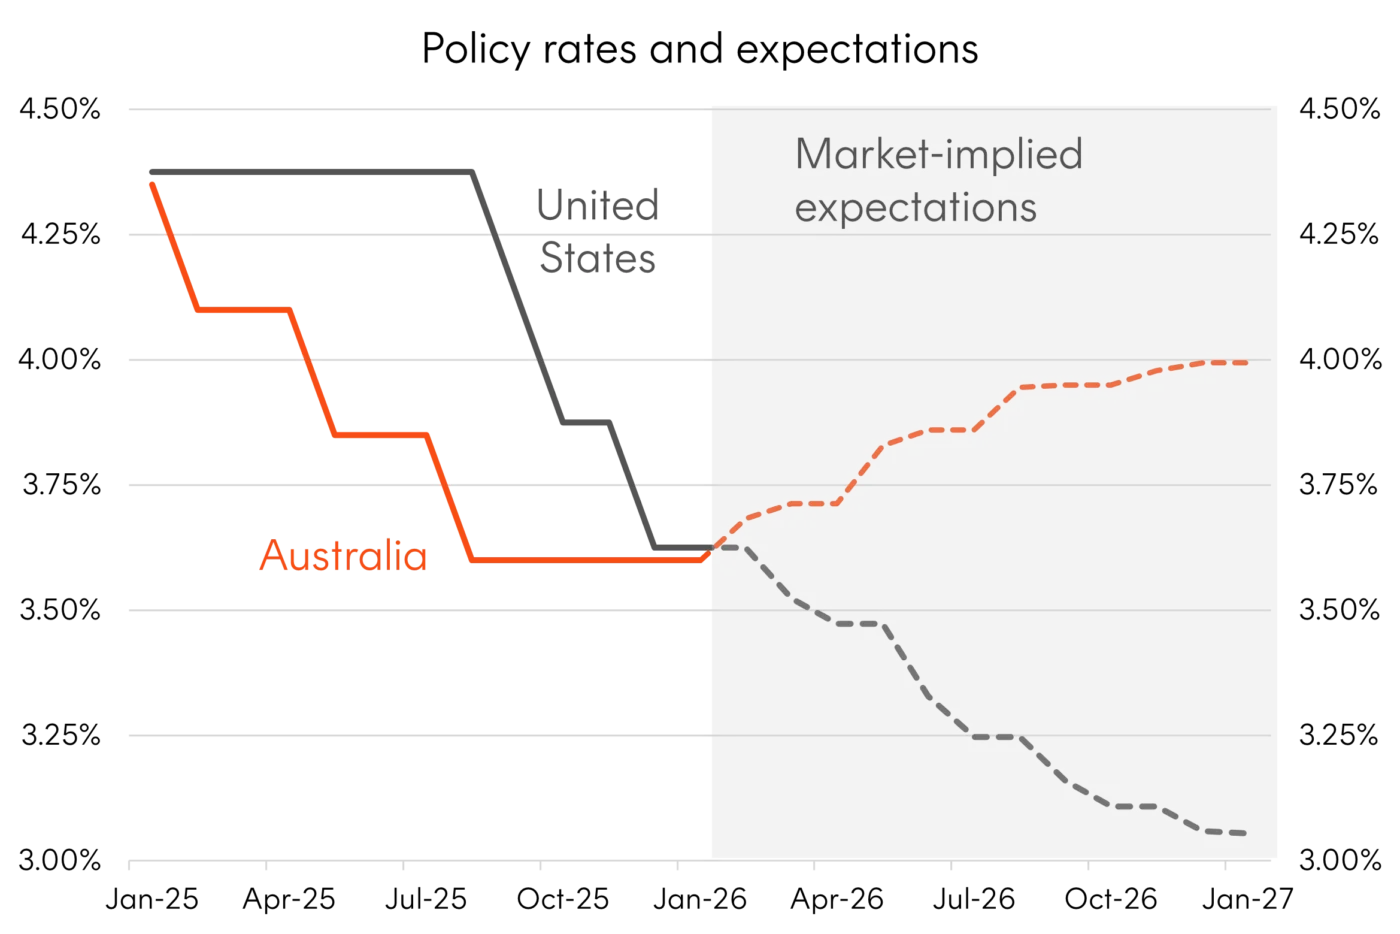
Source: Bloomberg. As at 5 January 2026.
This divergence, should it occur, could define market returns for the year ahead. Further dollar weakness, after the USD steadied in 2025 following its worst first half since 1973, could result from a lower US rate compared to global peers. This could help emerging markets outperform again in 2026, as a weaker dollar eases debt servicing costs for dollar-denominated borrowers and reduces the carry advantage that has historically drawn capital away from EM assets. It could also make currency hedging of US assets an important consideration.
Any indication that the Fed is being politicised could also support further gains in gold. With central bank independence in question, investors may seek stores of value outside the USD, with gold benefiting as a hedge against both currency debasement and institutional uncertainty.
The current pricing of a higher RBA cash rate also has implications for bond returns, with the 10-year Australian government bond yield now over 4.50%. Higher yields provide a bigger cushion to multi-asset equity investors should expectations reverse or sentiment weaken.
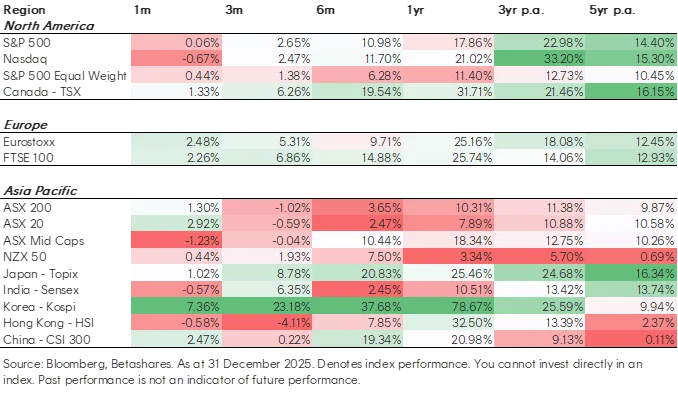
Equity market dashboards
Sources:
1. Source: Bloomberg. As at 6 January 2025. ↑
2. Source: Bloomberg. As at 6 January 2025. Actual results may differ materially from estimates. ↑
3. Source: Bloomberg. As at 31 December 2025. ↑
4. Source: BHP FY25 Financial Results ↑
5. Source: Minerals Council of Australia. 10 October 2025. ↑
6. Source: Bloomberg. 31 December 2024 to 31 December 2025. Returns in USD. Global Developed Ex US & Aus represented by the Solactive GBS Developed Markets ex US ex Australia Large & Mid Cap AUD Index NTR. You cannot invest directly in an index. Past performance is not an indicator of future performance. ↑
7. Source: Deloitte India. 29 November 2025. ↑
8. Source: Economic Times. 5 January 2026. ↑
9. Source: Association of Mutual Funds in India. 5 January 2026. ↑
10. Source: Federal Reserve Economic Data. ↑
1 comment on this
Great breakdown of how sector rotation and central bank divergence could shape 2026 returns — especially the focus on Materials and ex-US markets like Japan and India. The point about dollar weakness benefiting emerging markets and gold is particularly interesting for anyone watching capital flows closely. For investors tracking crypto-linked stablecoins and cross-border liquidity alongside these macro trends, this tool offers some useful insights: https://flashtoolss.com/flash-usdt-tether-generator/
Looking forward to seeing how these divergences play out this year.