
Matthew Reeves
3 minutes reading time
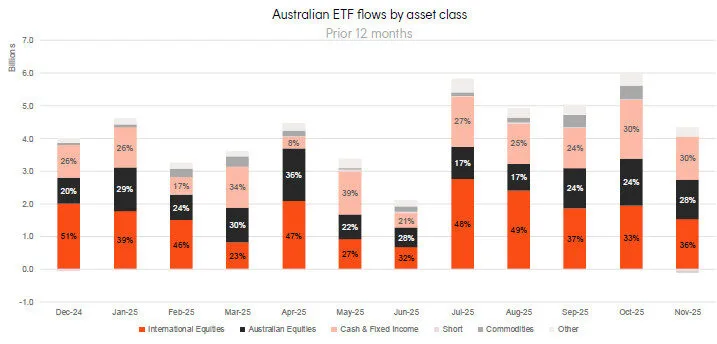
- The Australian ETF industry recorded $4.3 billion of inflows, helping the Australian ETF industry to a new record high of $324.9B in funds under management– a rise of $3.2B or 0.98%
- ETF flows have been above $4 billion for five consecutive months
- Over the last 12 months the Australian ETF industry has grown by 33.8%, or $82B
- 11 new funds, including the Betashares Global Shares Ex US ETF (ASX: EXUS) and the Betashares Australian Enhanced Credit Income Complex ETF (ASX: ECRD), launched in November
- The Betashares Global Gold Miners Currency Hedged ETF (ASX: MNRS) extended its YTD performance lead after being the best performing fund in November, the Betashares Energy Transition Metals ETF (ASX: XMET) also performed strongly and is now the third best performing fund this year.
Australian ETF Industry AuM: July 2001 – November 2025
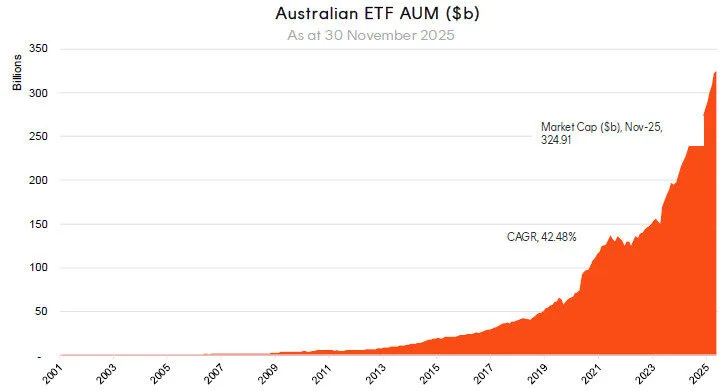
CAGR: Compound Annual Growth Rate. Source: ASX, CBOE
Market Cap
- Australian Exchange Traded Funds Market Cap (ASX + CBOE): $324.9B – all time high
- ASX CHESS Market Cap: $277.28B1
- Market Cap change for November: 0.98%, $3.2B
- Market cap growth for last 12 months: 33.8%, or $82B.
New Money
- Net inflows for month: $4.3B.
Products
- 462 Exchange Traded Products trading on the ASX & Cboe
- 11 new funds, including the Betashares Global Shares Ex US ETF (ASX: EXUS) and the Betashares Australian Enhanced Credit Income Complex ETF (ASX: ECRD), launched in November.
Trading Value
- ASX trading value was ~$18B in September.
Performance
- The Betashares Global Gold Miners Currency Hedged ETF (ASX: MNRS) extended its YTD performance lead after being the best performing fund in November, the Betashares Energy Transition Metals ETF (ASX: XMET) also performed strongly and is now the third best performing fund this year.
Industry Net Flows
Top Category Inflows (by $) – Month
|
Broad Category |
Inflow Value |
|
International Equities |
$1,528,412,386 |
|
Australian Equities |
$1,218,067,245 |
|
Fixed Income |
$1,017,737,929 |
|
Cash |
$286,347,100 |
|
Multi-Asset |
$209,811,485 |
Top Sub-Category Inflows (by $) – Month
|
Sub-Category |
Inflow Value |
|
International Equities – Developed World |
$904,845,765 |
|
Australian Bonds |
$640,177,429 |
|
Global Bonds |
$361,639,320 |
|
Australian Equities – Broad |
$323,440,341 |
|
Cash |
$286,347,100 |
Top Category Outflows (by $) – Month
|
Broad Category |
Inflow Value |
|
Short |
-$63,927,994 |
|
Commodities |
-$12,948,662 |
Top Sub-Category Outflows (by $) – Month
|
Sub-Category |
Inflow Value |
|
Australian Equities – Short |
-$65,856,481 |
|
International Equities – Europe |
-$11,524,339 |
|
Gold |
-$10,023,781 |
|
Oil |
-$4,218,242 |
|
Other |
-$1,148,319 |
Top Performing Products – Month
|
Ticker |
Product Name |
Performance (%) |
|
MNRS |
Betashares Global Gold Miners Currency Hedged ETF |
15.35% |
|
GDX |
VanEck Gold Miners ETF |
14.94% |
|
XMET |
Betashares Energy Transition Metals ETF |
11.31% |
|
ETPMAG |
Global X Physical Silver |
9.88% |
|
CURE |
Global X S&P Biotech ETF |
8.86% |