



Key points
In Q2, markets homed in on a key question: who is making money from AI?
The case for AI strengthened as AI revenue became more meaningful and the memory market entered a profit supercycle. Australia closed the financial year higher, although gains remained concentrated in a relatively small group of companies, and the Iran war left little lasting mark on markets.
3 things we learned
Who is earning AI’s return
Q2 provided stronger evidence that AI is becoming a real business opportunity, even as volatility and bubble concerns persist.
AI-related revenue is now significant, but the question of who will ultimately capture the lion’s share of the economics was magnified as the memory chip market entered a period of exceptionally strong profitability.
Microsoft said its AI business had surpassed a US$37 billion annual revenue run-rate, up 123% year on year.1 Anthropic disclosed a US$47 billion annualised revenue run-rate in May, compared to US$9 billion at the end of 2025.2
Those figures are a long way from the low-revenue excesses of the dot-com bubble. But the same question remains. Can the revenue being generated by model providers translate into lasting profits after the cost of developing and running these models?
Enterprises and consumers pay OpenAI, Anthropic and other AI model providers. Those AI model providers then spend heavily on cloud computing. The tech giants providing that computer superpower invest heavily in data centres, GPUs, memory, networking and power. The most visible profits today are showing up in Nvidia and memory makers, with hyperscalers also growing profits strongly but carrying the much larger capex burden.
During the quarter, investors increasingly focused on memory-chip makers as demand for AI infrastructure continued to grow. Nvidia remained at the centre of the AI infrastructure trade, while Micron, Samsung and SK Hynix became major beneficiaries.
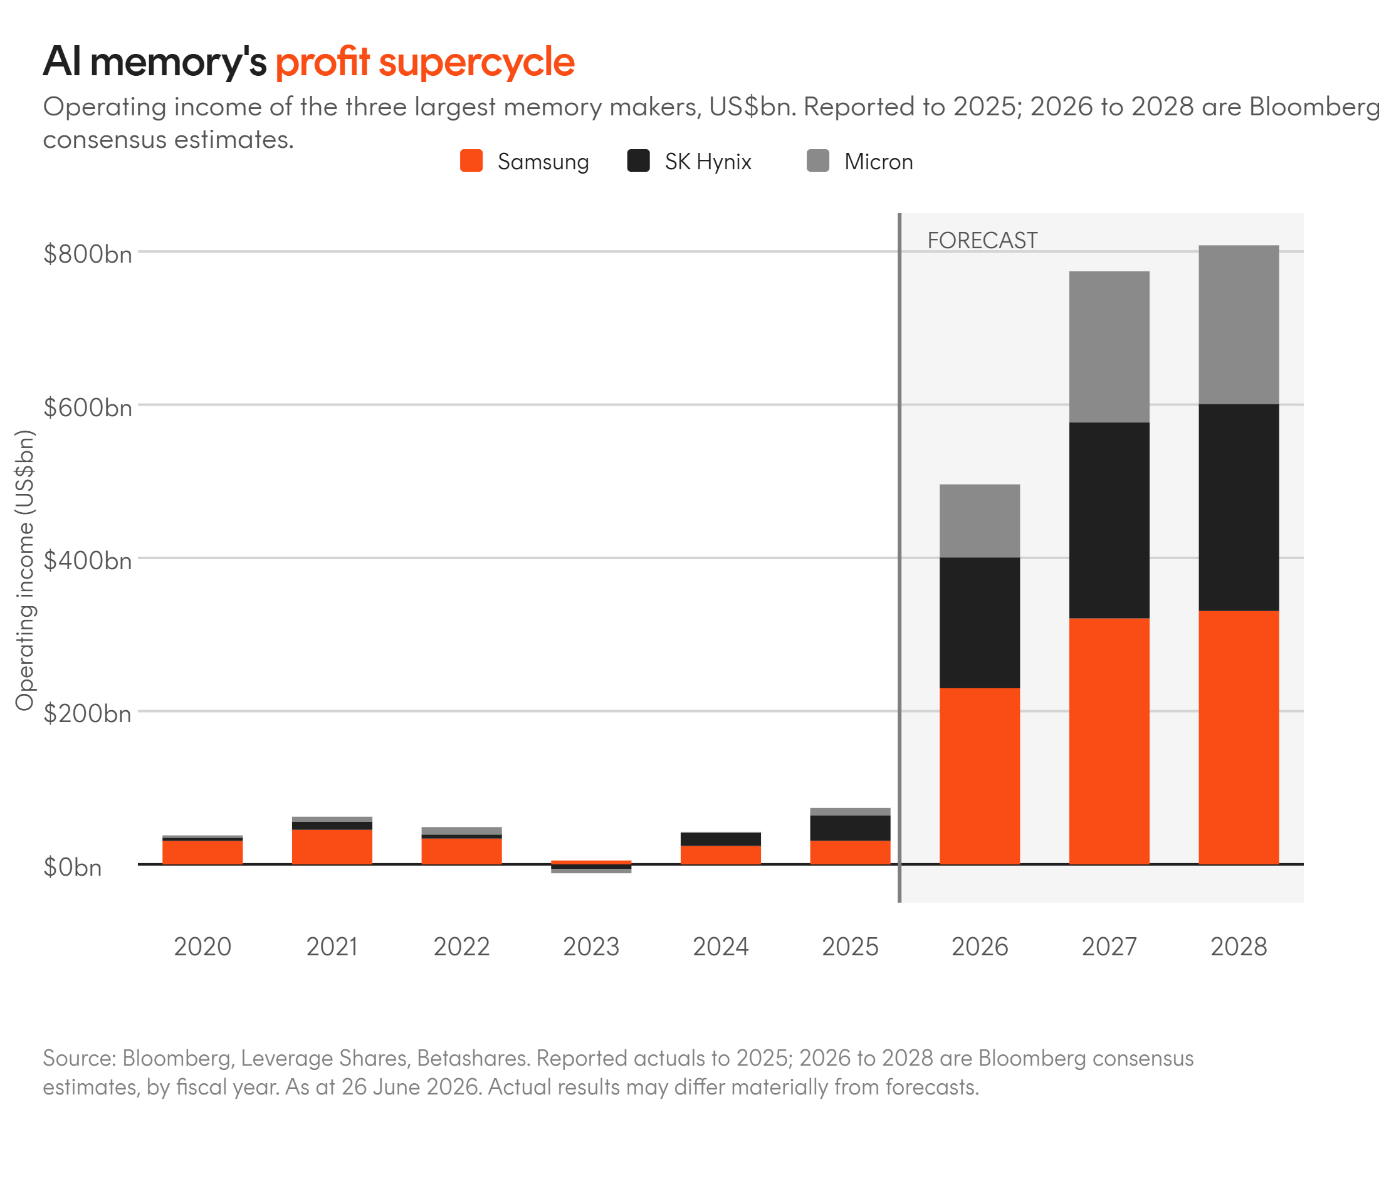
The chart above shows just how quickly expectations have changed. Consensus forecasts suggest profits for the three largest memory-chip makers could rise dramatically over the next few years as demand for AI infrastructure continues to grow.
The ultimate test is whether the tech giants funding the AI buildout and AI model providers with growing customer bases can turn demand into their own high-margin profit pools, or whether the wave of profits continues to accrue mainly to chips, memory, and power.
Australia lags the global rally
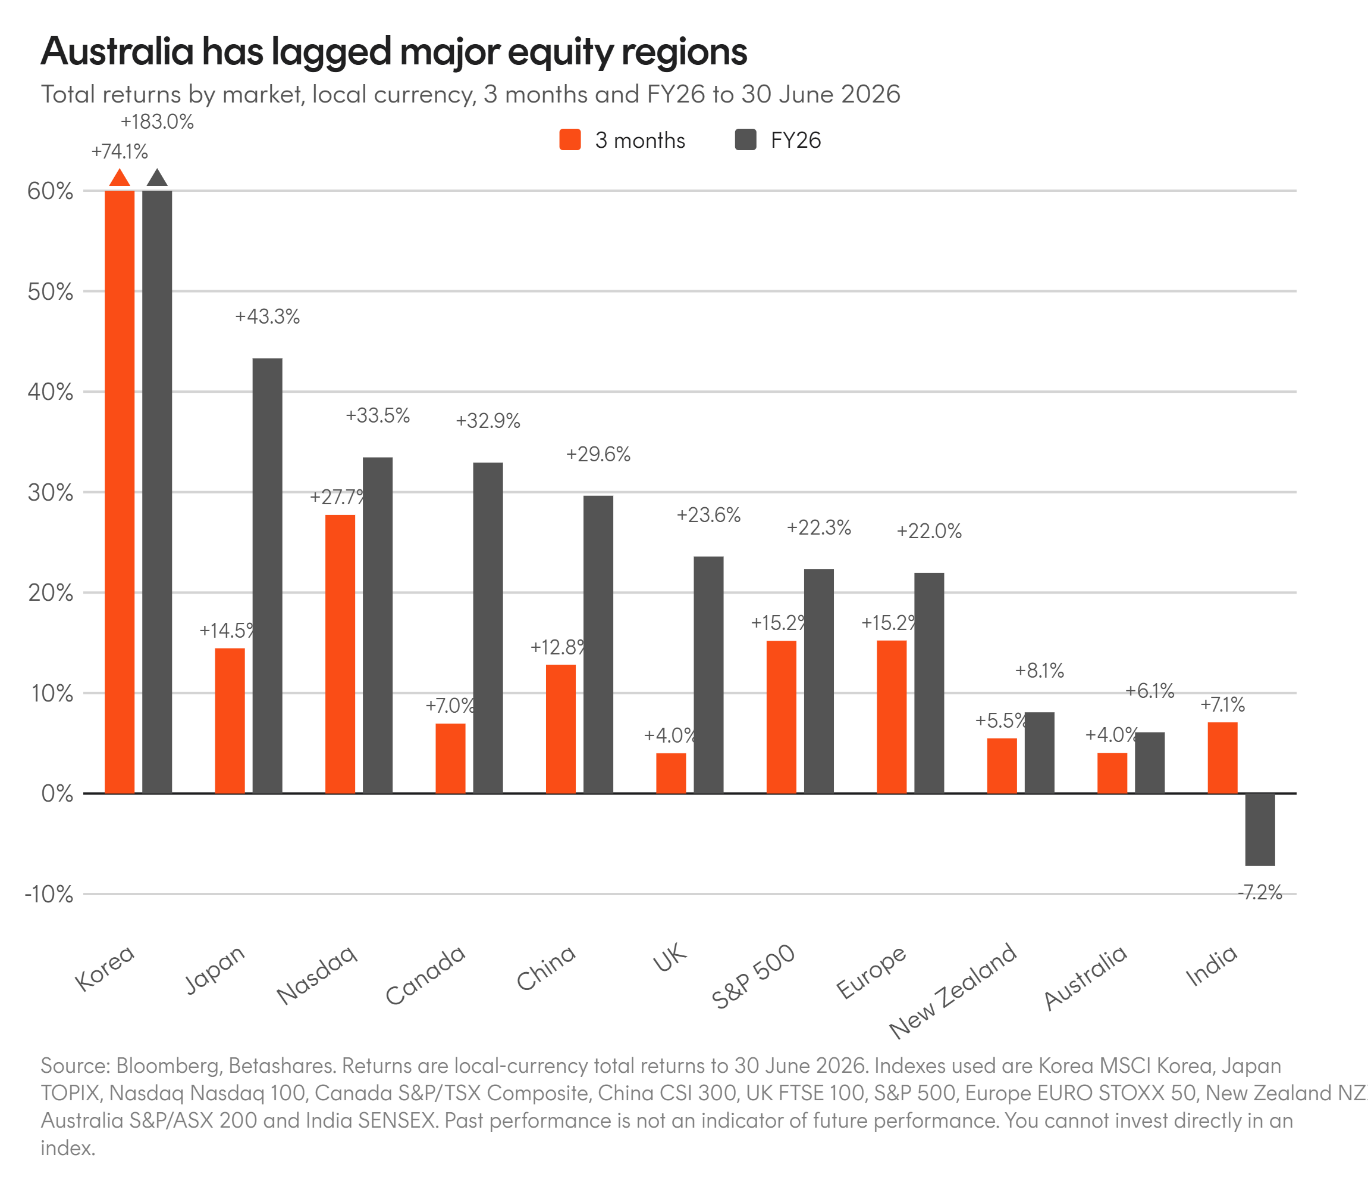
Australia’s equity market ended FY26 up 6.1%3, but the year exposed a familiar problem. The market still lacks a clear structural growth engine.
Most of the year’s gain came in the final quarter, but it still lagged markets with more direct exposure to the AI investment boom or stronger earnings growth.
AI-linked investment has started to show up in the Australian economy. The ABS March quarter GDP release showed business investment in data-centre machinery and equipment was the largest contributor to growth, although the impact on GDP was partly offset by the import-heavy nature of that spending.4
Yet the AI theme has had a far smaller impact on the listed sharemarket. Australia does not have the tech giants, semiconductor leaders or dominant software platforms that have driven returns in the US and parts of Asia.
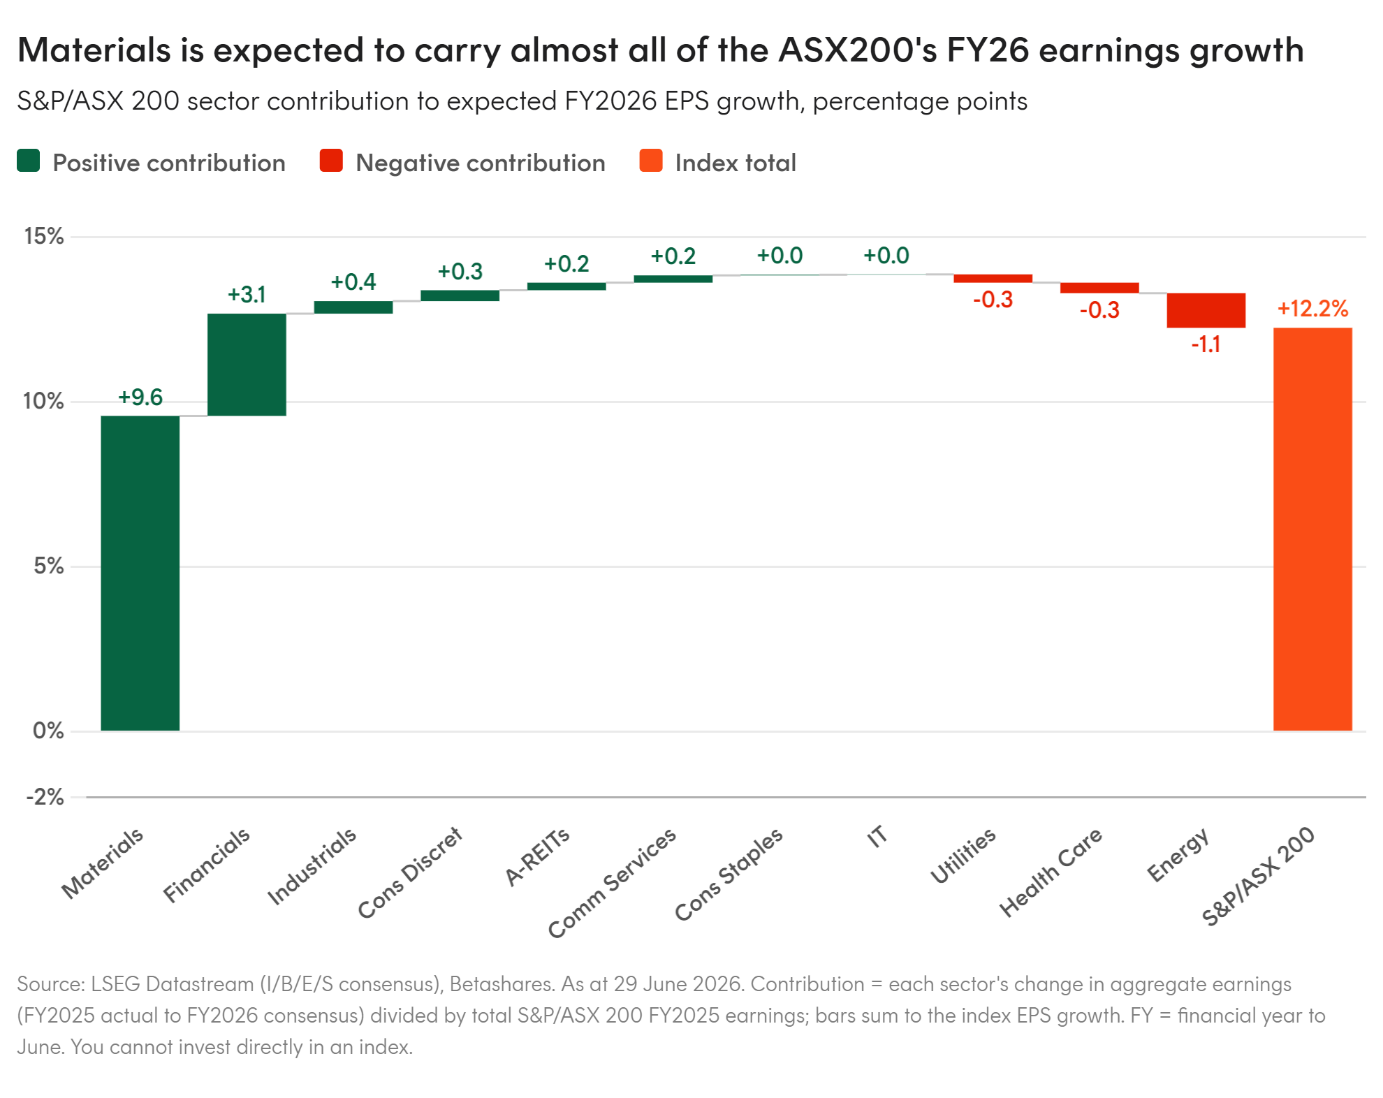
The benefit instead came through Materials. The sector returned 52% over FY26 and contributed more than the full ASX 200 gain.5 In Q2, Materials again accounted for roughly half of the market’s return.6 Elevated iron ore prices throughout the financial year and gold’s surge were significant contributors. Materials are also a beneficiary from the AI trade, with exposure to copper, critical minerals, energy infrastructure and the broader global investment cycle.
That has left market growth narrow. Health Care and Technology were major drags over the year, Financials delivered little despite the large index weight, and the expected earnings rebound remains heavily dependent on resources. Consensus expects ASX 200 earnings to grow by around 13% in FY27, but Materials and Energy are expected to contribute around 62% of that earnings growth.7
During the quarter a further RBA rate hike and the proposed budget tax changes, including replacing the 50% CGT discount with an inflation indexation method, saw Australian consumer confidence hit decade lows further complicating the path forward for domestic equities.
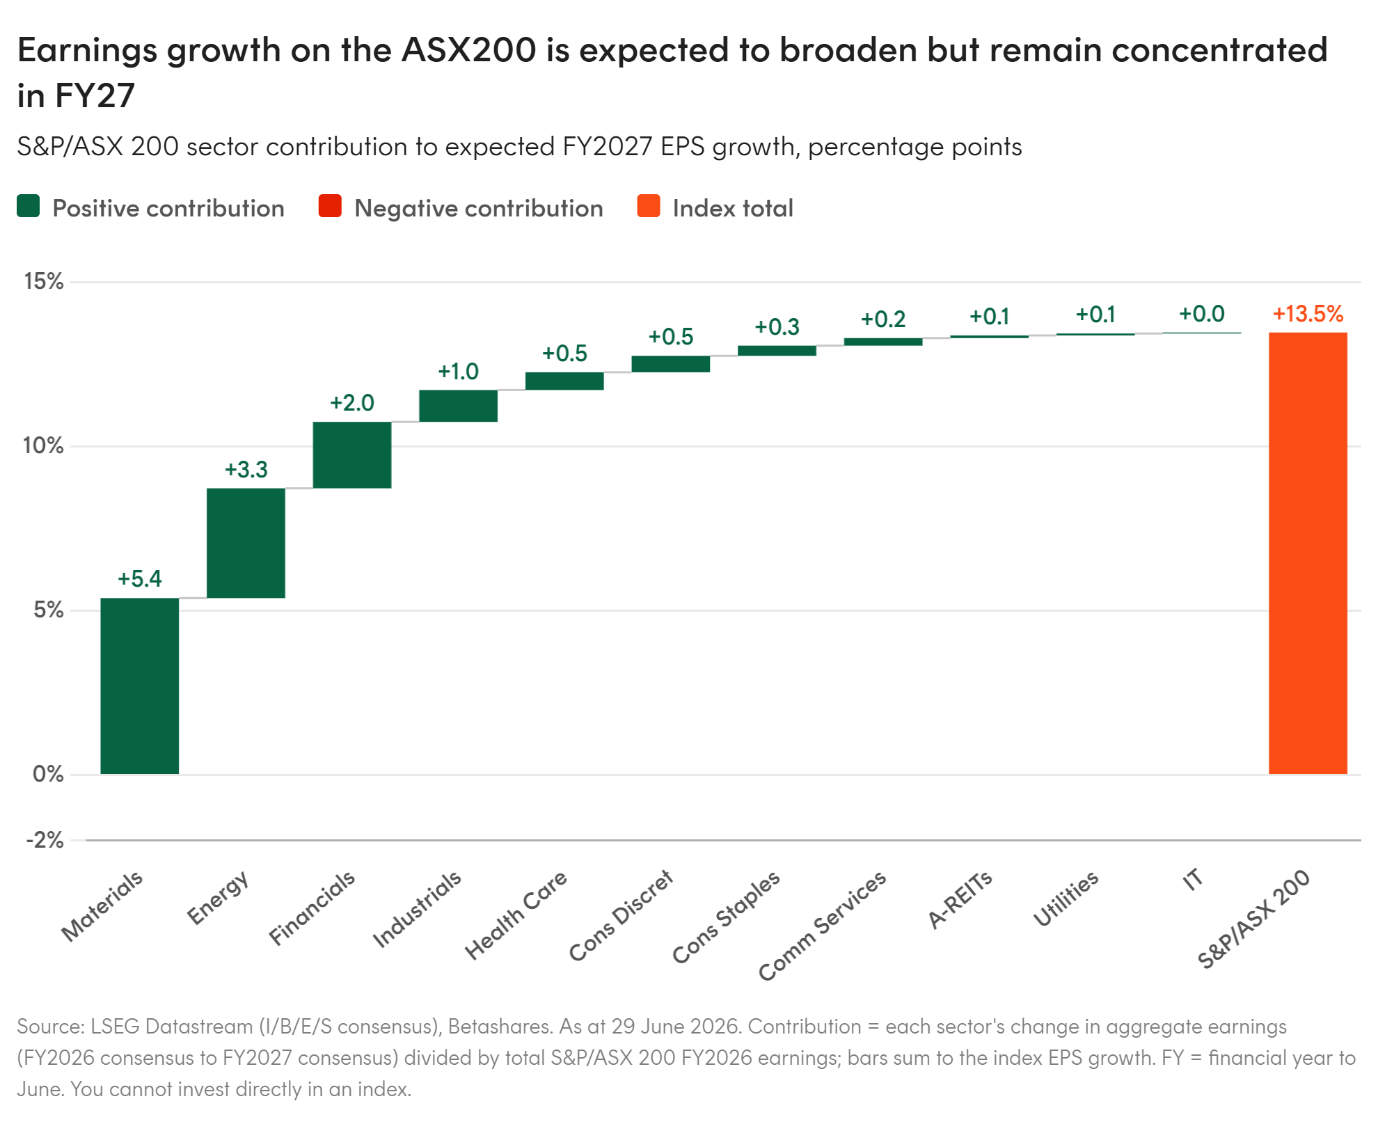
This leaves Australia’s market in a challenging position. If the AI rally continues, Australia is likely to lag markets with more direct exposure. If the rally reverses, Australia may be less exposed to the most crowded parts of the trade, but it would still sell off in a global drawdown. Materials would also be vulnerable if investors start marking down AI investment and global growth expectations.
The question heading into August reporting season is whether Australia can find a broader earnings story. A peak in RBA rates could help rate-sensitive sectors that struggled in the second half of FY26, but lower rates are not guaranteed and alone will not create growth. Until earnings broaden beyond resources, investors are likely to keep favouring a tactical approach to Australian equities such as seeking companies with high-quality earnings, pricing power and visible growth.
Iran war dominated headlines but not markets
Geopolitics remains a structural driver of investment themes, but the market still assigns a short duration to event risk.
The Iran war dominated financial discussion throughout the second quarter, and key issues surrounding the war remain largely unresolved, but by the end of the quarter market participants had largely moved on.
Oil rose significantly from pre-war levels, with WTI and Brent up around 70% at their peaks and Middle Eastern crude futures markets increasing as much as 145%.8 By quarter-end, that risk premium had largely unwound.
The same pattern was visible in the traditional beneficiaries. Energy companies and defensive proxies, like global agriculture, initially benefited from higher oil prices and heightened geopolitical risk, but those gains faded as oil stabilised and markets looked through the prospect of future Strait of Hormuz flare-ups.
By the end of the quarter, the main drivers of equity returns were elsewhere. US earnings season, the renewed acceleration in AI-linked stocks, and shifting expectations for central bank policy mattered more for broad index performance than the war itself. Iran still fed into the broader economic backdrop through higher oil prices, inflation pressure and rate expectations, but it was a transmission channel, not the central market story.
2 Charts we’re watching
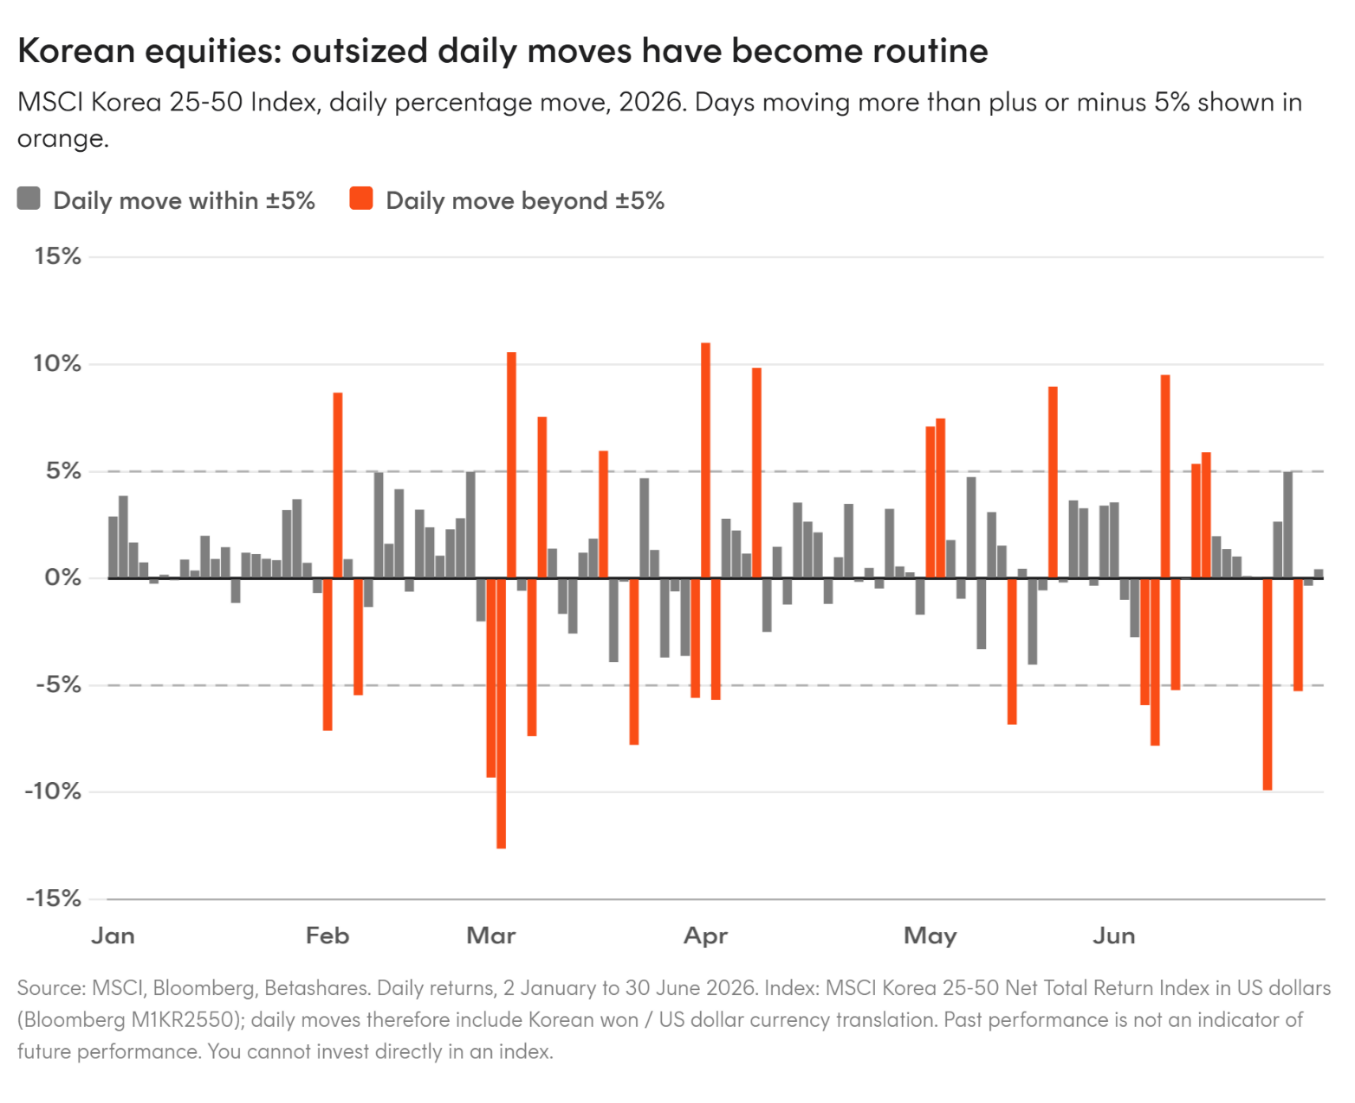
The Korean equity market has recorded more than 25 daily moves of at least 5% this year, up from just two in 2025. That volatility has drawn comparisons with meme-stock behaviour, even though the underlying companies are not speculative small caps but two of the world’s most important memory-chip producers.
Part of the explanation lies in the structure of the market, with 2x leveraged ETFs tied to SK Hynix and Samsung becoming amongst the largest products of their kind globally, while those two stocks now make up around 50% of the index. AI has become the most topical and volatile global theme, so larger daily swings are not surprising.
But Korea is an extreme example of a broader shift in market structure, where concentrated index leadership, leveraged products and crowded trades can turn swings in a dominant theme into sharper sell-offs and rebounds.
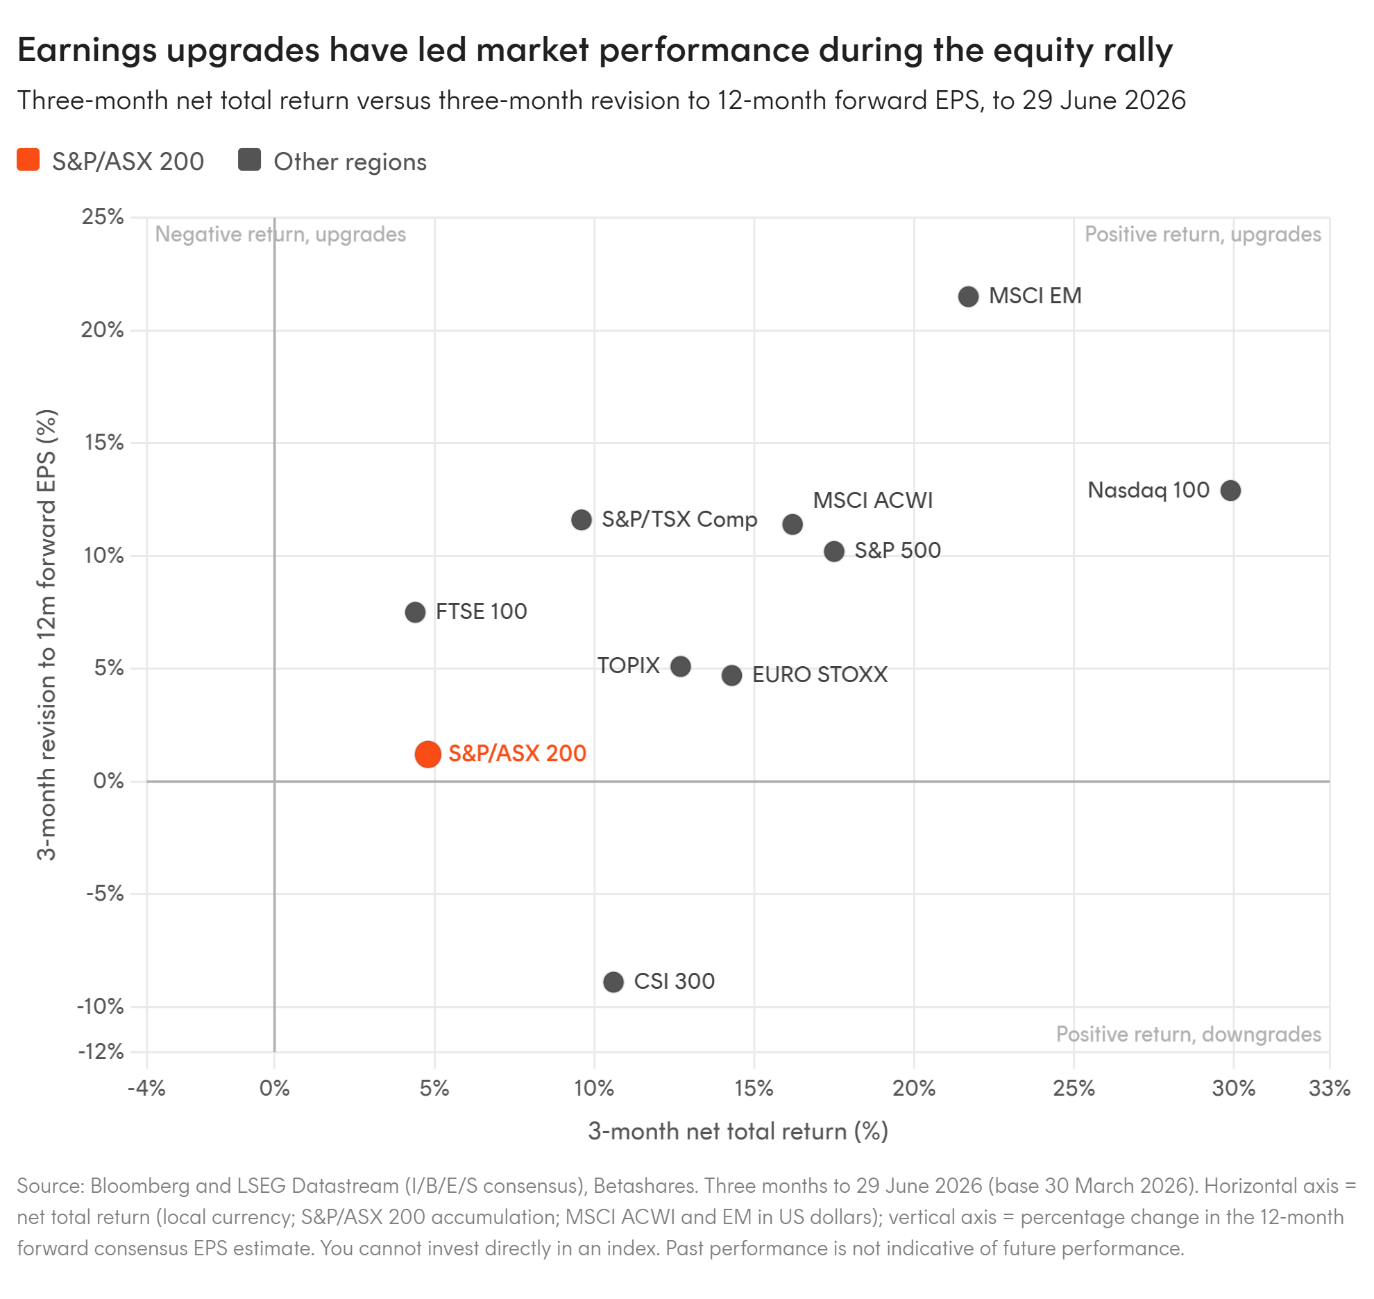
Markets with the strongest returns over the past three months have generally also seen the largest earnings upgrades, led by emerging markets and the Nasdaq 100, where AI-related investment is flowing most directly into revenue and profit expectations.
That reinforces that this is not a purely speculative, valuation-driven rally. Within emerging markets the upgrades sit with North-Asian semiconductors, while onshore China earnings were cut. Australia sits on the other side of the divide, with among the weakest returns and only modest earnings upgrades, reflecting its limited direct exposure to the AI winners and heavier reliance on indirect beneficiaries such as resources.
1 question remaining
What would end the AI trade?
Rates, positioning and geopolitics can trigger pullbacks, but they are unlikely to decide the cycle. It comes back to whether tech giants, cloud platforms and AI model providers can convert the enormous infrastructure buildout into lasting profits.
A slowdown in AI capex would not necessarily be the problem.
Capex booms always contain some waste, and a more disciplined spending path could even be welcomed if it reflects capacity catching up with demand. The warning sign would be a panic cut, cancelled orders, falling utilisation, weaker cloud growth or a sudden shift in language from demand exceeding supply to reassessing capacity.
The more important test will be revenue quality.
OpenAI and Anthropic are growing rapidly, but investors still need to see how much of that revenue survives after computing costs, customer subsidies and future price competition. If model-provider revenue slows, margins disappoint, or more IPO disclosures show weaker underlying profitability than expected, the market will start questioning the whole chain of AI spending.
There are also ways the trade will likely change rather than simply end. Open-source models could lower costs and support adoption, while weakening pricing power. Falling GPU and memory prices could help model providers but hurt the supply-chain winners. A slower capex path could lift the free cash flow of tech giants, while damaging the companies that have benefited most from scarcity.
These questions are unlikely to be answered in the next quarter alone, but the market is now highly sensitive to each new data point as investors either confirm or update their expectations for the key players in the AI ecosystem. This means the AI trade can still keep driving markets higher, but with volatility triggered on any signs that the profit pool may be smaller, later, or sitting somewhere different to where investors currently expect.
