What’s driving Australia’s inflation uplift?


This time last year Australia was enjoying declines in inflation and interest rate cuts from the Reserve Bank of Australia. Fast forward to today, inflation has rebounded and the RBA has reversed all of last year’s rate cuts.
It begs the question: what caused the inflation rebound, and will it last? How broad based have the inflation gains been?
The following analysis focuses firstly on changes in headline and then “trimmed mean” underlying inflation, based on the new monthly consumer price index (CPI) report from the Australian Bureau of Statistics (ABS).
Headline inflation
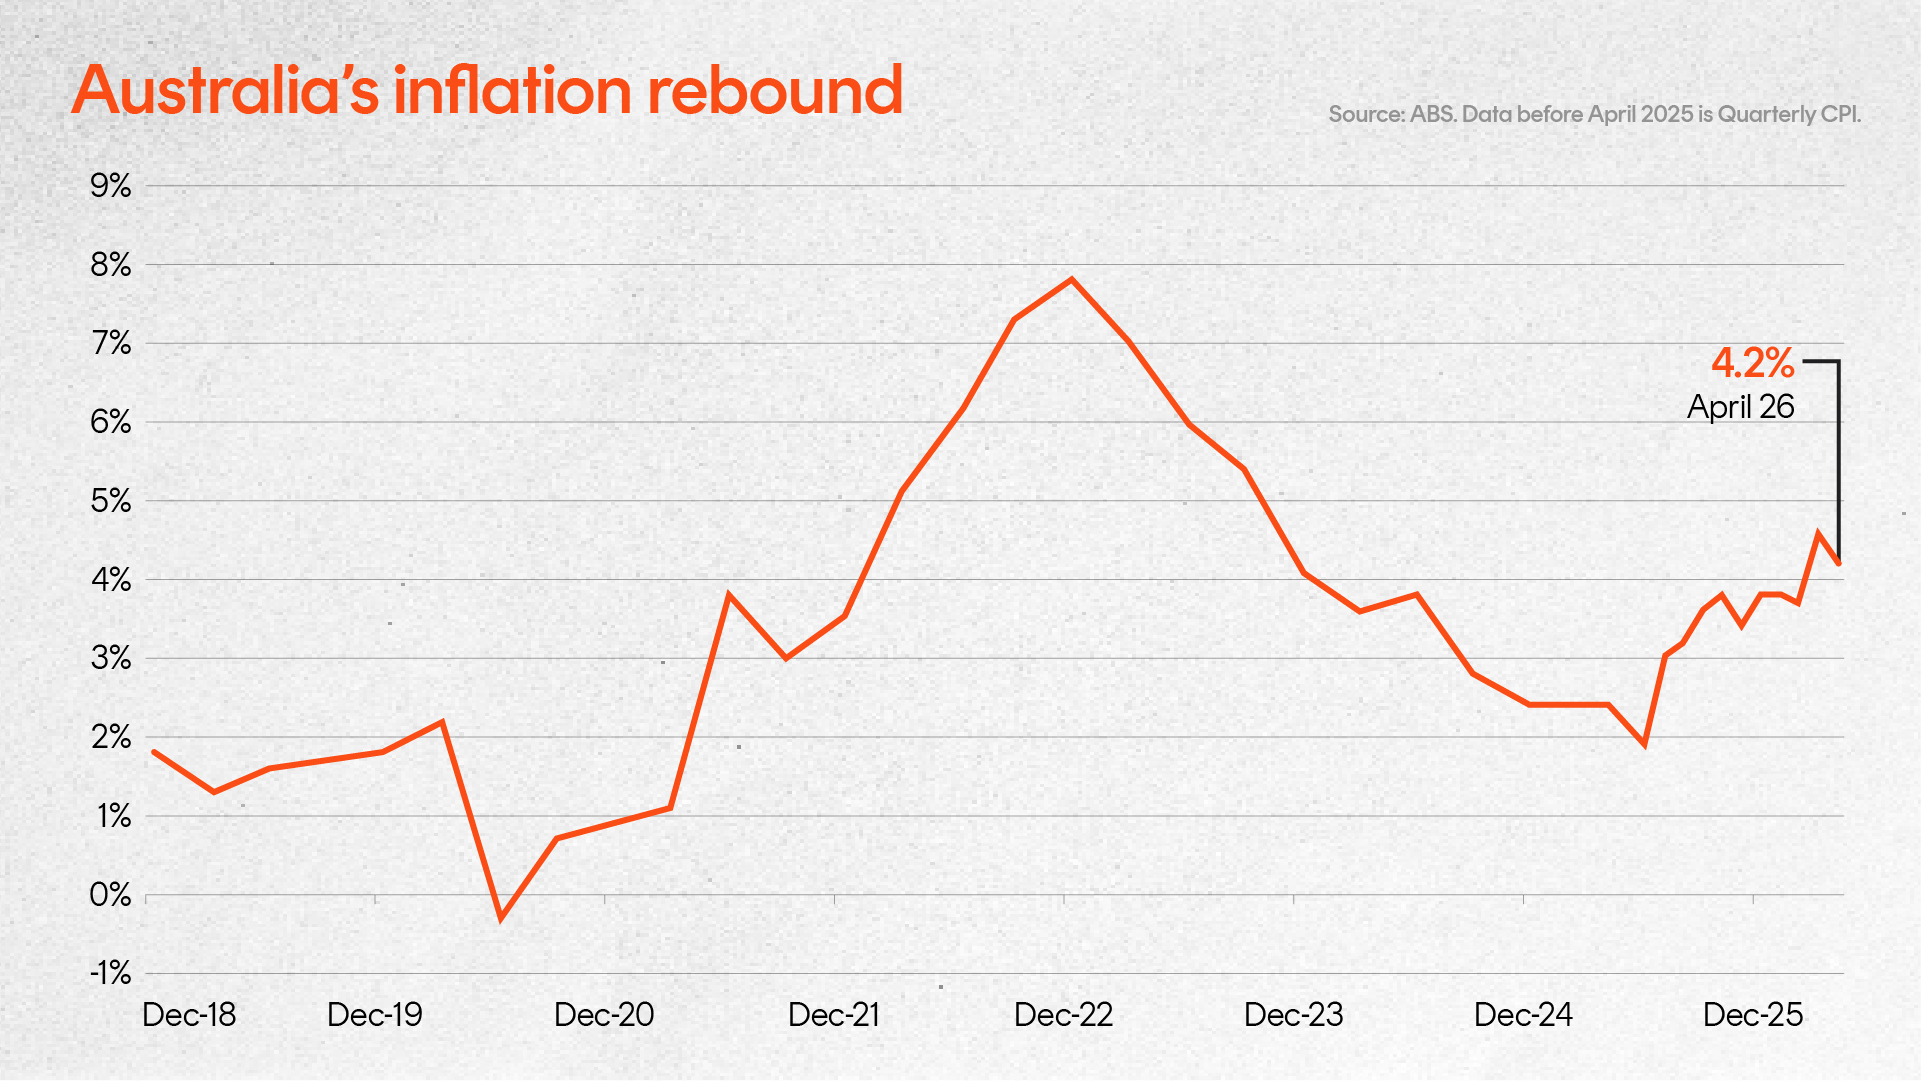
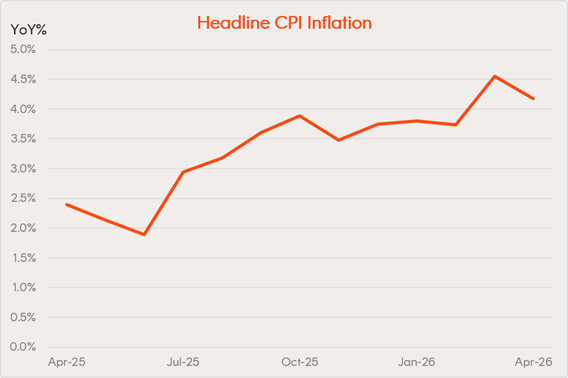
The chart below details the sorry tale of Australia’s recent inflation performance.
After the post-COVID surge, inflation began declining from 2023, with headline annual inflation reaching a low of 1.9% in June 2025. Yet by April of this year, headline annual inflation had reached 4.2%, a 2.3pp increase from the June 2025 low.
Source: ABS
What caused the lift?
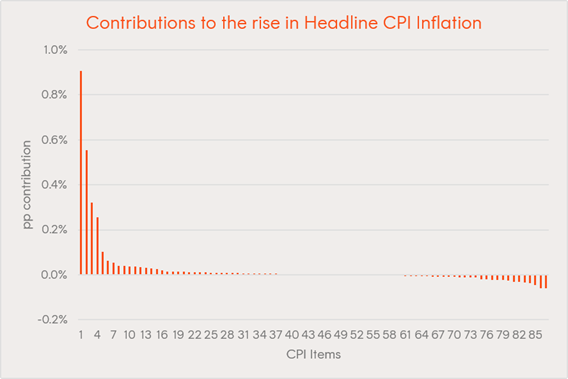
There are 87 individual goods and services in the CPI basket. Of these, just four – fuel, electricity, new dwelling costs and domestic holiday travel – account for 2 of the 2.3 percentage point rise in headline inflation, or 86%.
The rise in fuel and electricity inflation reflects the Iran war-related rise in oil prices and the removal of government electricity price subsidies respectively. The rise in new dwelling prices reflected the upturn in housing demand and, in part, the removal of previous price discounts new home builders needed to offer to attract demand. Last is the rise in domestic holiday costs which, also in part, likely reflects the rise in energy costs.
The heavy positive skew to only a handful of contributors to the rise in headline inflation is evident in the chart below.
Source: ABS
Trimmed mean inflation
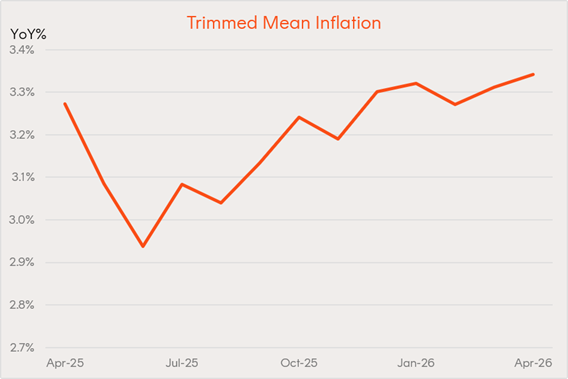
Of course, major prices changes for certain items can often heavily skew headline inflation. That’s why underlying measures of inflation are also important to observe, such as the “trimmed mean” which strips out items with the most volatile prices changes (both up and down) on a month-to-month basis.
As evident in the chart below, even trimmed mean annual inflation has increased over the past year – from a trough of 2.8% in June 2025 to 3.4% by April of this year, a 0.6% increase.
Source: ABS
What drove the rise? We can analyse this by estimating the contribution of each item to trimmed mean inflation each month, and then summing the contributions over the 12 months to June 2025, and compare that with their contributions over the 12 months to April 2026.
Perhaps surprisingly, as was the case with headline inflation, less than a handful of items accounted for the rise in trimmed mean inflation.
By far the biggest contributor was the category of new house prices, which has a weight of 7.5% in the CPI. Annual new house price inflation lifted from 0.4% in June 2025 to 4.7% in April 2026. The gains in new home prices were solid, but not strong enough each month to be routinely excluded from the trimmed mean calculation. As a result, new home prices account for 0.42pp of the 0.6pp increase in annual trimmed mean inflation over the period – or 70%!
The next two biggest contributors, though still a lot smaller, were motor vehicles (0.1pp) and restaurant meals (0.05pp). These three items alone account for 96% of the increase in trimmed mean inflation.
The high positive skew of contributors to the rise in trimmed mean inflation is evident it the chart below.
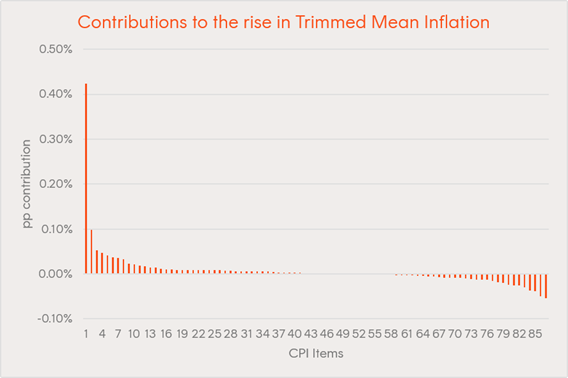
Source: ABS
The chart below strips out new home prices from the CPI and re-calculates trimmed mean inflation in its absence. There’s good and bad news.
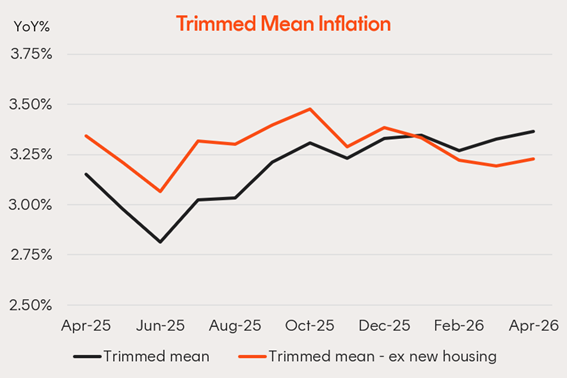
Source: ABS
The good news is that trimmed mean inflation would not have increased over the past year if new home prices were excluded – annual inflation would have gently declined. The bad news is that trimmed mean inflation last year would have been higher (during the period when new home prices were depressed), which might have prevented the RBA from cutting rates in the first place. In fact, excluding new home prices, trimmed mean inflation has broadly move sideways over the past year at around 3.25%.
Conclusion
All up, what’s evident from this analysis is that even underlying measures of inflation – such as the trimmed mean – can be heavily influenced by a narrow range of items at certain times.
Most of the rise in trimmed mean inflation in the past year has reflected the rebound in new home prices. Volatile energy related items – petrol and electricity – account for most of the rise in headline inflation, with a minor added role played by domestic travel.
If the war in Iran ends soon and oil prices ease, this bodes well for easing fuel costs. The rebound in electricity prices due to the removal of subsidies should have largely run its course, though a few State Government programs remain in place.
Of some concern, however, is that recent Budget changes with regard to the housing sector may add to inflation over the coming year. The shift in tax incentives away from investors, and from established to new properties, could result in further gains in new house prices and even rents. These two items are included in the CPI whereas established house prices are not.