
Anthony Sayers
6 minutes reading time
This information is for the use of licensed financial advisers and other wholesale clients only.
With equity valuations stretched and asset correlations elevated, fixed income is once again reclaiming its role as a genuine portfolio diversifier. Investors are increasingly seeking exposures that can deliver reliable income while providing genuine downside protection.
CRED Australian Investment Grade Corporate Bond ETF is a prime example, returning 8.4% p.a. over the past three years1, a return profile comparable to many private-credit strategies, but with the transparency, liquidity, and diversification of an ETF.
Key takeaways
- Consistent performance: 8.44% p.a. over 3 years, beating major bond benchmarks2.
- Attractive yield with IG risk: 5.25% yield to maturity, BBB+ average credit quality3.
- Duration tailwind: ~5.8 year duration positioned to benefit as yields fall4.
- Relative value: Australian IG spreads remain wider than US peers for comparable quality.
- Built-in hedge: Duration offsets spread widening in risk-off periods.
- Carry advantage: Focus on 5–10 year maturities maximises rolldown on the steepest part of the curve.
Australia is the higher-yield laggard in a global easing cycle
The global easing cycle is already underway. Central banks across developed markets have cut rates as inflation cools. Compared with peers, the RBA has opted for a slower, more cautious approach. While policy settings are likely to move lower over time, Australia remains one of the few developed markets where investors can still lock in attractive yields.
After holding the cash rate steady at 3.85% in July, the RBA delivered a 25bp cut in August before pausing again in September. Governor Bullock’s latest comments underscored this measured stance, noting the need to stay “a little cautious” about upside inflation surprises.
This pause has kept the Australian yield curve both higher and steeper than global peers, creating a valuable window before yields shift lower. For investors, that means a unique opportunity to capture attractive income and potential capital gains as the domestic easing cycle catches up.
CRED is positioned to make the most of this setup. Its focus on 5.25–10.25 year maturities allows the fund to harvest the roll-down benefit from Australia’s relatively steep curve, earning attractive yield today while remaining positioned for capital appreciation as rates move lower.
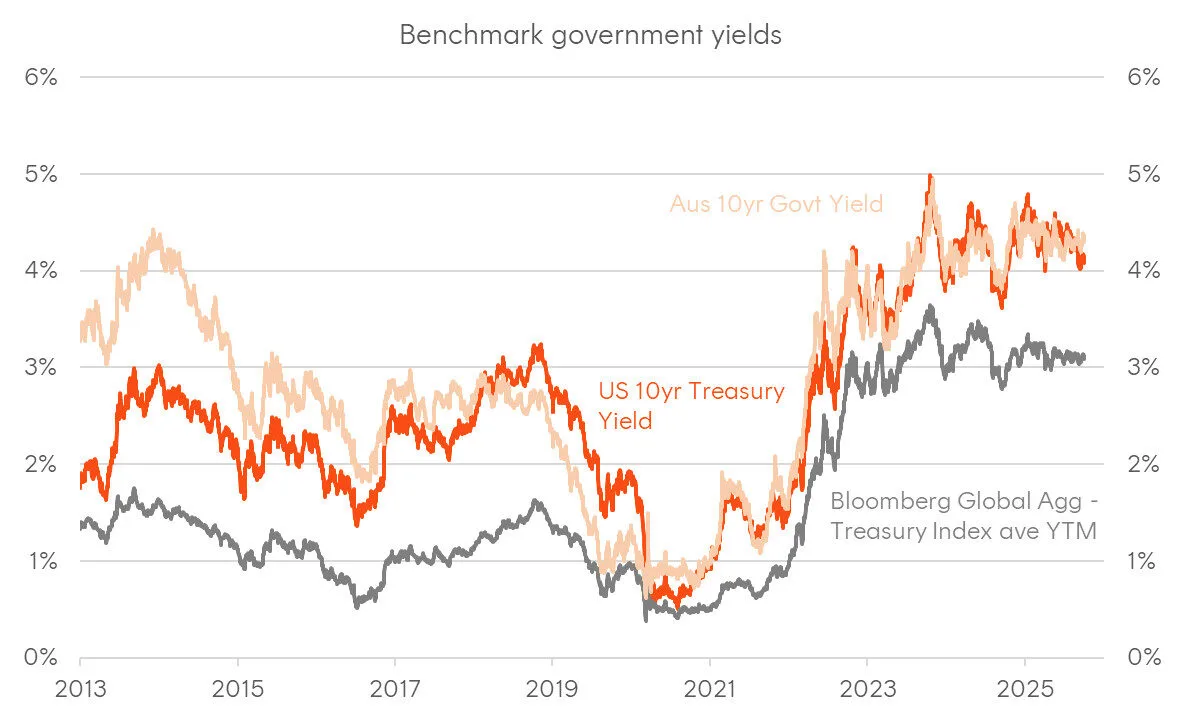
Source: Bloomberg. January 2013 to October 2025.
Harvesting the persistent Australian credit premium
While global credit spreads have performed strongly year-to-date, it is a mistake to assume the opportunity has passed in the Australian market. The real opportunity isn’t in absolute spread levels, but in the relative value between markets.
Australian investment-grade credit consistently offers a yield premium over US equivalents for similar credit quality, a structural feature of the domestic market driven by limited supply and shallower issuance depth.
For investors, this means a wider spread and higher all-in yield without stepping down in credit quality. Australian 5–10 year investment-grade spreads (orange in the chart below) remain meaningfully wider than their US counterparts (grey in the chart below), a relationship that has persisted for years and continues to attract offshore participation.
This premium serves as a natural yield buffer, supporting stronger income and offering greater protection during bouts of volatility. For both domestic and global allocators, it remains one of the simplest ways to enhance returns without taking on undue risk.
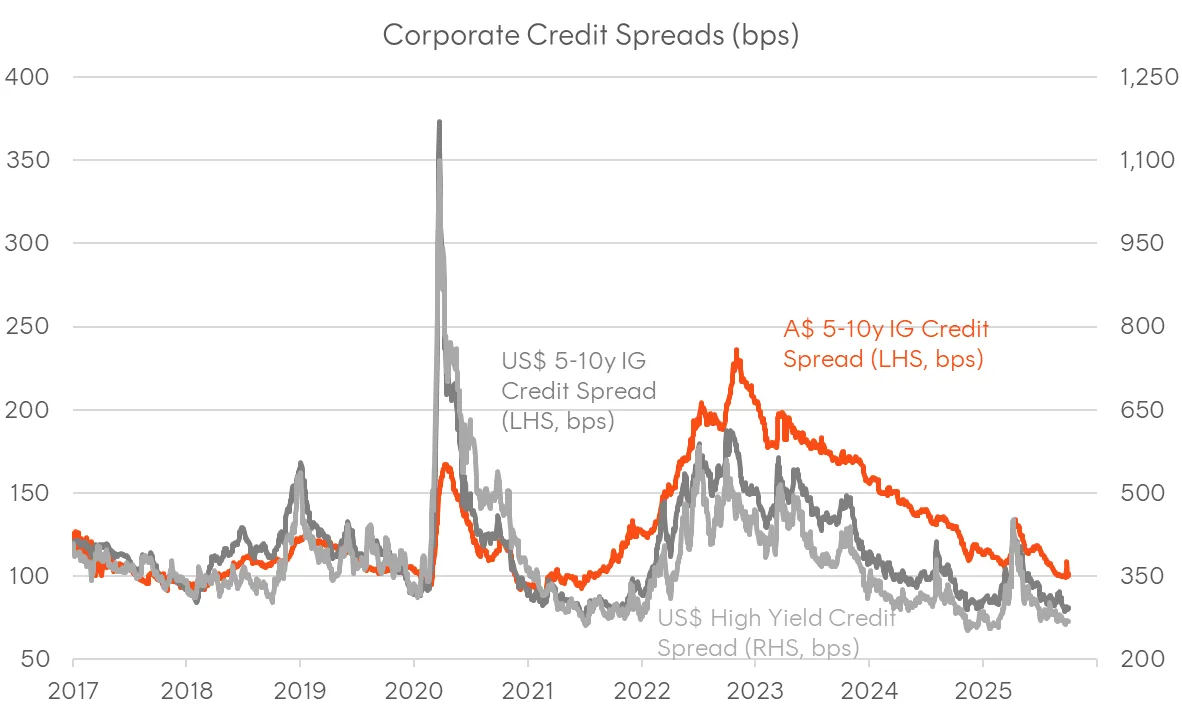
Source: Bloomberg. January 2017 to October 2025. Credit spreads (OAS, basis points)
Duration is a natural hedge against spread volatility
The most common concern for credit investors today is the risk of a “growth scare” causing spreads to widen from their relatively tight levels. This is where CRED’s construction provides meaningful defensive characteristics.
In a risk-off scenario, the market dynamics are predictable: capital flees from risky assets (causing credit spreads to widen) and floods into the safety of sovereign bonds (causing government bond yields to fall sharply).
CRED’s return profile reflects both these components. The fund’s meaningful 5.8 years duration5 means it is highly sensitive to movements in the underlying risk-free rate. Therefore, the capital gains generated by rallying government bonds during a flight-to-quality event act as a powerful offset against the negative mark-to-market impact from a modest widening in credit spreads.
The April “Tariff Tantrum” serves as a great example of this. During that period, Australian credit spreads widened sharply, yet CRED’s NAV remained resilient as its duration exposure captured gains from the rally in government bonds. Once volatility eased, spreads retraced, and CRED recovered quickly.
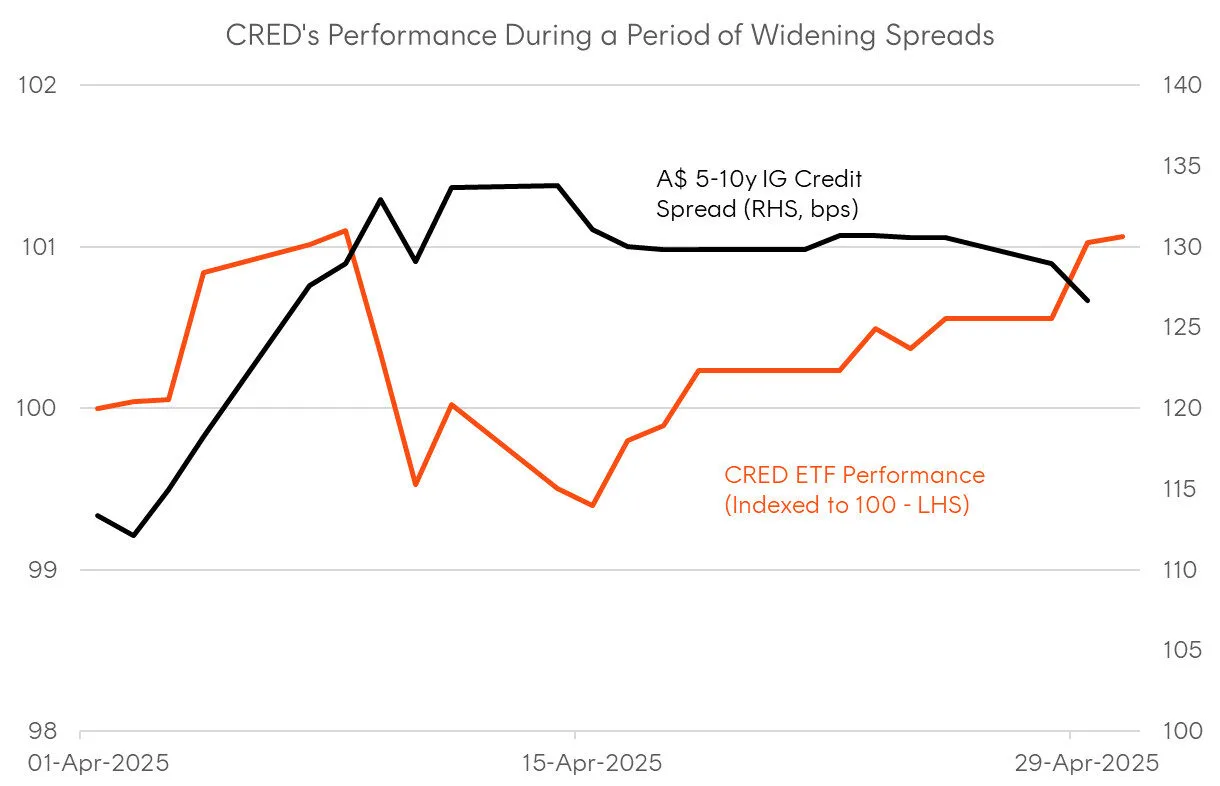
Source: Bloomberg. 1 April 2025 to 2 May 2025. CRED Performance and Australian 5-10yr Corporate Credit Spreads (OAS, basis points) during April market volatility
Performance and positioning
CRED’s performance over the past three years has proven the value of its structure and strategy. To September 2025, the fund returned 8.44% p.a., outperforming major Australian bond benchmarks through a mix of credit carry, roll-down and duration gains6. This consistency highlights CRED’s ability to deliver real income and stability across shifting rate environments.
Looking ahead, the backdrop appears favourable. With global central banks already cutting and the RBA moving more slowly, Australian yields still sit among the highest in developed markets, a differential that may compress as policy settings converge. CRED offers investors the ability to lock in those elevated yields today, with the potential for capital upside as local rates follow the global easing trend.
3 Year Performance (as of September 2025): CRED vs Bloomberg AusBond Credit 0+ Yr Index and Bloomberg AusBond Composite 0+ Yr Index
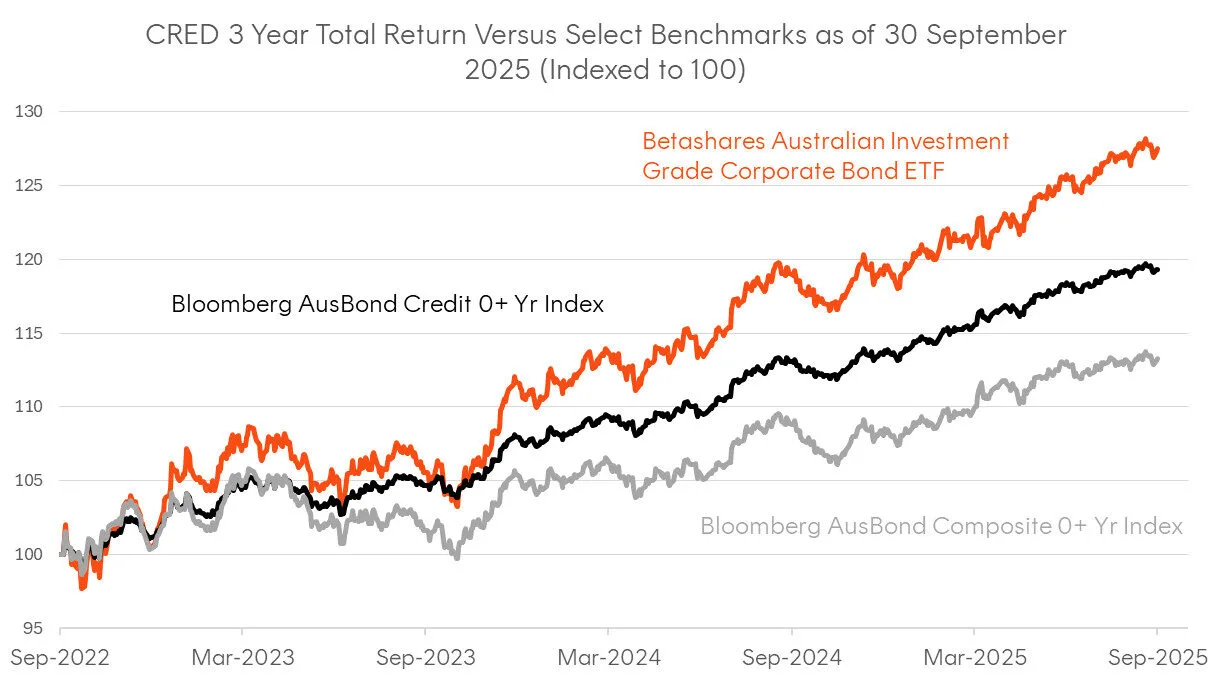
Source: Bloomberg. September 2022 to October 2025. Total return of Betashares Australian Investment Grade Corporate Bond ETF (CRED), Bloomberg AusBond Credit 0+ Yr Index and Bloomberg AusBond Composite 0+ Yr Index. Past performance is not an indictor of future performance.
For more information on CRED, visit the fund page here.
Sources:
1. As at 30 September 2025. Past performance is not an indicator of future performance. ↑
2. As at 30 September 2025. Past performance is not an indicator of future performance. ↑
3. Source: Bloomberg. As at 30 September 2025. Subject to change. ↑
4. Source: Bloomberg. As at 30 September 2025. Subject to change. ↑
5. As at 30 September 2025. Subject to change. ↑
6. As at 30 September 2025. Past performance is not an indicator of future performance. ↑