



Key points
For adviser use only. Not for distribution to retail investors.
Bond funds are held for stability. Some distributions this year were anything but.
Investors typically hold global bonds for diversification and steady income. In theory, a currency-hedged global bond ETF should distribute income broadly in line with the yield generated by its underlying bond portfolio. Bond yields vary year to year, but far less than currencies, which is the whole reason for hedging. Yet this year several currency-hedged global bond ETFs distributed between 6.8 and 9.4 per cent, well above what their underlying bond portfolios yielded. At that level the payout may no longer be set by the bonds. It could be set by the currency hedge and how that hedge is taxed.
A bigger distribution could mean a worse after-tax outcome
The larger payout is not necessarily a larger return. A fixed-rate bond’s cash flows are fixed in advance, and a bond fund should broadly mimic that: a distribution anchored to the yield of the bonds it holds. Where realised gains from currency hedges are treated as assessable income but the corresponding unrealised foreign exchange loss on the underlying bonds remains embedded in the unit price, investors may incur a tax liability before the offsetting loss is realised. In effect, the fund may exchange tax deferral for assessable income in the current year, potentially reducing the after-tax return. But it doesn’t have to be this way.
Case study: WBND and a comparable peer
Set two similar ETFs side by side. The WBND Global Aggregate Bond Currency Hedged ETF and a comparable currency-hedged global aggregate bond ETF give investors much the same exposure: AUD-hedged access to global investment-grade bonds on closely related benchmarks. From WBND’s listing on 31 July 2025 to 30 June 2026, the two delivered very similar total returns of around 3 per cent, while the underlying bonds in both portfolios yielded a little over 4 per cent. What they paid out was very different (Table 1).
Table 1: WBND and a comparable peer
| WBND | Comparable peer | |
|---|---|---|
| Exposure | AUD-hedged global aggregate bonds | AUD-hedged global aggregate bonds |
| Total return (31 Jul 2025 – 30 Jun 2026) | 2.8% | 2.9% |
| Distribution | 3.3% | 8.8% |
| Distribution as a multiple of total return | 1.2x | 3.0x |
| Distribution profile | Consistent each quarter | Back-loaded, concentrated in the second half |
Source: Bloomberg. Total return is measured from WBND’s listing on 31 July 2025 to 30 June 2026. Distributions are FY2026 cash distributions for both funds; WBND’s return and distribution cover its first part-year from 31 July 2025. Both funds pay the June quarter with an ex-date of 1 July 2026, so that distribution is included in the FY2026 distribution figure but not in the total return to 30 June. Past performance is not indicative of future performance.
For the peer ETF, the distribution impact is obvious in the Net Asset Value (NAV) chart below (Exhibit 1). When its March and June quarter distributions went ex, its NAV stepped down sharply.
Exhibit 1: WBND and a comparable peer, NAV reindexed to 100 since WBND inception
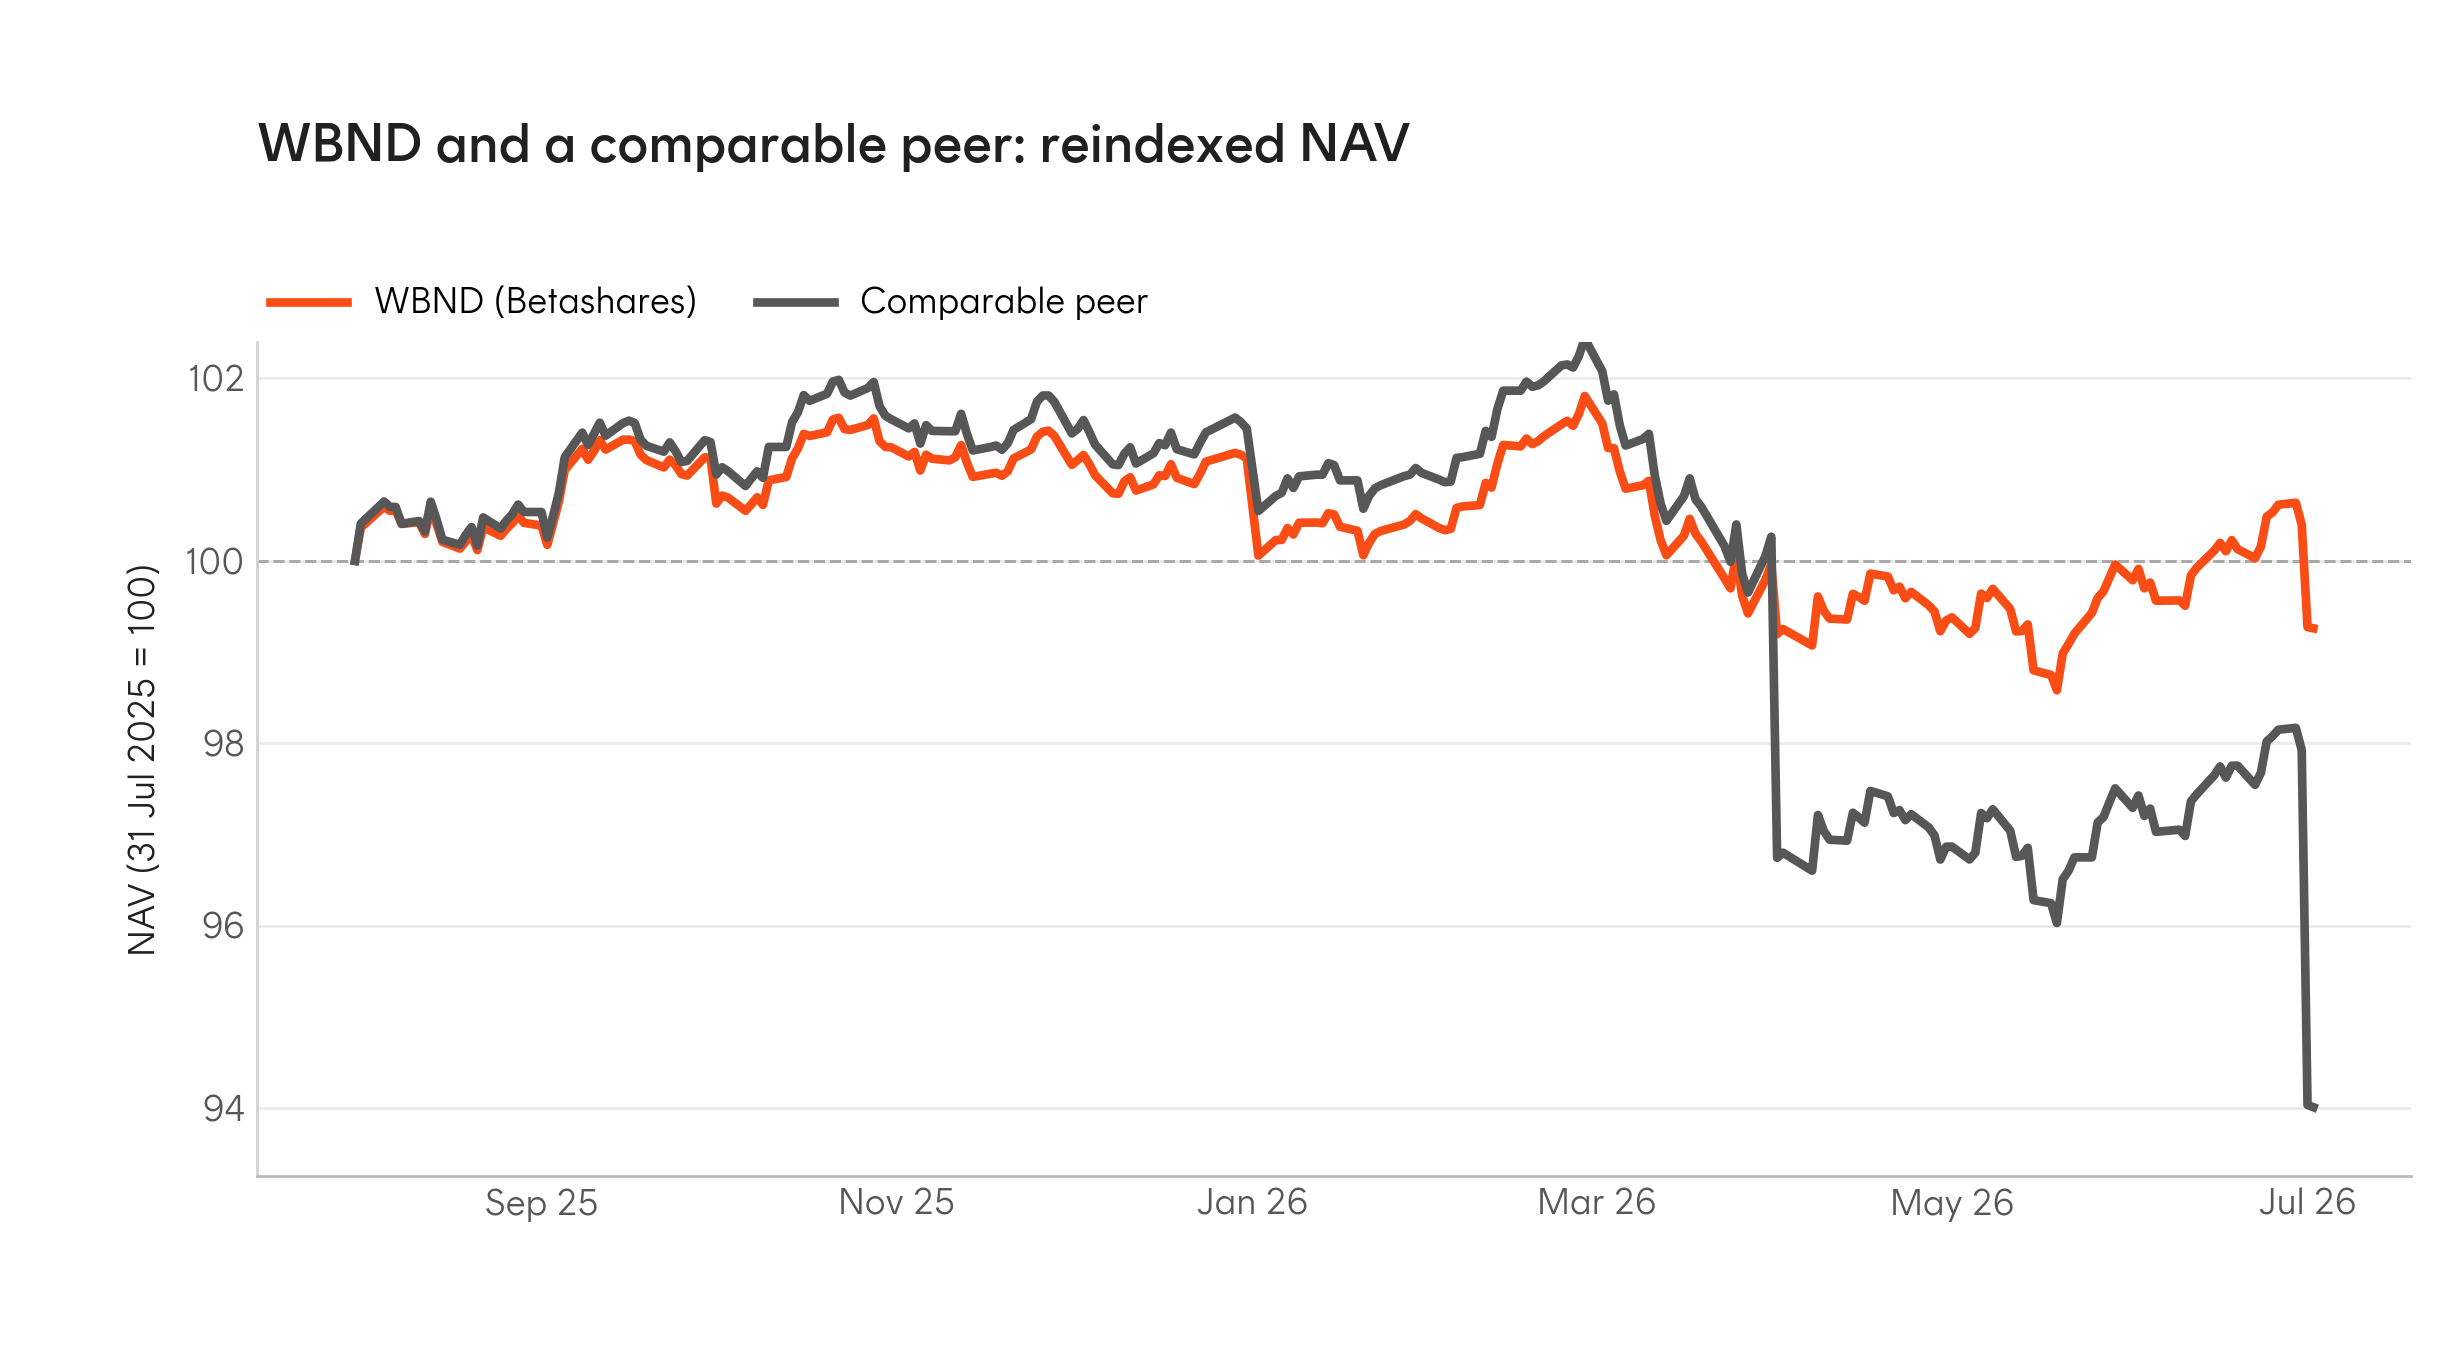
Source: Bloomberg. NAV falls mechanically when a distribution is paid. Both series are reindexed to 100 at WBND’s inception on 31 July 2025.
Those NAV declines do not mean the peer earned less: its cash distributions form part of the total return. Instead, it shows how much more of the outcome was paid out rather than retained in the NAV, potentially bringing forward and increasing the tax obligation for taxpaying investors in that ETF.
WBND, by contrast, has had a TOFA hedging election in place since its launch in 2025. From inception to 30 June 2026, WBND distributed 3.3 per cent, broadly in line with its underlying bond yield, with distributions paid consistently across each quarter. The peer ETF distributed 8.8 per cent, just over three times its total return, with most of the payout landing in the second half of the financial year (Exhibit 2). Similar exposure and a similar pre-tax total return, but a very different investor experience: an even income stream on one side, and a lumpy payout with a potentially larger current tax bill on the other.
Exhibit 2: WBND and a comparable peer, FY2026 quarterly distributions (cents per unit)
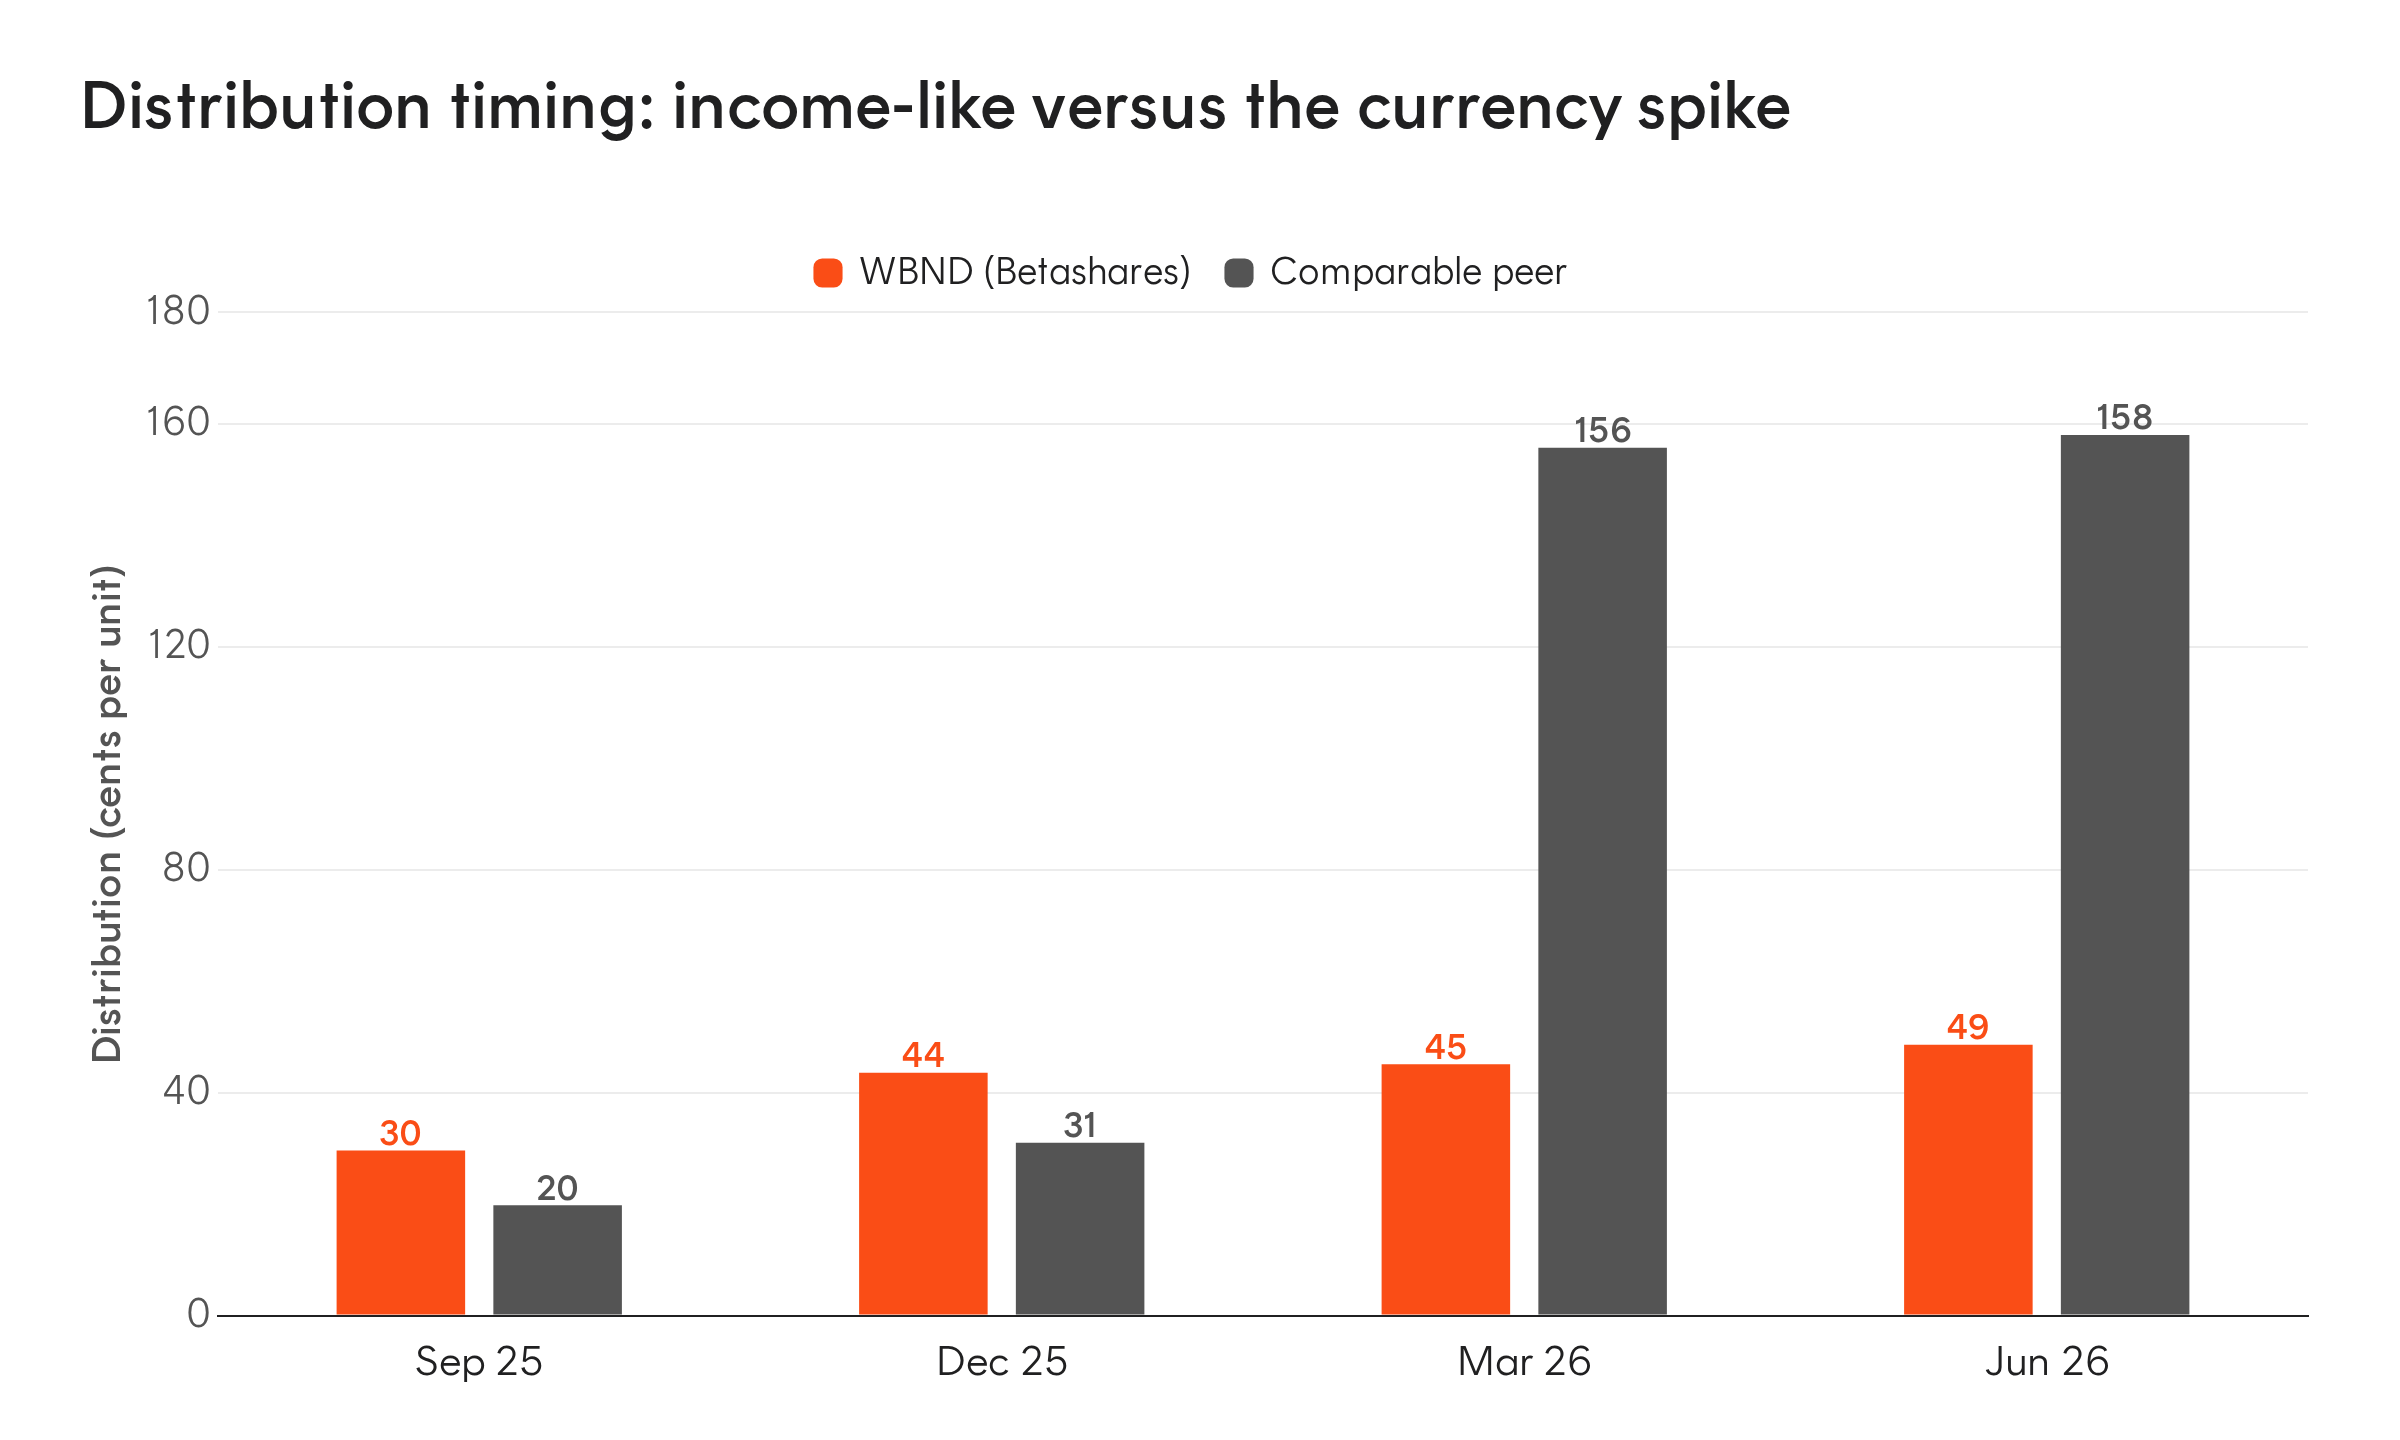
Source: Bloomberg. WBND’s distribution in Sep-25 quarter covers data from its inception date at 31 July 2025 until 30 September 2025.
This pattern is not new, though it is episodic rather than annual. Over the peer ETF’s nine-year record its distribution tracked the underlying bond yield in seven years and spiked well above it in two, FY2021 and FY2026, both years in which the Australian dollar rose. In FY2021 its pre-tax total return was slightly negative, yet it made a large income distribution despite low bond yields at the time. Over its full history, from inception to 30 June 2026, the peer ETF returned 9.4 per cent pre-tax, a little over 1 per cent a year, while its NAV fell 17.7 per cent. The difference is a cumulative income contribution of 27.1 per cent. For taxable investors that may have meant a sizeable current tax liability and potentially a negative after-tax return, depending on their individual circumstances.
Exhibit 3: Comparable peer financial-year return decomposition
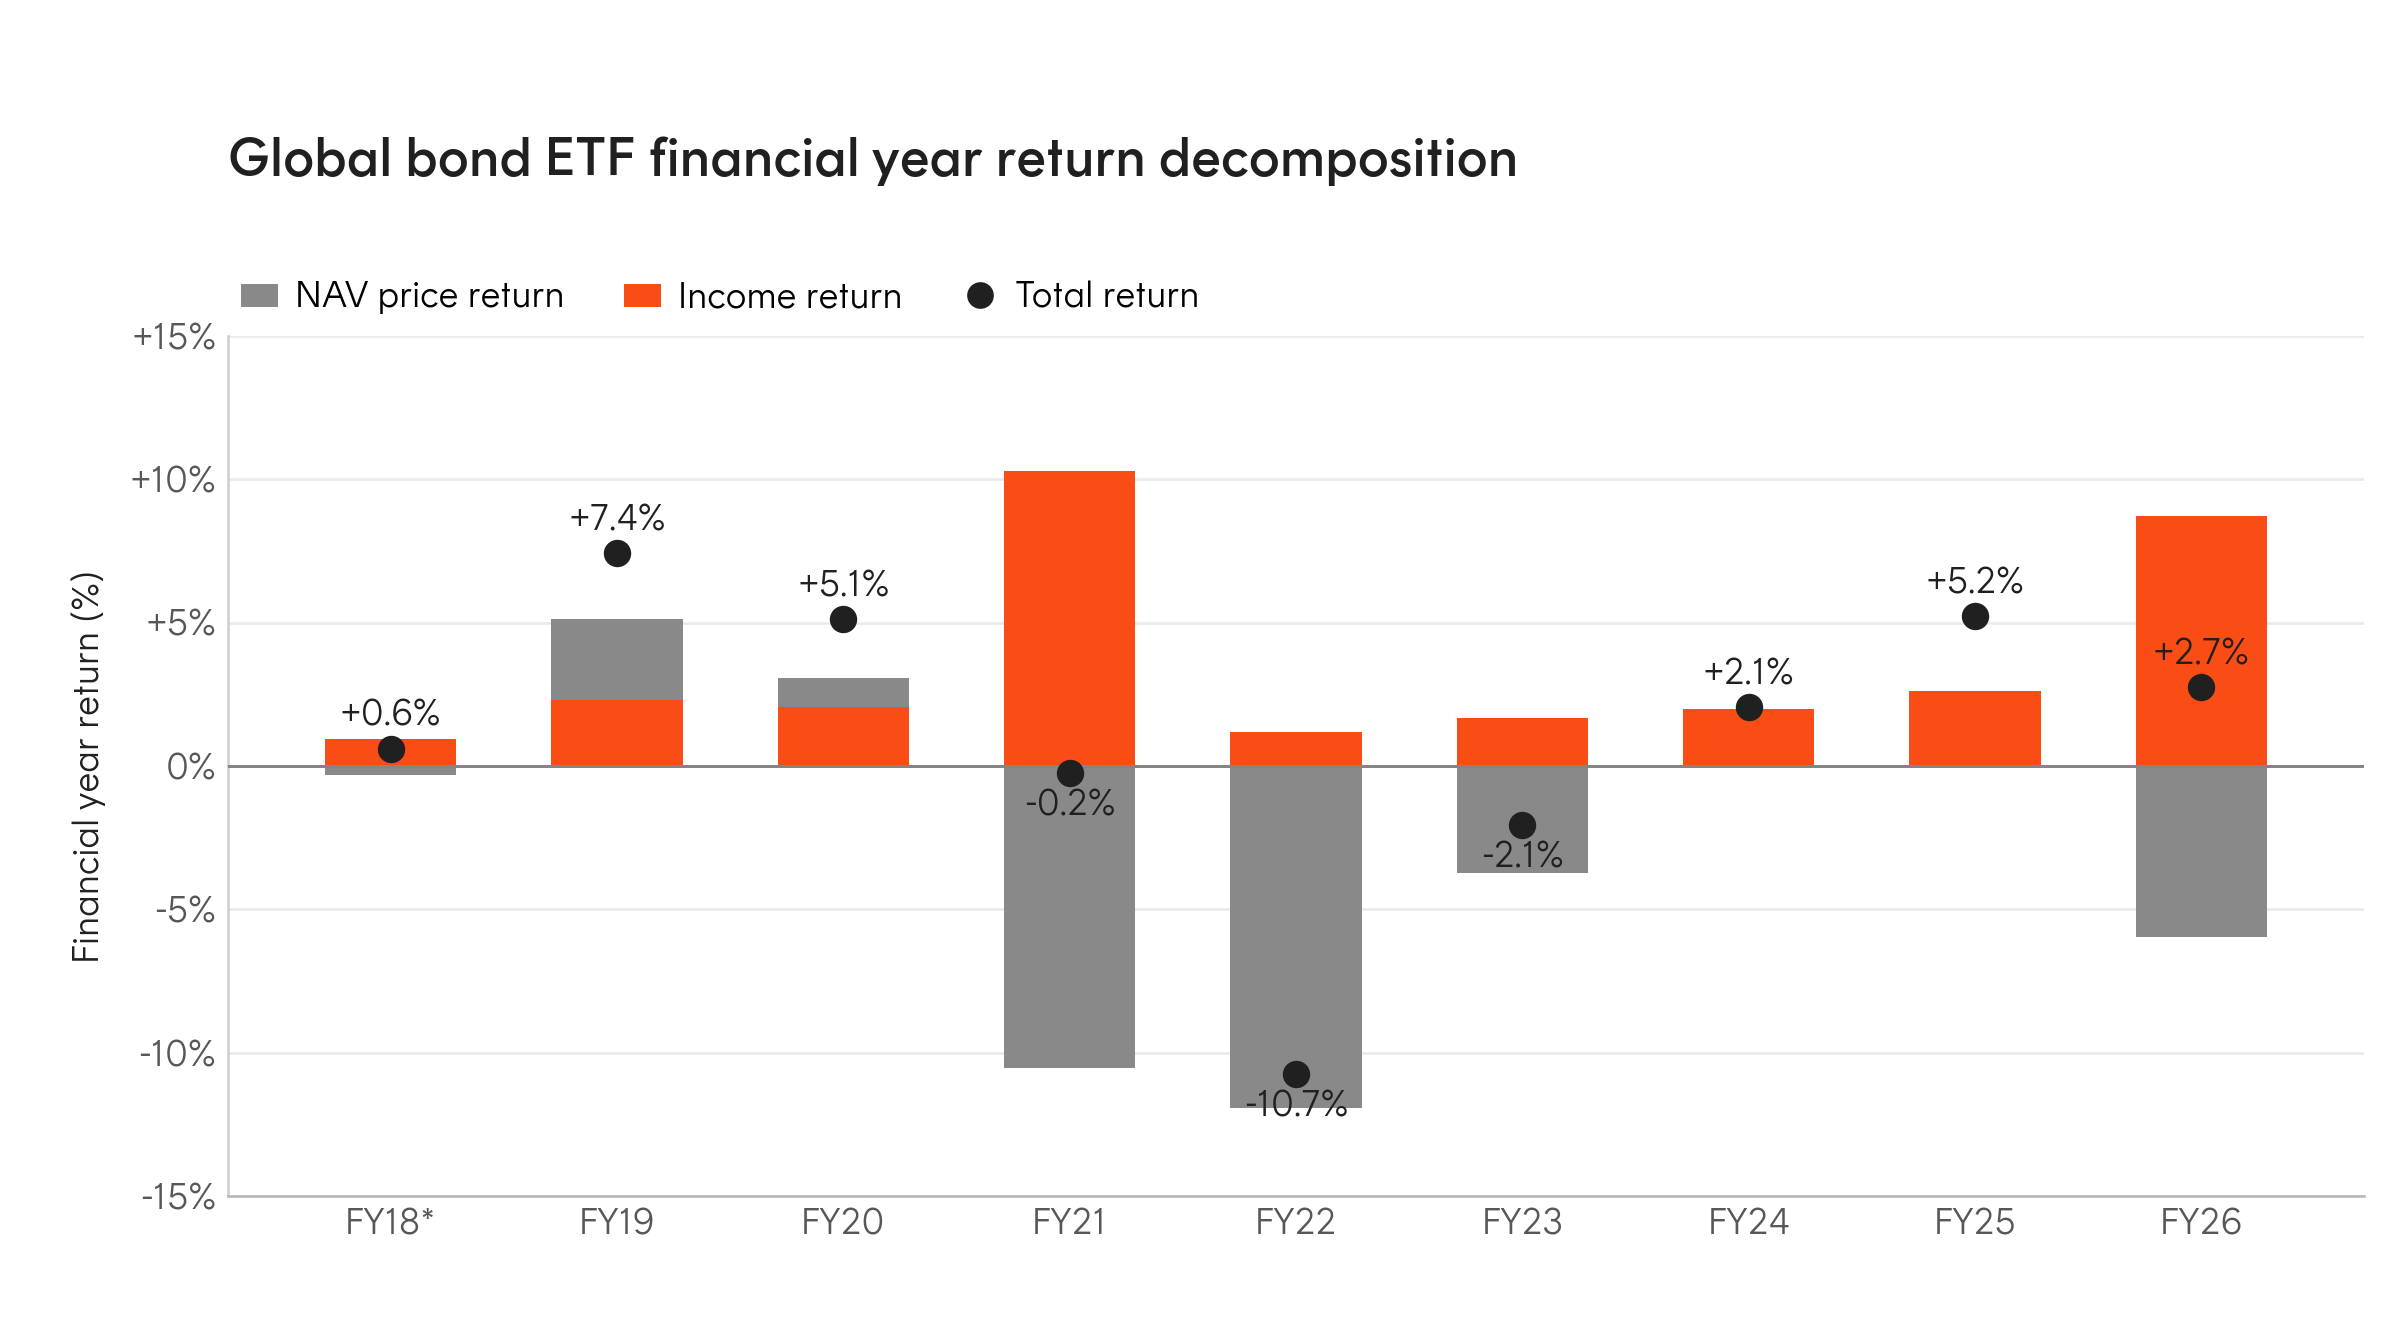
Source: Bloomberg, Betashares. Exhibit 3 covers the peer ETF’s full history; FY18 is a part year from inception in October 2017 to 30 June 2018. Each 30 June NAV is adjusted for the distribution going ex on 1 July, or the next business day. Income return is the residual between total return and NAV return. Past performance is not indicative of future performance.
Exhibit 4: Comparable peer cumulative return decomposition
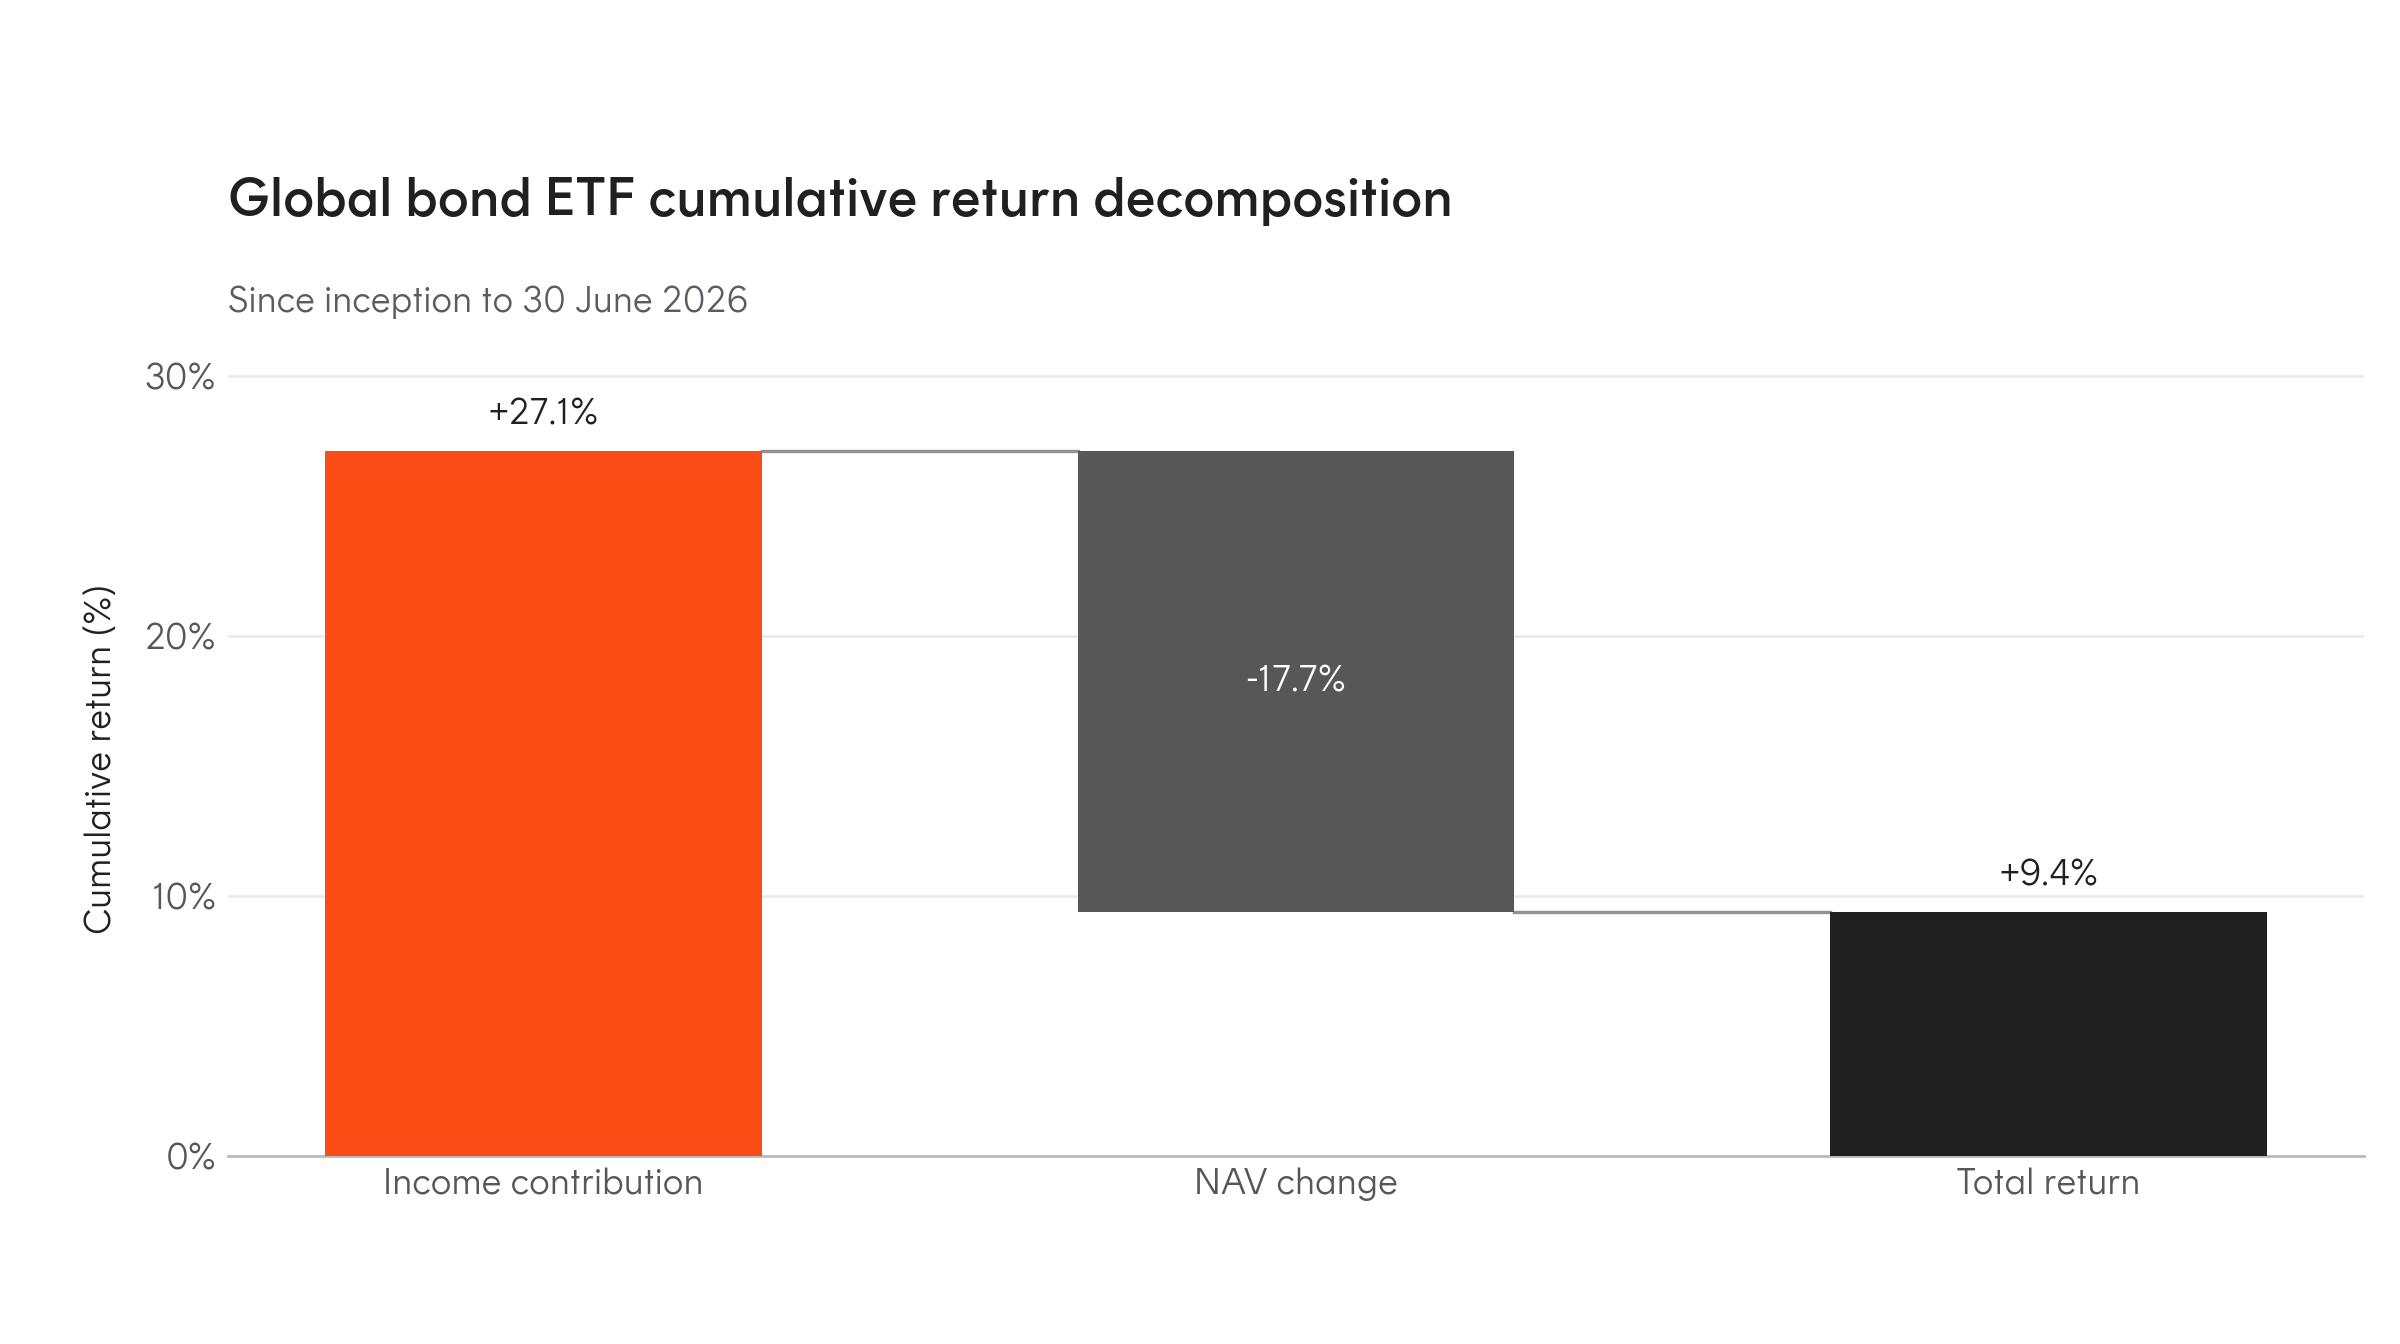
Source: Bloomberg, Betashares. Exhibit 4 covers the peer ETF’s full history, from its inception in October 2017 to 30 June 2026, a period of 8.7 years. Exhibit 4 uses Bloomberg’s cumulative total-return index and unadjusted NAV change from the period endpoints. Income contribution is the residual between total return and NAV change. Past performance is not indicative of future performance.
This is not the only fund
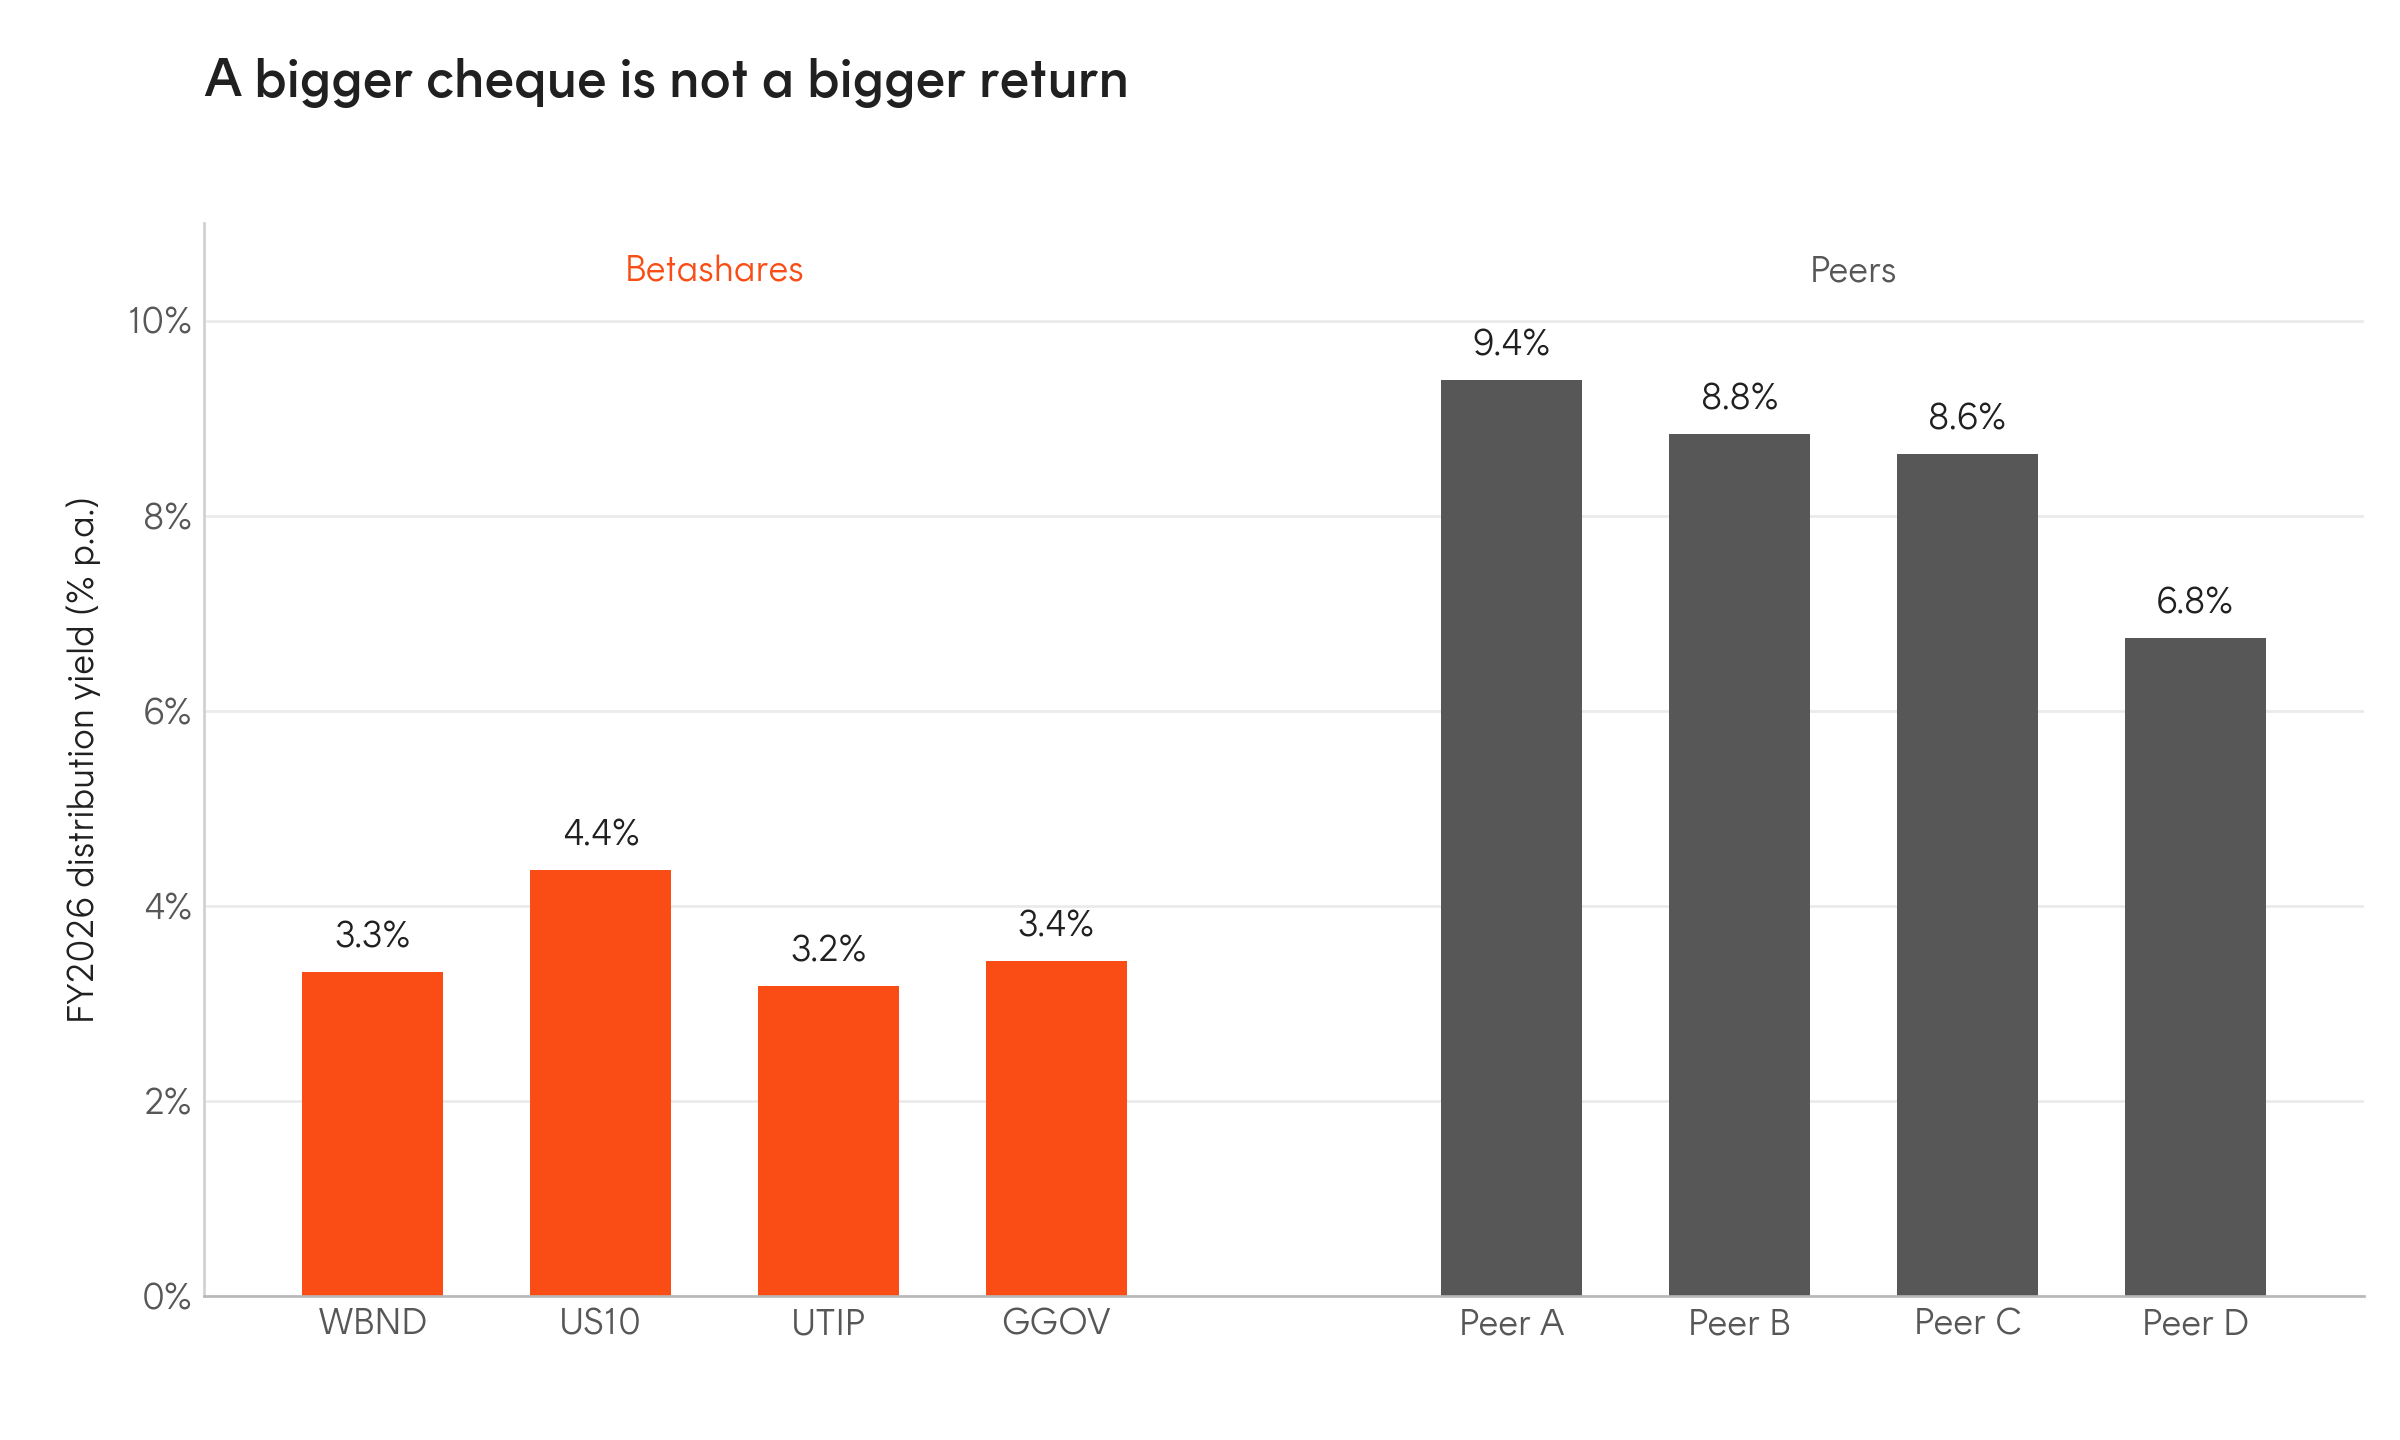
The WBND comparison is not an isolated result. Across the currency-hedged bond ETFs shown in Exhibit 5, the Betashares funds distributed between 3.2 and 4.4 per cent in FY2026 while the peer ETFs distributed between 6.8 and 9.4 per cent. The exposures are not identical, and cash distributions alone do not establish a fund’s taxable income or its TOFA position. What the chart does show is why it is worth looking past a headline distribution yield to each fund’s tax attribution and hedge accounting disclosures.
Exhibit 5: FY2026 distribution yields, Betashares vs selected peers
Source: Bloomberg, Betashares. FY2026 cash distributions only. Exposures differ across the funds shown. A cash distribution does not by itself establish a fund’s taxable income or its TOFA position.
The distribution is following the currency, not the bonds
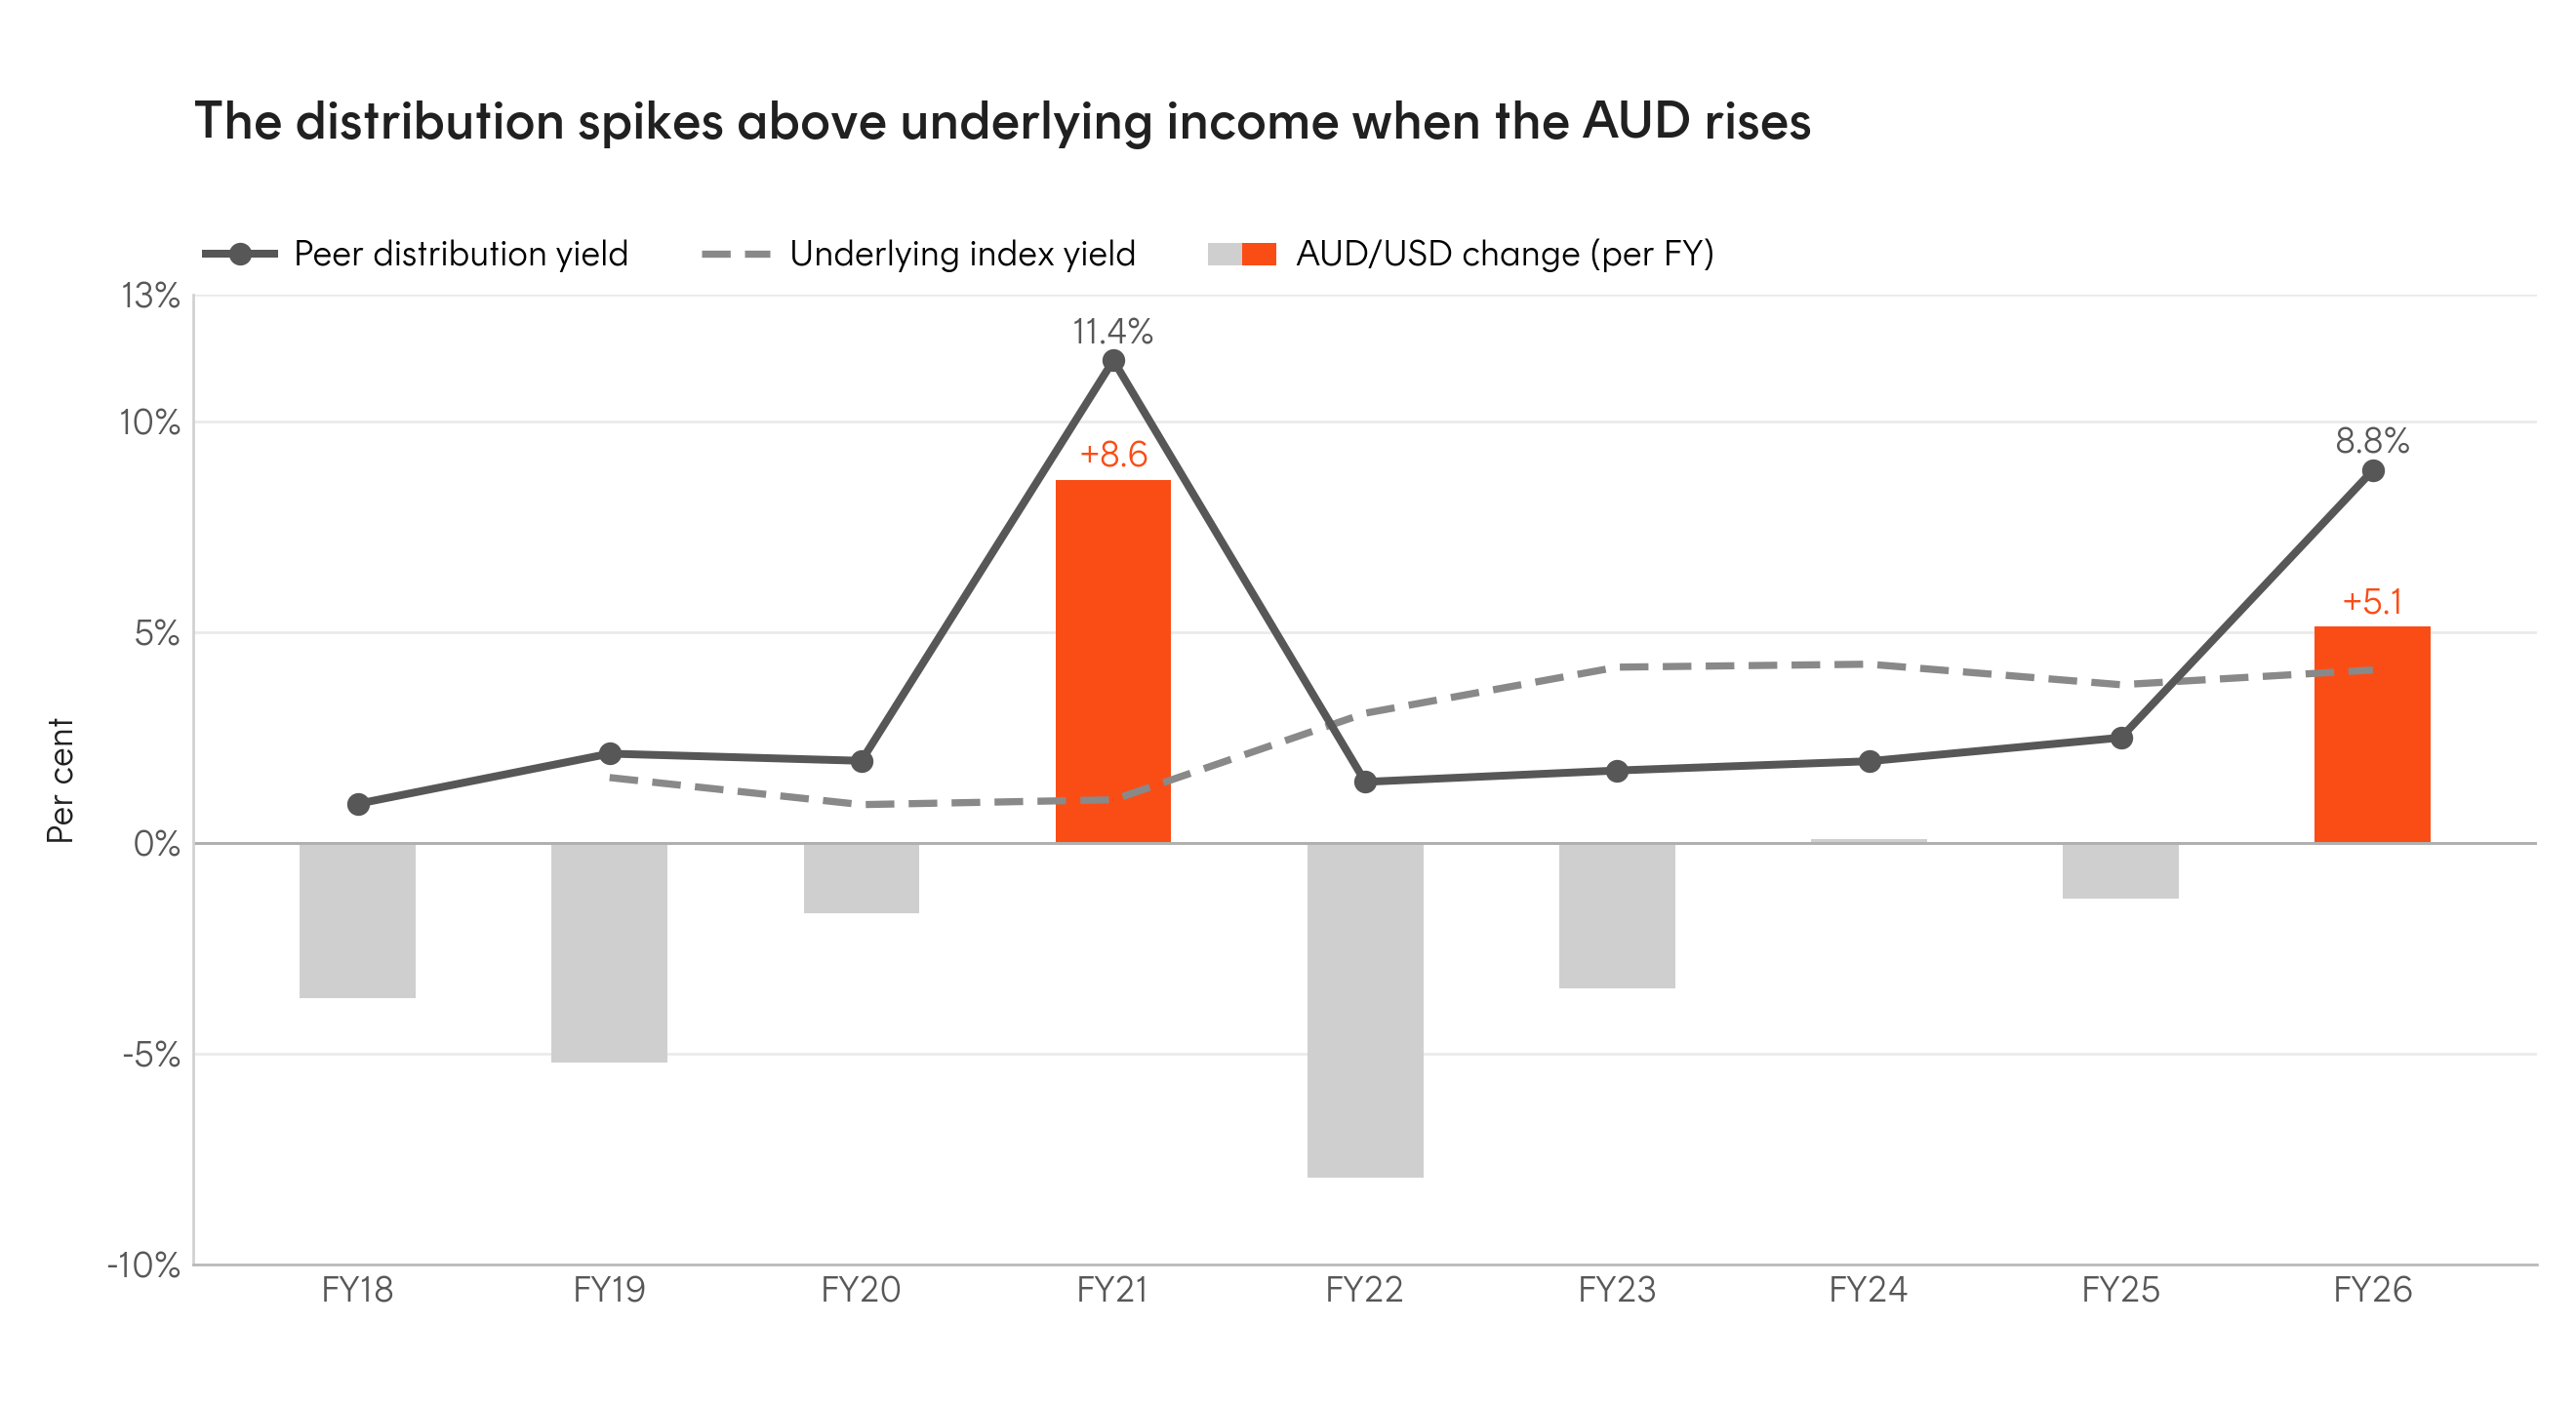
Why should two ETFs with comparable exposure behave so differently? Because their distributions track different things. Global aggregate bond index yields have ranged between roughly 1 and 4 per cent over the eight years to June 2026. The peer ETF’s distribution followed that yield in most years, then spiked far above it in the two years the Australian dollar rose materially, FY2021 and FY2026 (Exhibit 6). Each spike is broadly the bond yield plus the currency move, which is consistent with a realised hedge gain being paid out as income rather than a return earned on the bonds. Where a fund has not made a TOFA hedging election, its distributions can be driven by the currency movements.
Exhibit 6: Distribution yield vs underlying index yield, and the AUD, by financial year
Source: Bloomberg, Betashares. Underlying index yield is the yield to worst on the peer ETF’s own benchmark index, sampled at each 30 June; not available for FY2018. Peer distribution yield is cash distributions for the financial year as a percentage of the year-end price. AUD/USD change is measured 30 June to 30 June; orange bars mark the financial years in which the AUD rose.
Why the Betashares funds behave differently
The difference comes down to a single decision. Betashares has made a TOFA hedging election for these funds. Broadly, the election allows gains and losses on an eligible hedge to take the same tax character and timing as the item being hedged, instead of being brought to account separately each year. For a currency-hedged bond fund that means the tax consequences of the hedge are recognised in line with the underlying bonds, while distributions continue to track the bond portfolio’s yield. The result is what investors expect from a bond fund: income anchored to the bond yield, not to currency swings.
The bottom line
The question is not how large a cash distribution is, but what drives it and how the currency hedge is taxed. That is what the TOFA hedging election is designed for.