



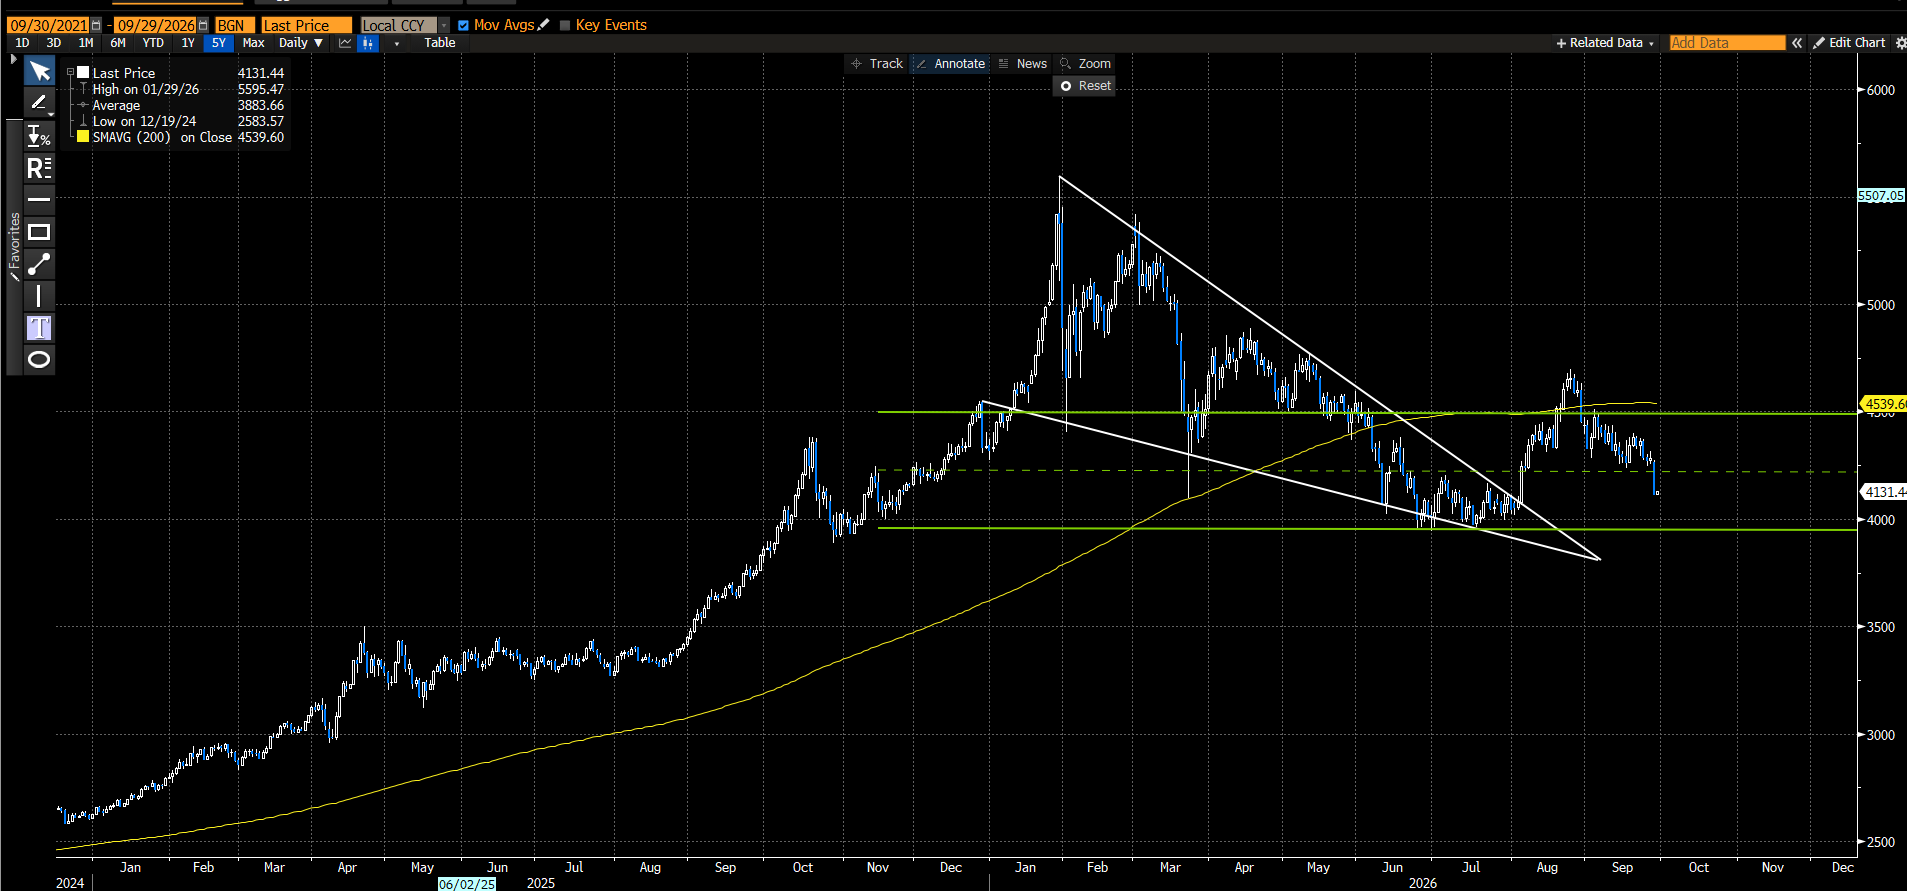
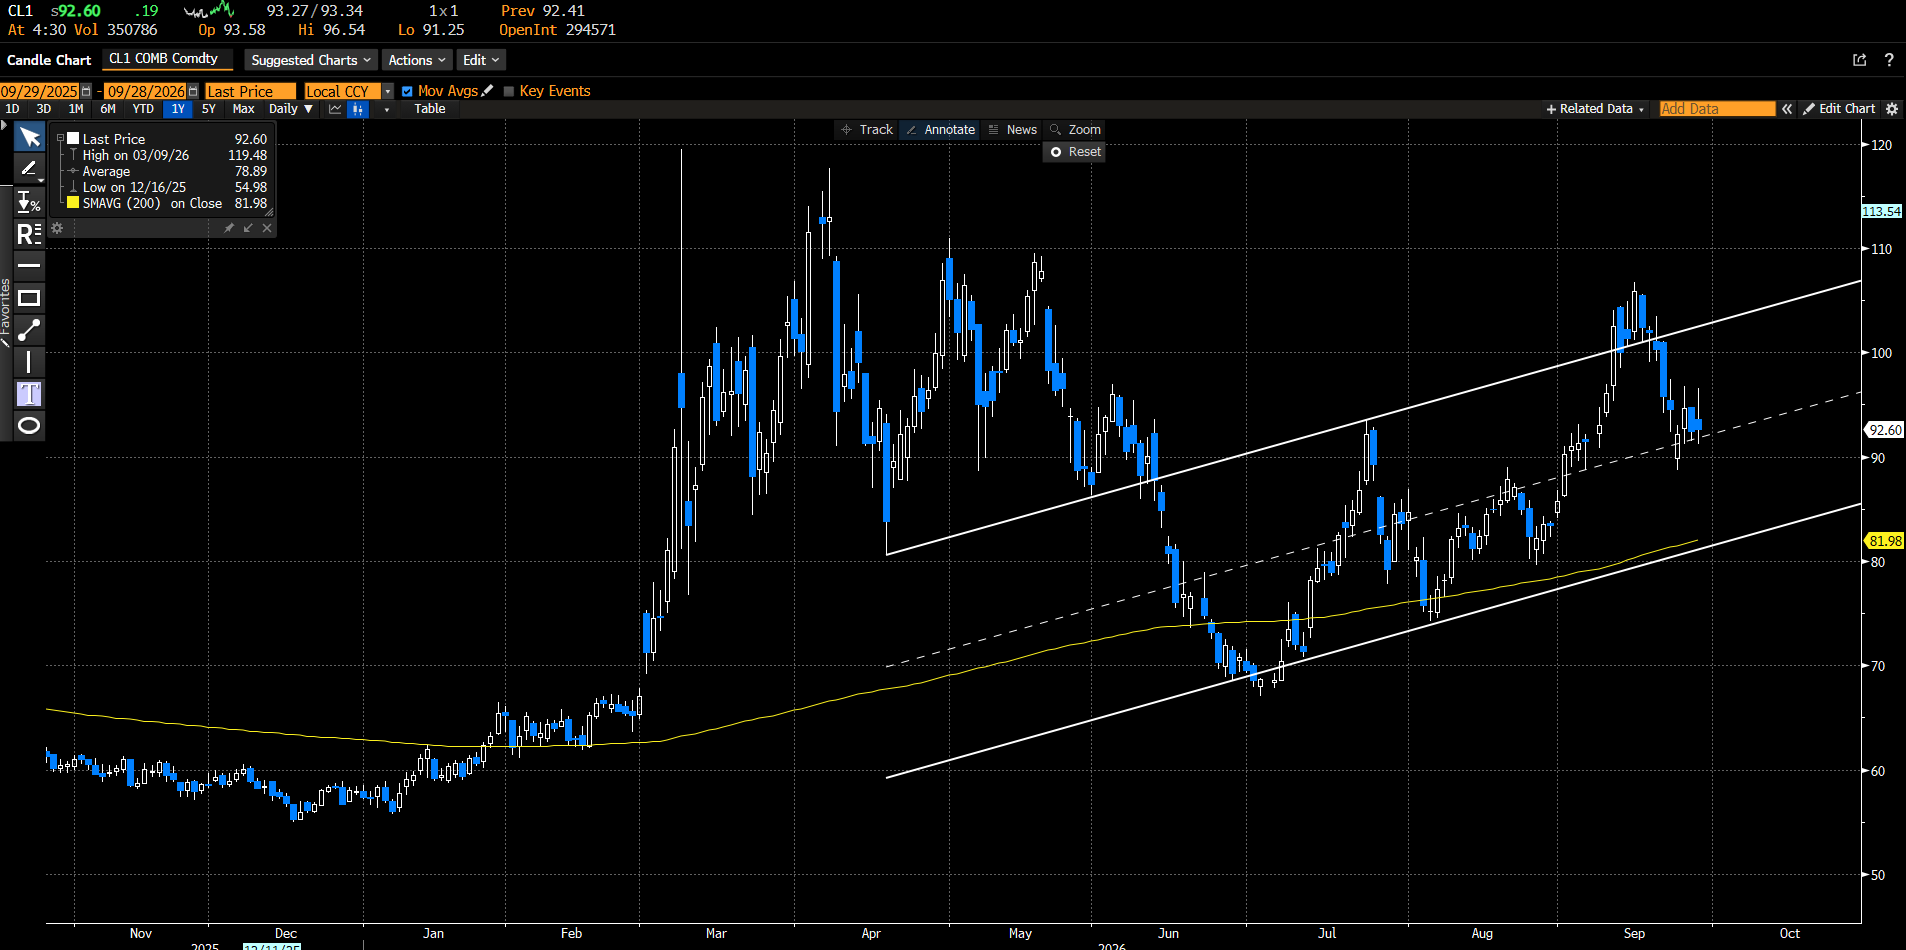
Gold is consolidating after being unable to hold above its 200-day moving average, while crude oil is trading in an upward trend channel.
Spot gold
- After breaking out of the wedge pattern (white), gold tested the 200-day moving average (yellow), but was unable to hold above that key level.
- Gold appears to be trading inside a sideways consolidation, with the upper and lower channel lines (green) acting as key resistance and support. However, watch for a break below the prior lows near US$4,000, which would be bearish and could see prices move towards US$3,500.
- In the meantime, a healthy period of sideways consolidation following a downturn may help prices establish a base before moving into the next phase of the cycle.
Daily chart
Source: Bloomberg. Past performance is not an indicator of future performance. You cannot invest directly in an index.
Fund implementation ideas
Crude oil futures
- WTI crude oil futures have been trading within an upward sloping trend channel (white), with prices currently consolidating around the middle of the channel (dashed white line).
- Should prices fall towards the lower end of the channel, this may offer an attractive long entry in line with the prevailing trend. While prices remain near the middle of the channel, there may be little to do other than wait for a move towards either range.
Daily chart
Source: Bloomberg. Past performance is not an indicator of future performance.
Fund implementation ideas
The Solactive Developed Markets ex Australia Momentum Select Index
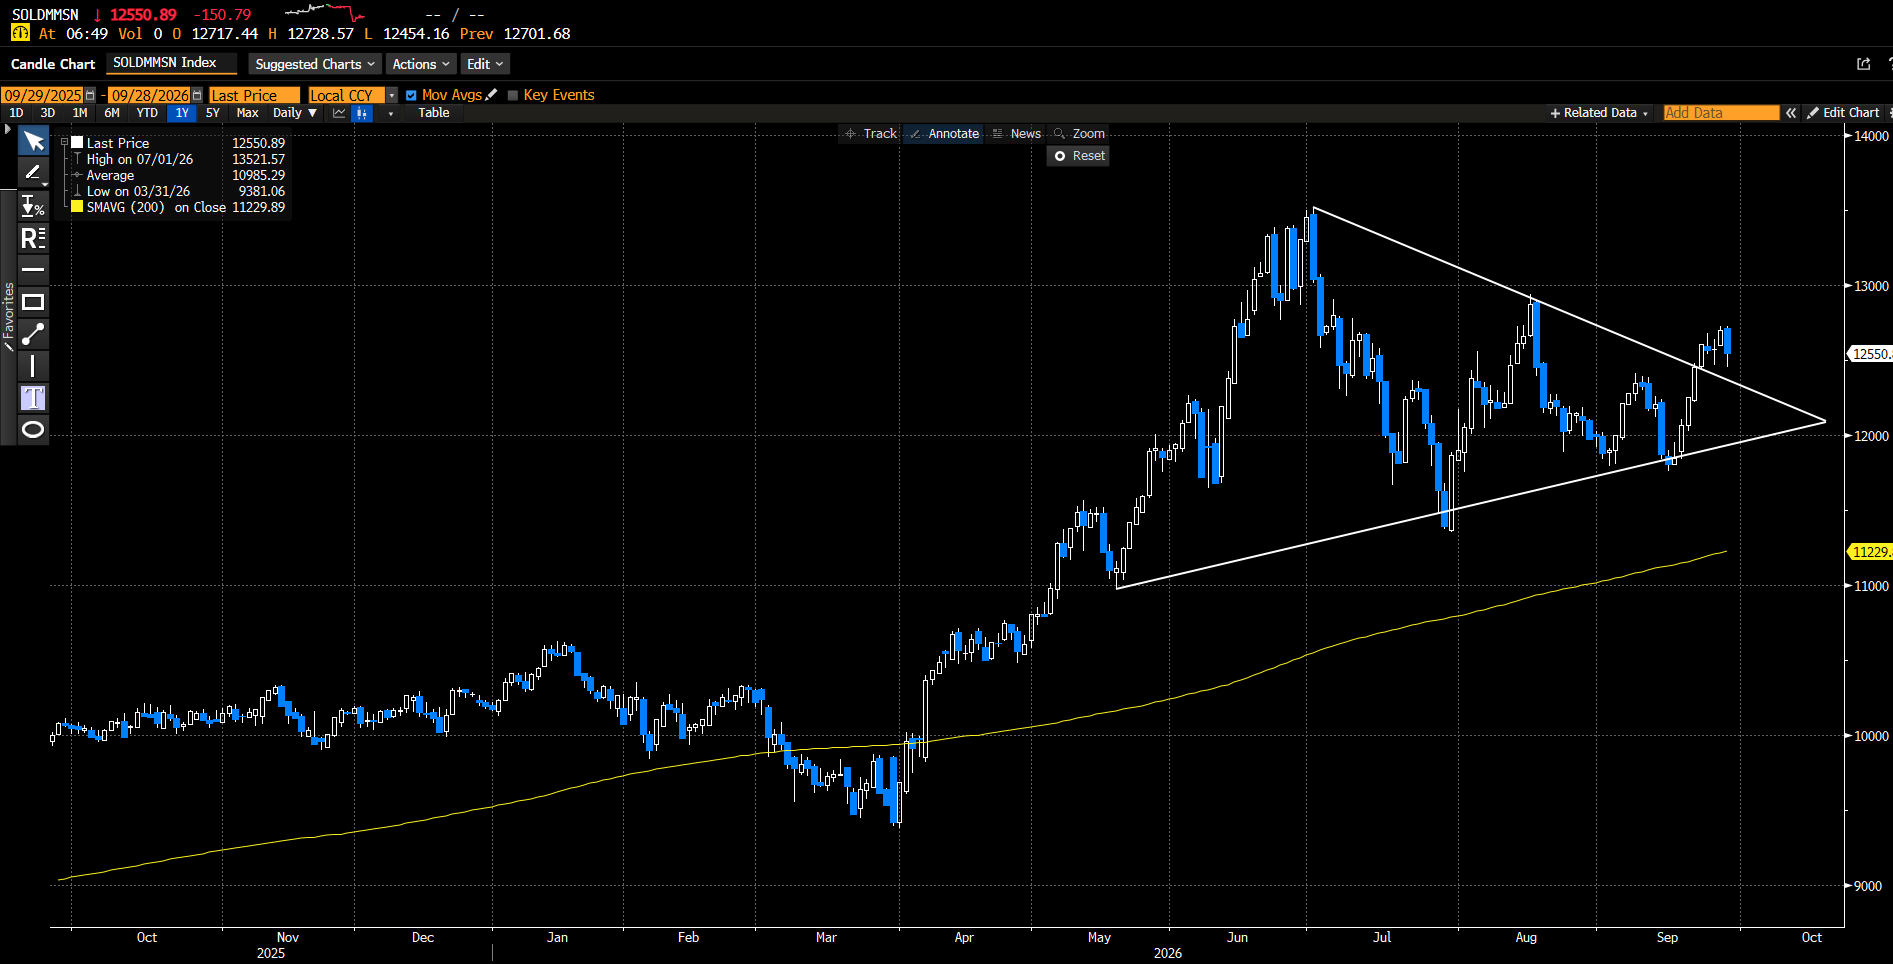
- The Solactive Developed Markets ex Australia Momentum Select Index, which represents a basket of global companies exhibiting strong price momentum, has broken out of a wedge pattern (white).
- Prices are consolidating above the upper wedge line, which is now acting as support. Should prices retrace towards this level and hold, it may offer an attractive risk/return entry in line with the upside breakout.
Daily chart
Source: Bloomberg. Past performance is not an indicator of future performance. You cannot invest directly in an index.
Fund implementation ideas
| Bullish |
|---|
| GTUM Global Momentum ETF |
About Betashares Technical Watch series
In this regular monthly Technical Watch series, I provide a snapshot of what I am currently seeing within the charts.
I am aiming to make this series as helpful as possible, so I strongly encourage readers to request a particular analysis from me. To this end, I will try to include at least one ‘reader’s choice’ chart or a chart of particular interest.
When it comes to technical analysis and charting, one should always try to put emotion and personal opinions about the markets aside in order to focus on what the charts are showing. Of course, these notes provide general information only and readers should form their own views about the outlook for markets.