Charts of the month – June 2026
Markets extended gains through the first half of 2026 despite Middle East tensions, but will transits through Hormuz to pre-war levels and the AI capex train chug on for the rally to continue?


Despite geopolitical fragmentation from the Middle East conflict, markets have continued to extend gains throughout the first half of the year supported by excess oil inventories and hyperscaler AI capex spending.
While global growth remains resilient which should provide a healthy undercurrent for continued equity market performance into the second half, the path will likely experience bouts of volatility should fatigue settle into the AI theme and the flow of vessel traffic through the Strait of Hormuz remains obstructed.
From divergent central bank moves to the semiconductor “chip wreck” in equity markets, here are five charts below that defined the month of June.
1: Central banks diverge
The inflation shock brought on by the Iran war saw the meetings of the world’s major central banks produce a range of outcomes in the month of June. The ECB (European Central Bank) hiked 25bps to 2.25%, its first increase since 2023, while the BoJ (Bank of Japan) raised rates to 1% (the highest since 1995) as it normalises policy amid a weak yen and rising import costs.
Meanwhile the RBA (Reserve Bank of Australia) held at 4.35% after three consecutive hikes this year, the BoE (Bank of England) held at 3.75%, and the US Federal Reserve under new Chairman Kevin Warsh, also held the Fed funds target at 3.50% – 3.75% although the underlying tone in his first official press conference leaned hawkish.
The divergence in these policy moves reflect differences in local economic conditions, policy starting points, and central bank’s attitudes towards inflation.
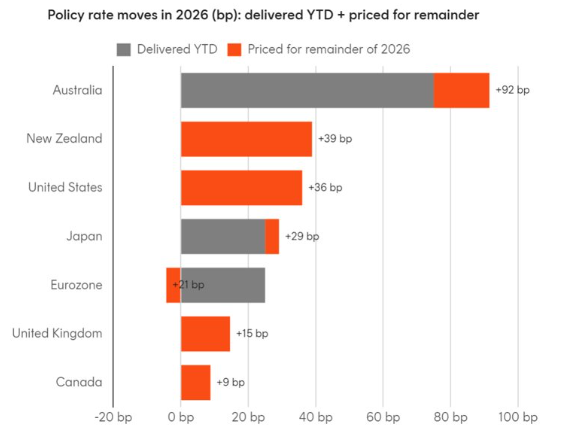
Source: Bloomberg, Betashares. As at 19 June 2026.
2: Equal weight gains amid AI chip wreck
The AI driven bull market rally faced wobbles throughout June as it encountered higher than expected payrolls and CPI print, with markets now pricing in at least one rate hike by year end at time of writing. Combined with extended positioning and valuations priced for perfection across the hyperscalers, the S&P 500 sold off 3.1% over the month in response.
Beneath the headline weakness however, the collapse in oil prices has created a rotation in sector performance with cyclical areas of the market such as financials and industrials supporting the equal-weight S&P 500 Index which gained 2% for the month.
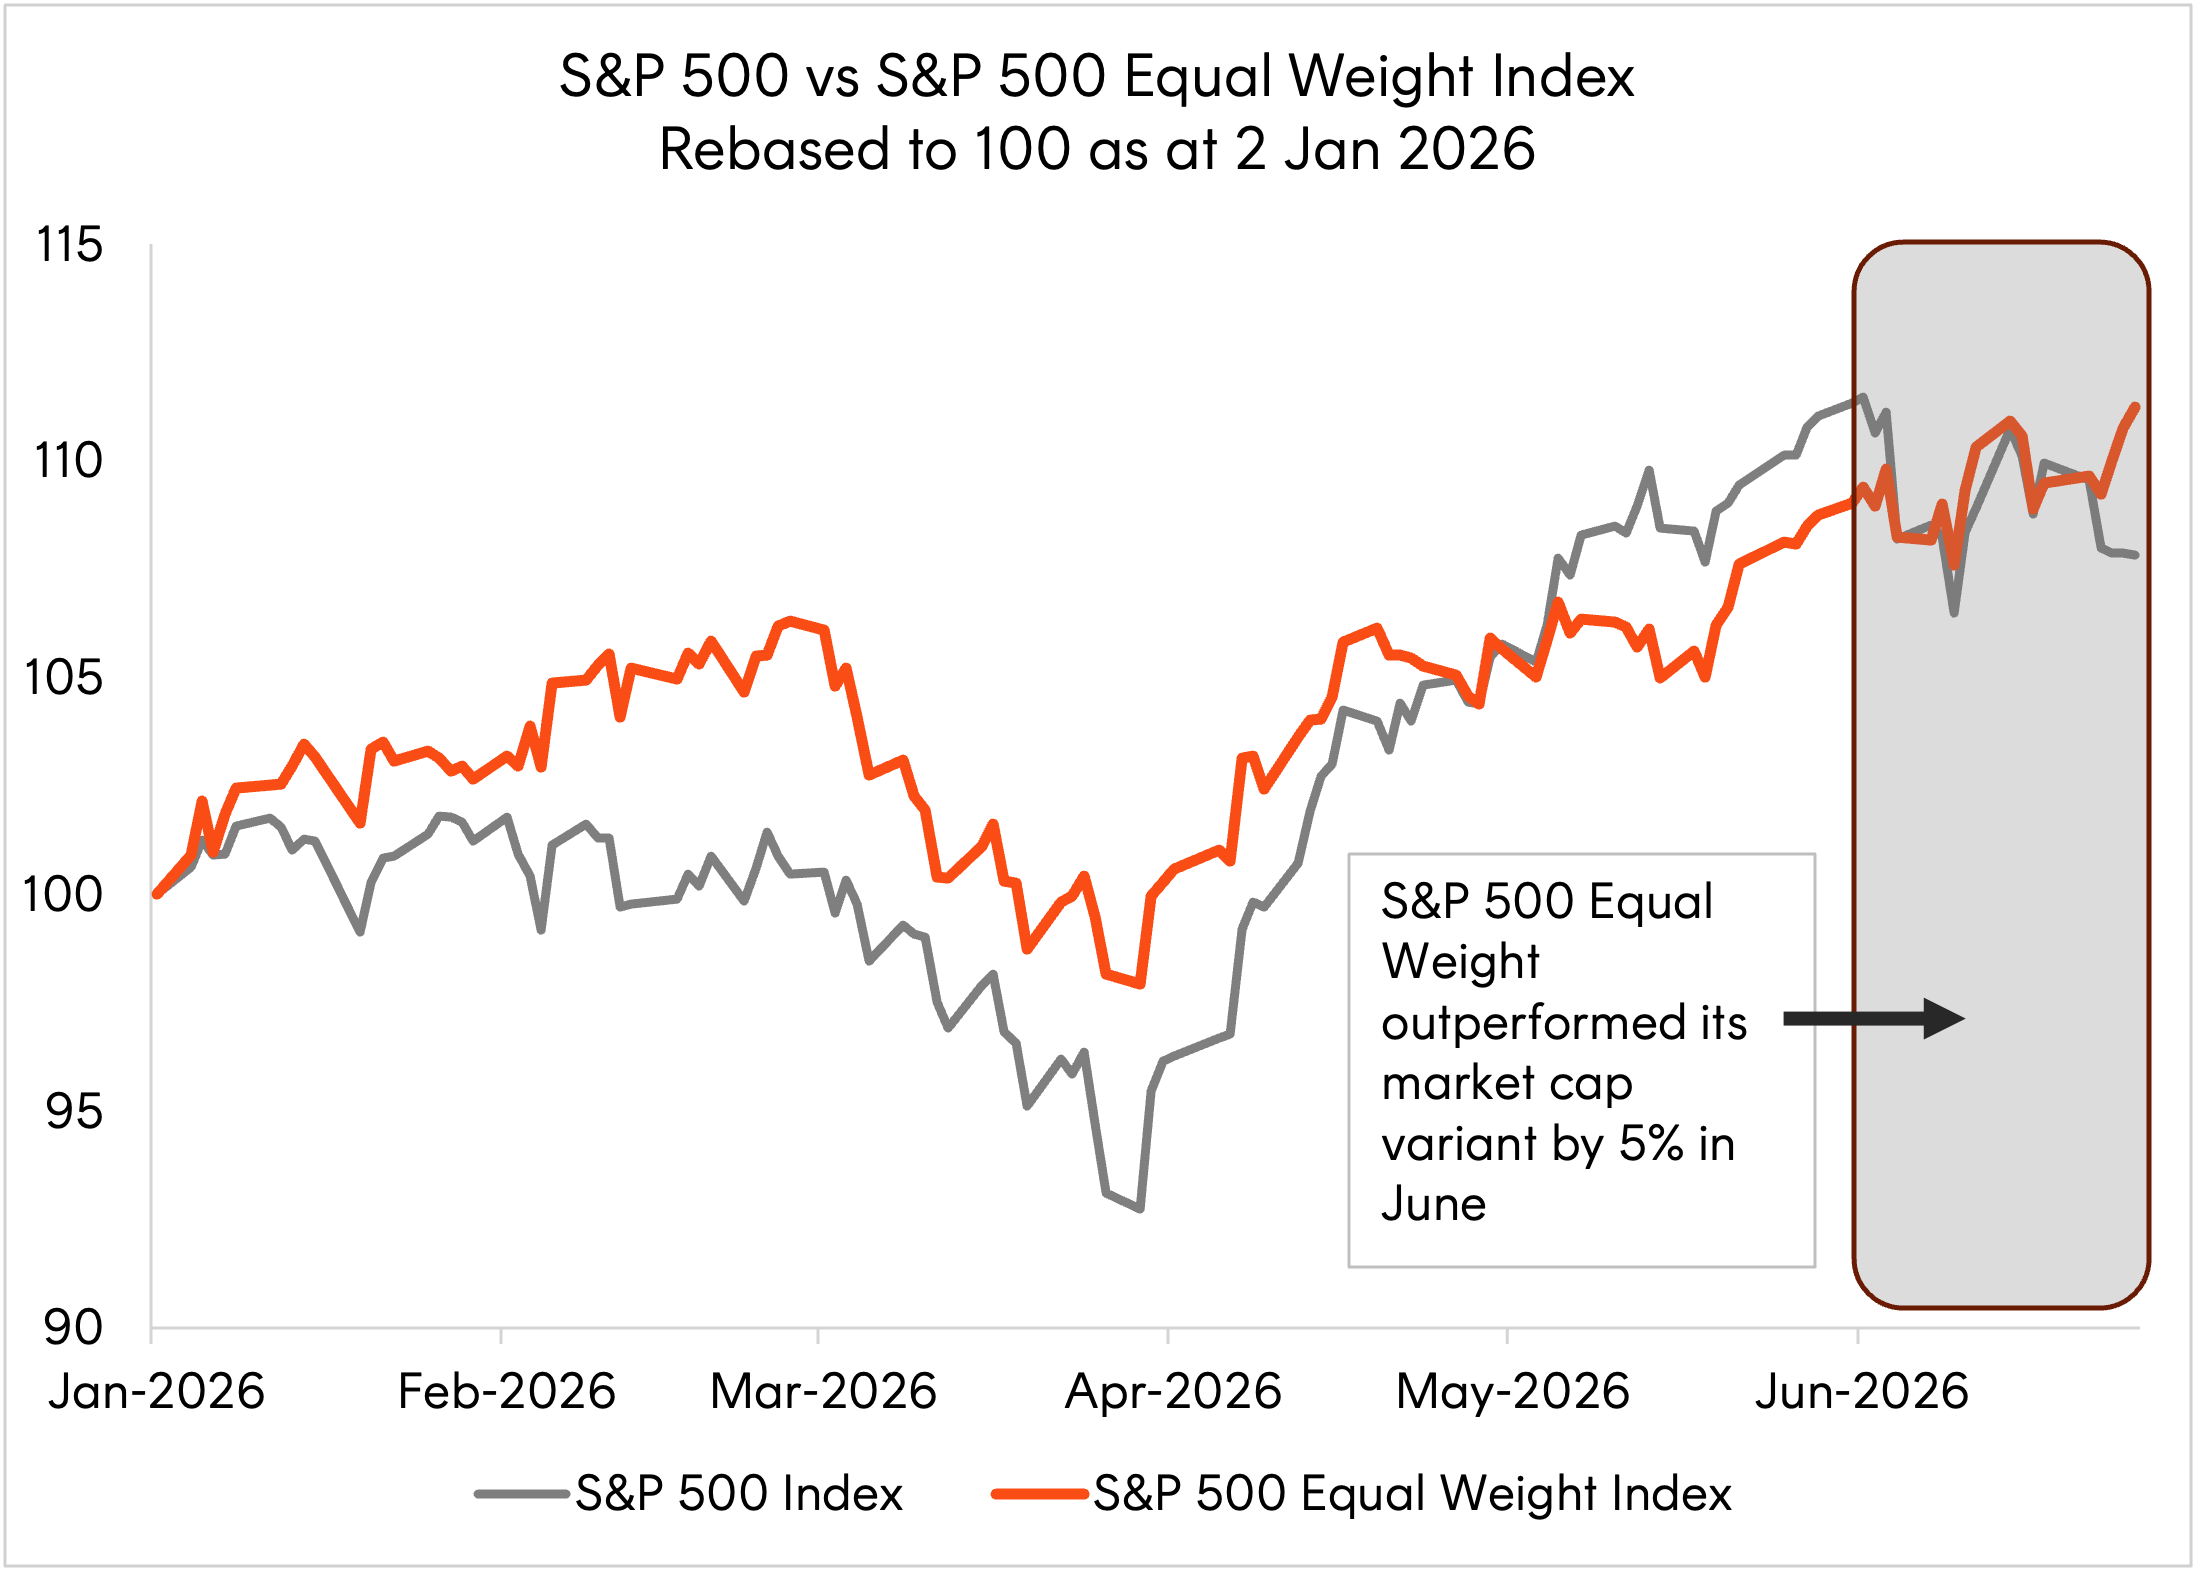
Source: Bloomberg. As at 26 June 2026. You cannot invest directly in an index. Past performance is not an indicator of future performance.
3: Memory is the name of the game
Despite the bout of volatility in memory and semiconductor names globally on June 23, markets were quick to rebound the following day following strong earnings results from US memory chip manufacturer Micron.
The company raised Q4 guidance to US$50 billion with gross margins expected to reach approximately 86% off the back of structural demand for both DRAM and NAND memory chips. CEO Sanjay Mehrotra cited capacity will likely remain tight at least throughout 2027 given the high costs associated with building greenfield fabs, shortage of workers with critical trade skills and complex regulations reducing the rate at which supply can be added.
While sentiment can whipsaw in reaction to pronounced share price moves, the forecast operating profits across the ‘Big Three’ memory chip makers (Samsung, SK Hynix and Micron) of around US$800 billion throughout 2027 & 2028 will likely put a floor under any further weakness in these names.
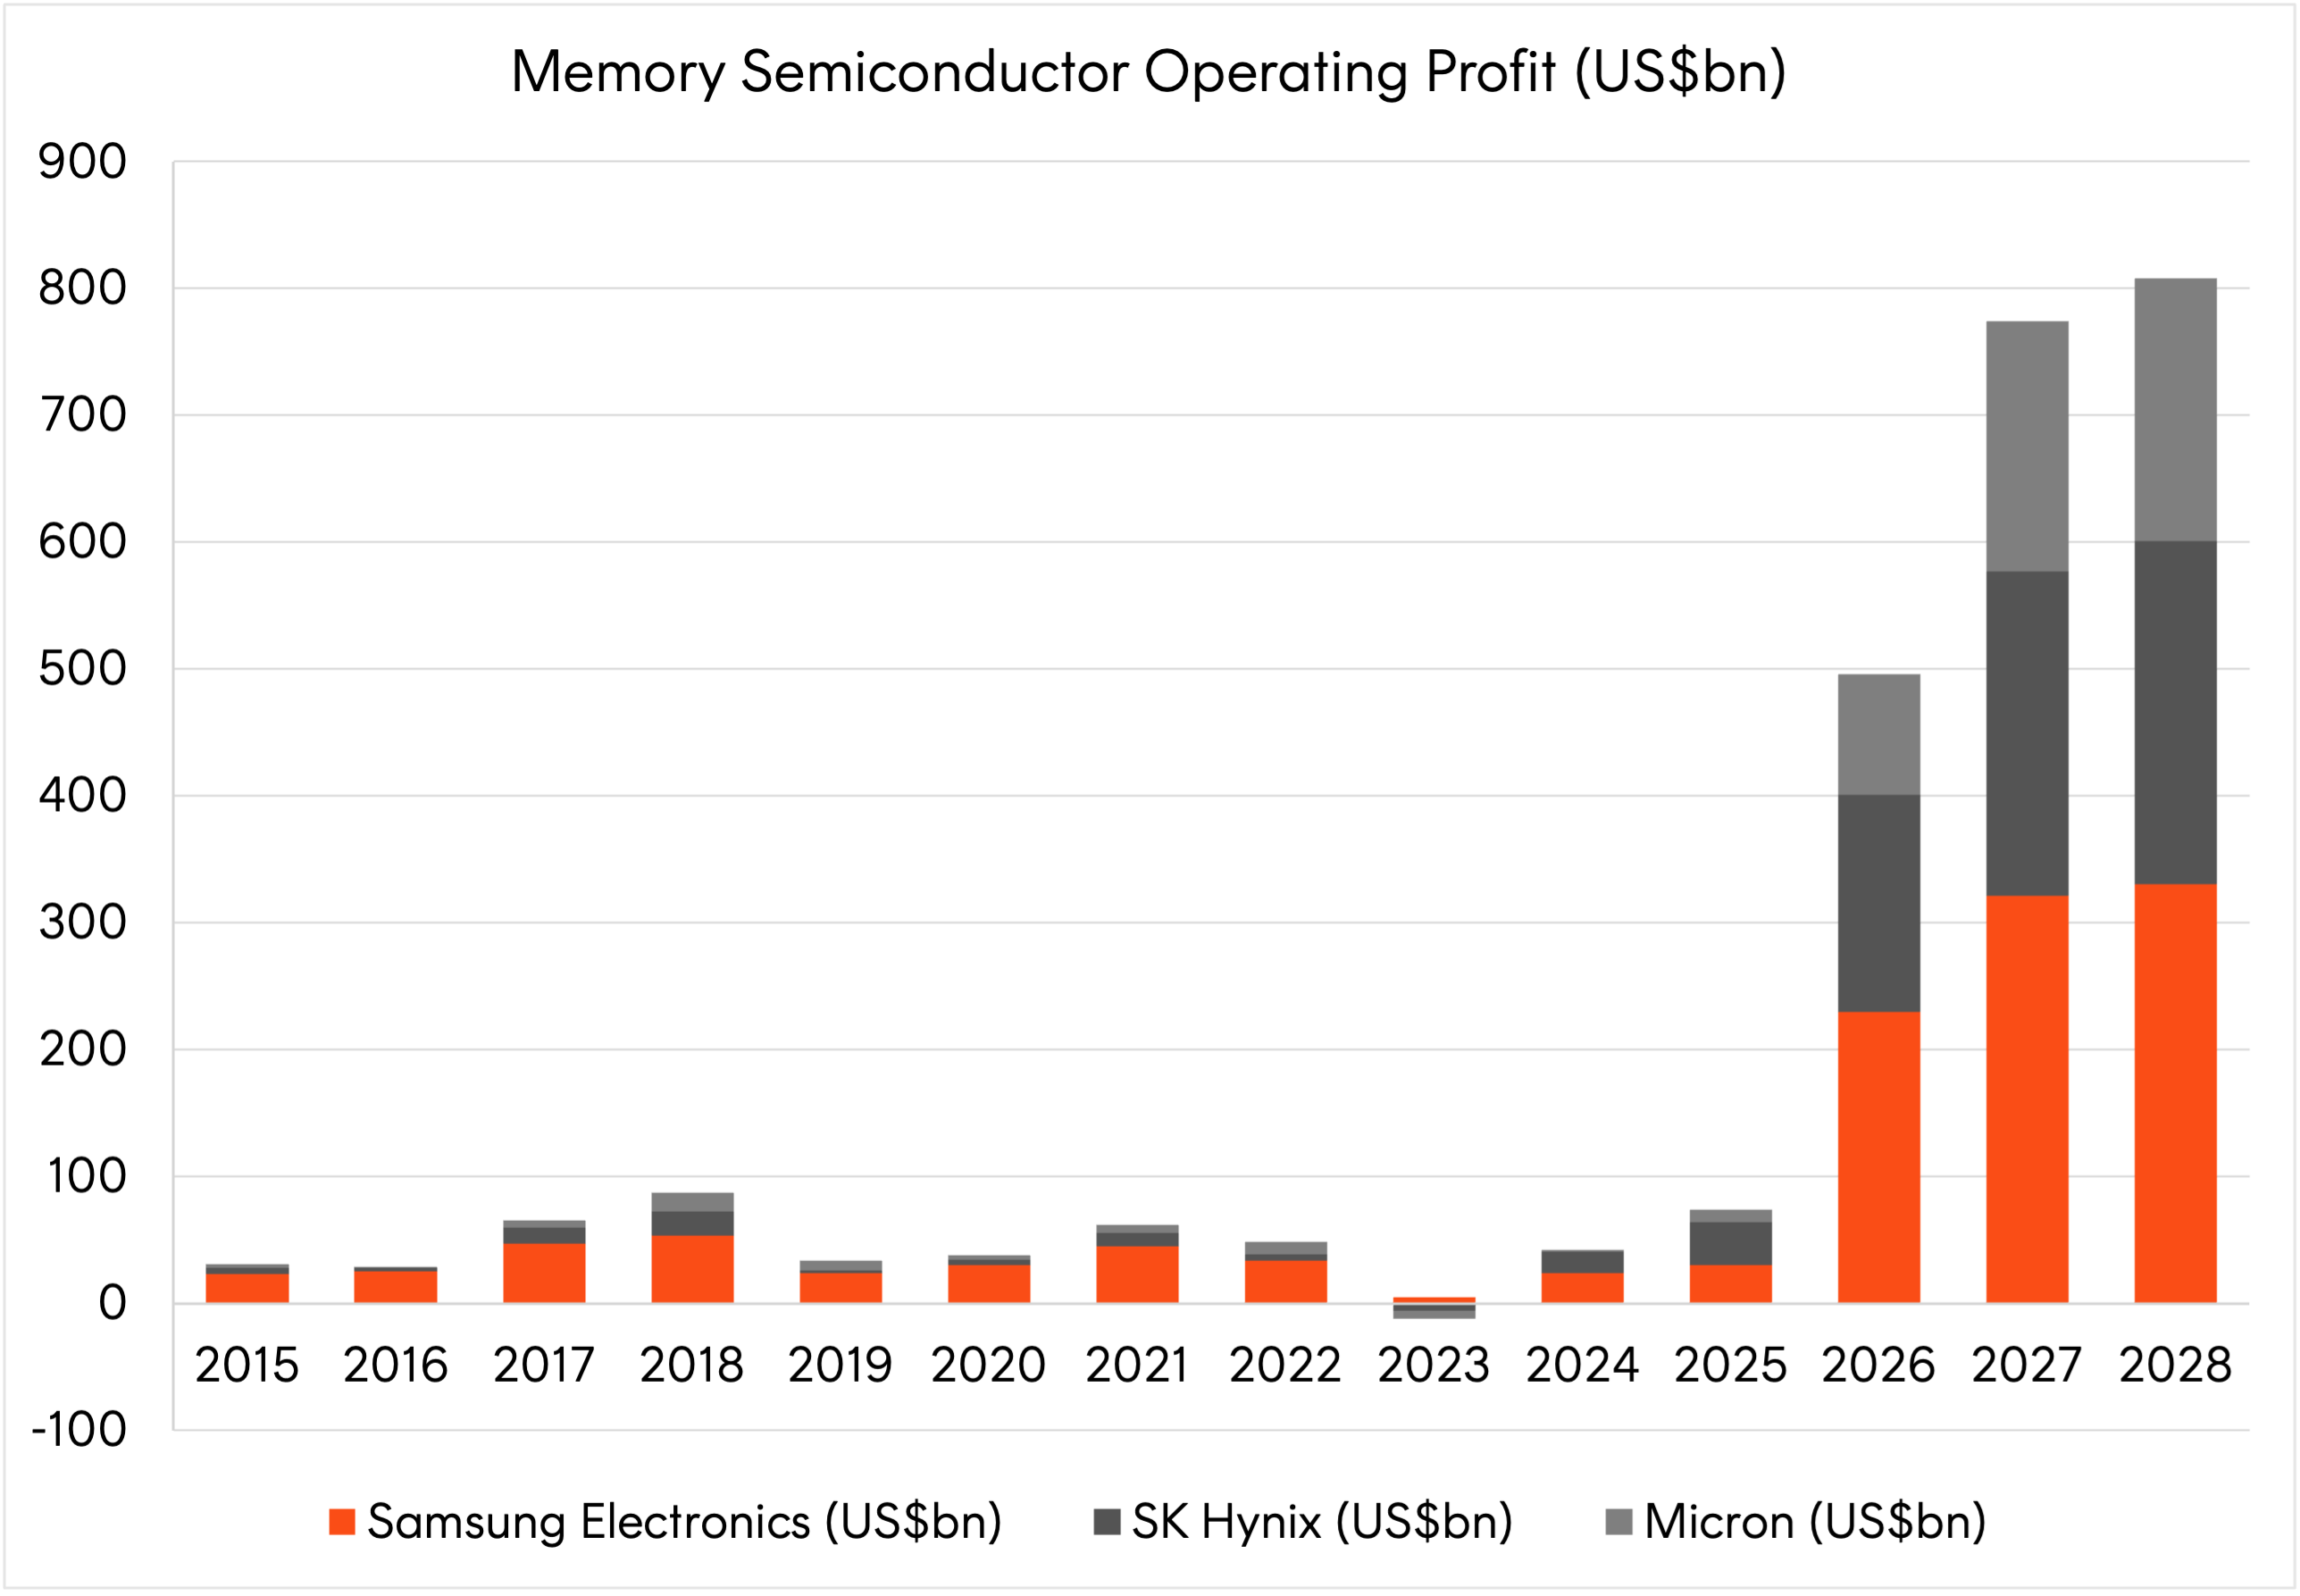
Source: Bloomberg. Operating income for Samsung Electronics, SK Hynix and Micron Technology converted to US dollars. Reported actuals to 2025; 2026 to 2028 are Bloomberg consensus estimates, by fiscal year. As at 26 June 2026.
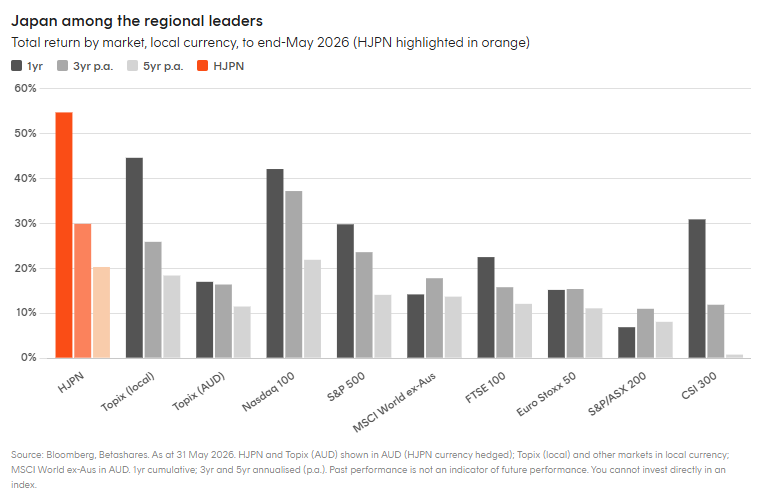
4: Japanese equities, the dark horse
Japan’s Nikkei 225 hit record highs in June even as other major indices wobbled.
The rally reflects two converging forces: structural corporate governance reforms that have seen more than 70% of Japan’s largest listed companies commit to lifting returns through record buybacks and rising dividends, and a once-in-a-generation positioning in AI supply chains, where Japan’s strength in semiconductors, robotics and precision manufacturing is meeting a wave of global capex.
Prime Minister Takaichi’s administration has reinforced the tailwind with record government investment in technology, defence and energy security, alongside a ¥3 trillion supplementary budget to cushion households from rising energy costs. With global portfolios still structurally underweight Japan, the re-rating may have further to run.
5: CGT reform’s silver lining for ETFs
The passage of the government’s CGT reform bill through the Senate in late June replaces the longstanding 50% CGT discount with indexation for assets held longer than 12 months.
While the intent is to only tax gains above inflation, the new regime penalises diversified share portfolios – as the chart below shows, 23 of the 50 largest ASX stocks would have faced worse outcomes under CGT indexation over the past five years, creating an additional 0.34% p.a. tax drag for a top-rate taxpayer. To see a simplified numerical example of the mechanics, please read this explainer.
Index ETFs, taxed as a single pooled asset, avoid this dispersion penalty entirely.
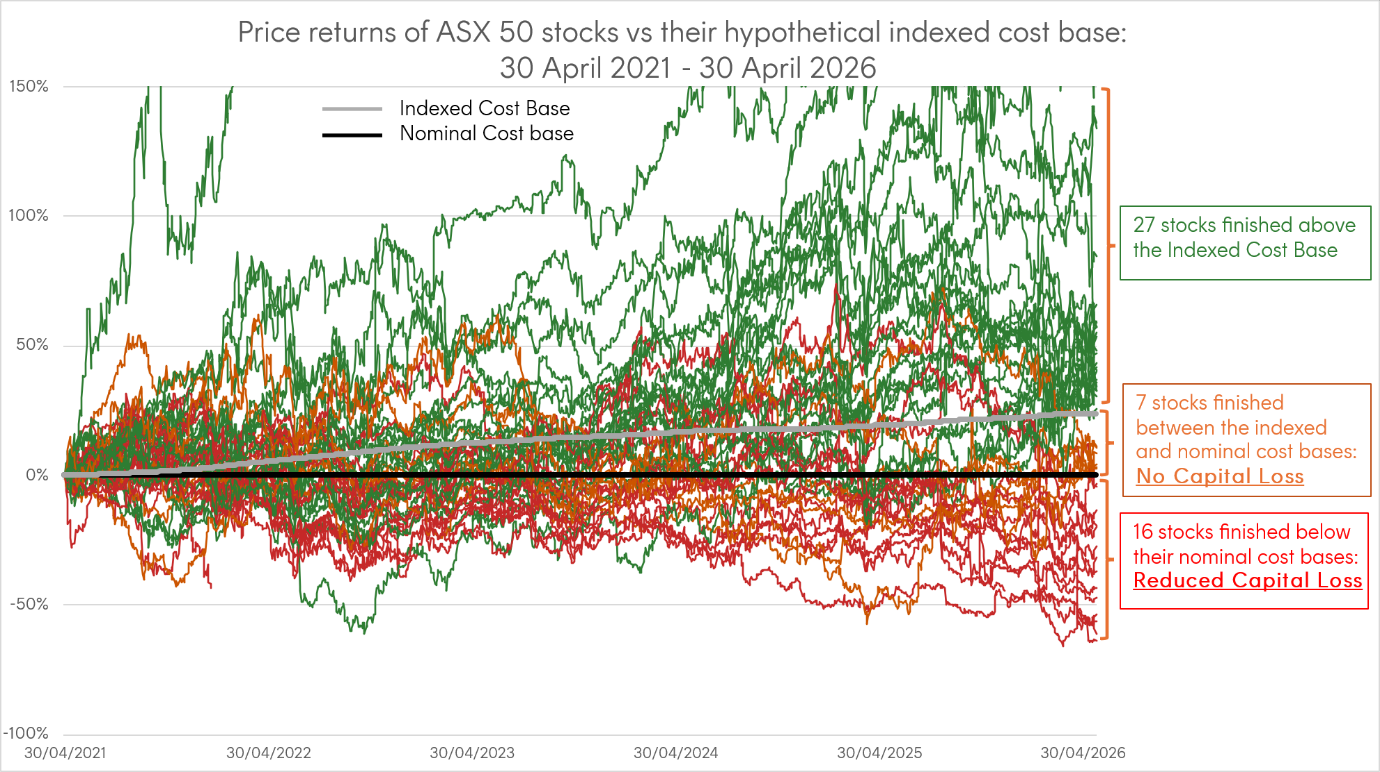
Sources: Bloomberg; ABS. The chart shows the stock price returns of the ASX 50 constituents in the index at the start date of 30 April 2021. Stock price returns exclude any dividends paid. Historical ASX 50 constituents shift over time. The indexed cost base reflects the cumulative total CPI over the 5 year period. Some stocks that gained more than 150% are not displayed in full on the chart due to scale, but are included in the totals shown. Past performance is not an indicator of future performance. You cannot invest directly in an index.