
Annabelle Dickson
15 minutes reading time
Despite high inflation, sharply rising interest rates, fears of a US recession, and a series of bank failures, equity markets generally managed to ‘climb a wall of worry’ in 2023. Most major global equity indices posted double-digit returns, while the Nasdaq 100 produced an incredible 54% rally. A reminder that markets can and will surprise you!
While economic and market conditions do appear more supportive than at this time last year, some risks and uncertainties remain. As such, taking a balanced approach might be a sensible strategy this year.
Please note any information provided is not a recommendation or offer to make any investment or to adopt any particular investment strategy. You should consider seeking financial advice before making an investment decision.
Building an ‘all-weather’ portfolio
Given the historical long-term outperformance of equities over cash and bonds, and the inherent uncertainty in markets, equities have been a staple of most portfolios for good reason. Taking an ‘all weather’ approach to constructing your investment portfolio means maintaining a reasonable exposure to equities, while aiming to invest in resilient businesses that could be well-placed to better weather any economic storms that may materialise. These three ETFs may be worth considering for such an allocation.
Profit is an opinion. Cash flow is more reliable.
Free cash flow (FCF) is the money generated by a company’s operations, after accounting for capital expenditure and working capital. Cash flows are more reliable and less biased than profits, which need to be interpreted through accounting principles and policies.
FCF can benefit a company in most market conditions. When the economy is strong, FCF can help to fund growth, allowing a company to expand operations, invest in efficiencies, or make acquisitions. In periods of distress, a company with FCF can service or pay down debts and doesn’t need to rely on markets for funding.
Academic research and evidence suggest the potential for outperformance by focusing on companies generating high levels of FCF, relative to companies generating low levels of FCF.
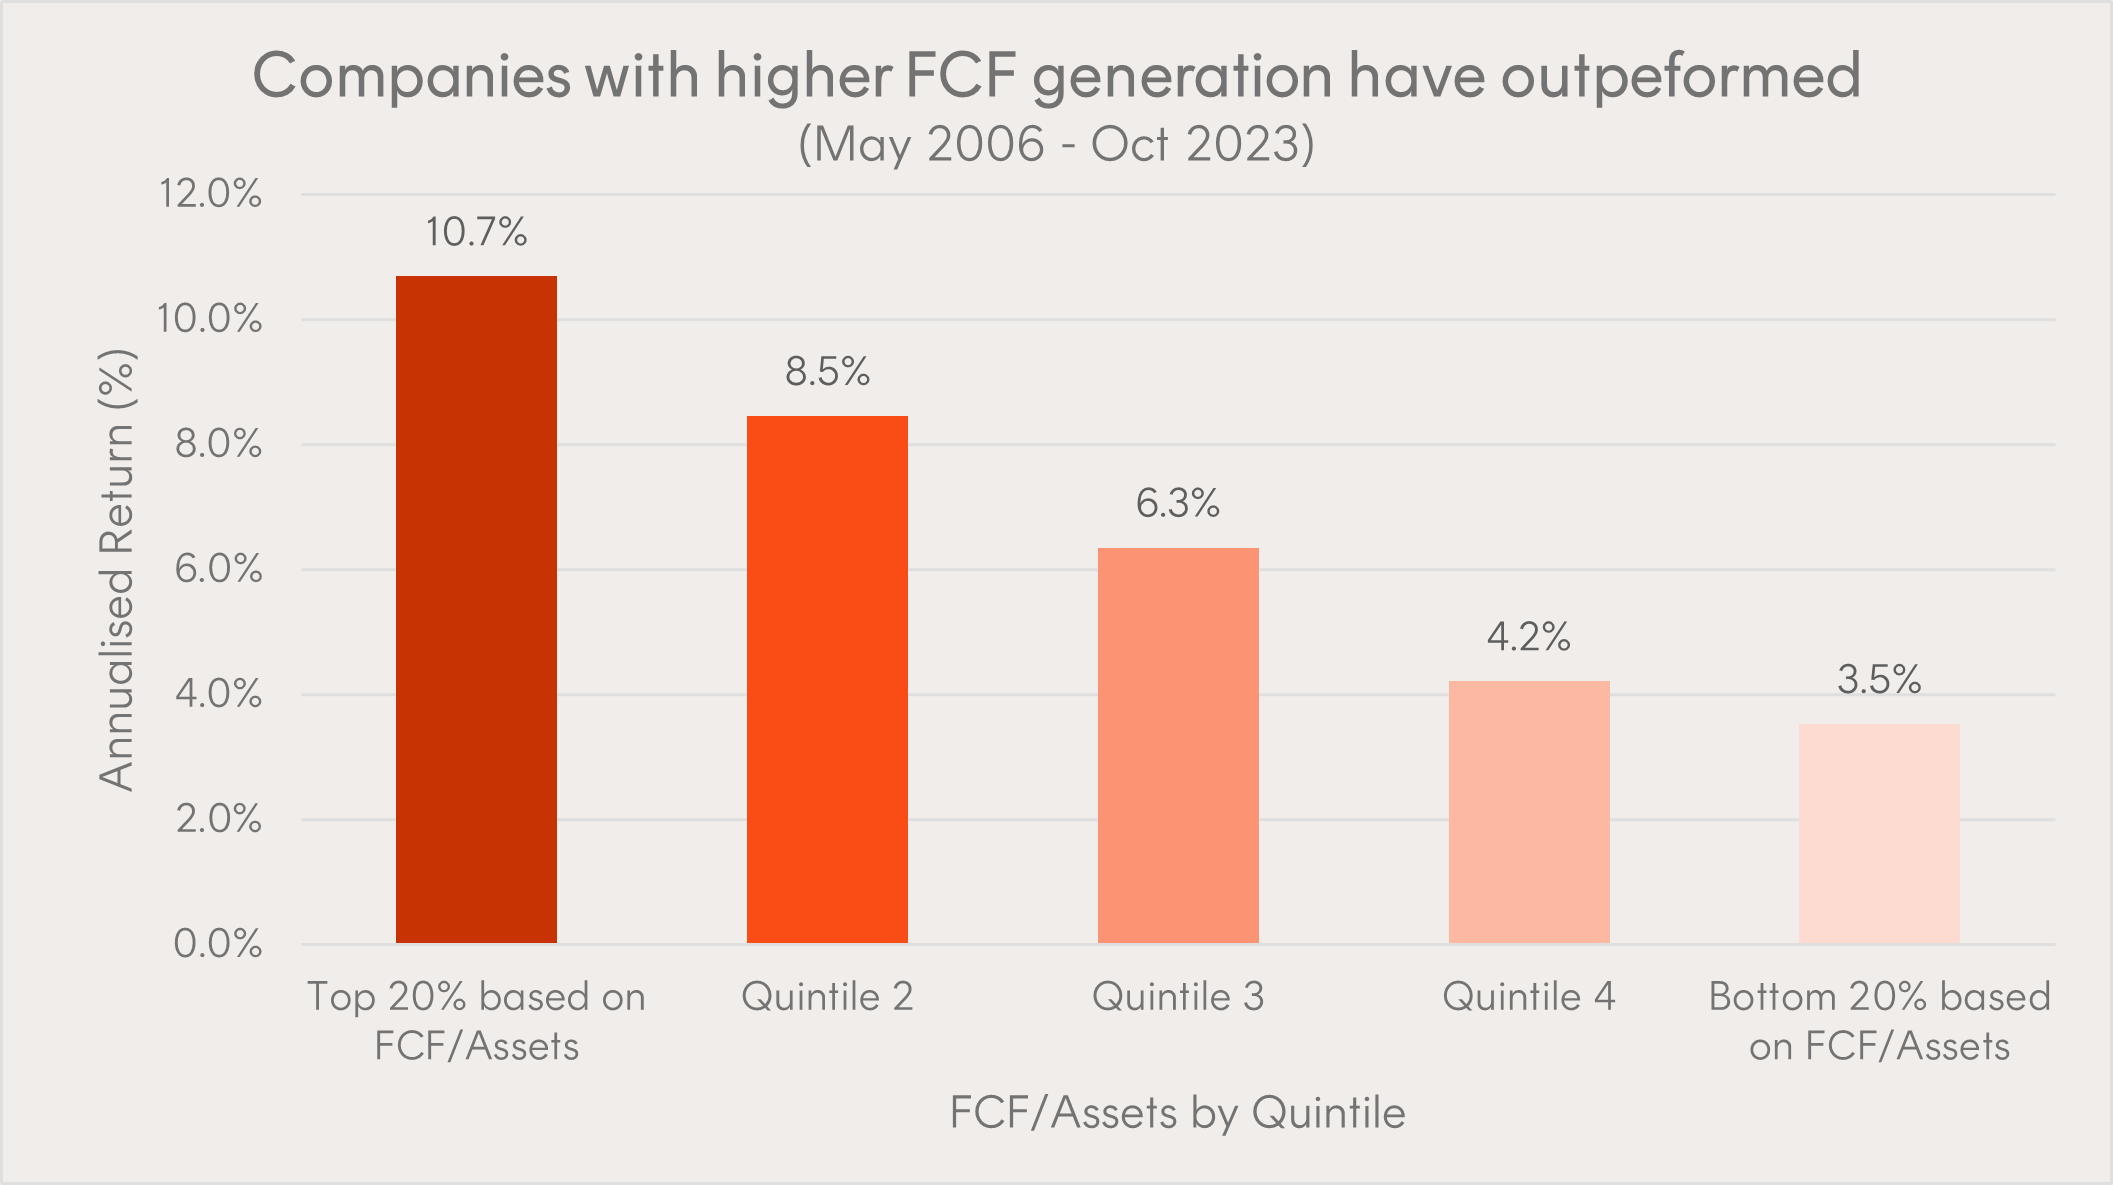
Source: Betashares, Solactive and Factset. The five equally weighted portfolios represent the Solactive GBS Developed Markets ex Australia Large & Mid Cap AUD Index constituents broken up into quintiles based on FCF generation, and rebalanced semi-annually. Data covers the period from May 2006 to October 2023. Financial companies are ranked by Net Operating Cash Flow / Assets, instead of FCF / Assets. You cannot invest directly in an Index. Past performance is not an indicator of future performance.
CFLO Global Cash Flow Kings ETF invests in a portfolio of global companies with strong free cash flow. CFLO can be used as a core exposure to global equities, or alongside existing low-cost passive global ETF to improve the overall fundamentals.
There’s no substitute for quality
Quality companies are those with high returns on equity, low leverage, and relatively stable earnings. In Australia, this has tended to result in a higher exposure to technology and consumer companies, and a lower exposure to mining companies. Not only do these attributes favour businesses that can grow steadily while remaining resilient, but it can provide diversification benefits for Australian investors who have large exposures to mining companies or limited exposures to technology.
A portfolio of quality companies has the potential to produce long-term performance superior to that of the relevant broad share market benchmarks. AQLT Australian Quality ETF is Australia’s only passive quality ETF. It can be used to replace or complement active Australian equity funds, or as a core exposure to Australian equities.
Can the Nasdaq’s performance continue in 2024?
Today’s Nasdaq 100 companies make up a substantial portion of the US stock market and represent a more globalised, digitised, and innovation-driven economy.
The Nasdaq 100 Index rose by 50.75% in 2023 and averaged over 20.76% p.a. over the last 10 years1. That’s more than double the 9.94% p.a. that the S&P 500 Index has returned over the same period2. But is this just hype, or is there a reason for this performance?
As a percentage of sales, companies in the Nasdaq 100 Index spent 7 times as much on research and development, compared to those in the S&P 500 (excluding Nasdaq 100 companies) (as of 30 June 2023).
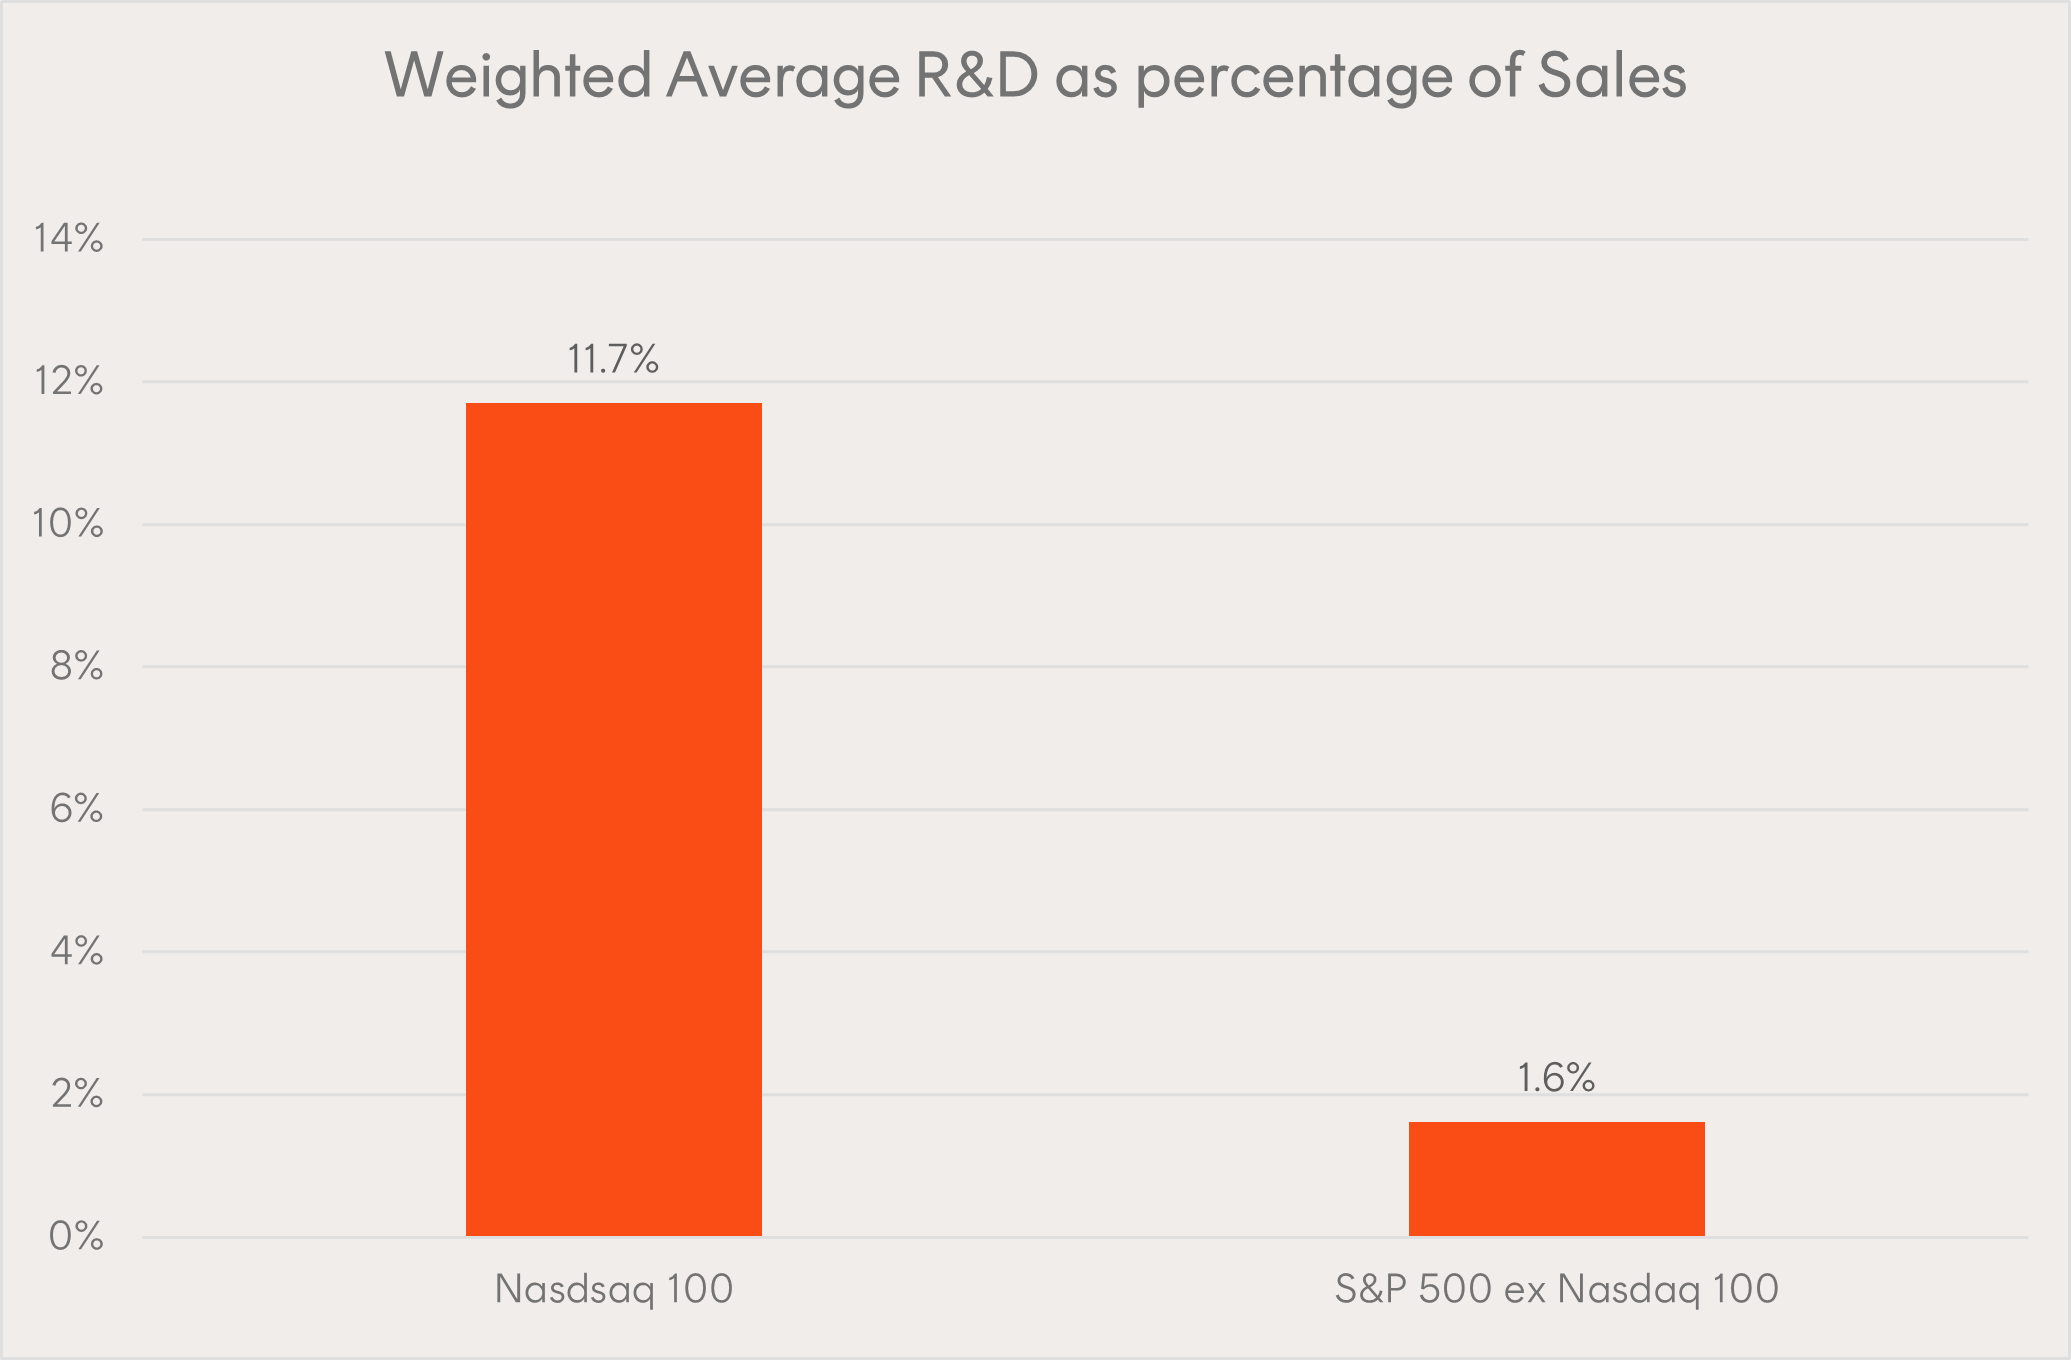
Source: Nasdaq Global Indexes, FactSet. Data as of 30 June 2023. Shows data for Nasdaq-100 companies and S&P 500 excluding Nasdaq-100 companies. S&P 500 weighted average R&D inclusive of Nasdaq-100 companies as a percentage of sales is 8.1%.
Research and development is a key driver of innovation and growth, so perhaps unsurprisingly, companies in the Nasdaq 100 Index have demonstrated strong historical earnings growth, well in excess of the broader S&P 500 Index.
Annualised growth:
- Nasdaq 100: 19.7% p.a.
- S&P 500: 9.5% p.a.
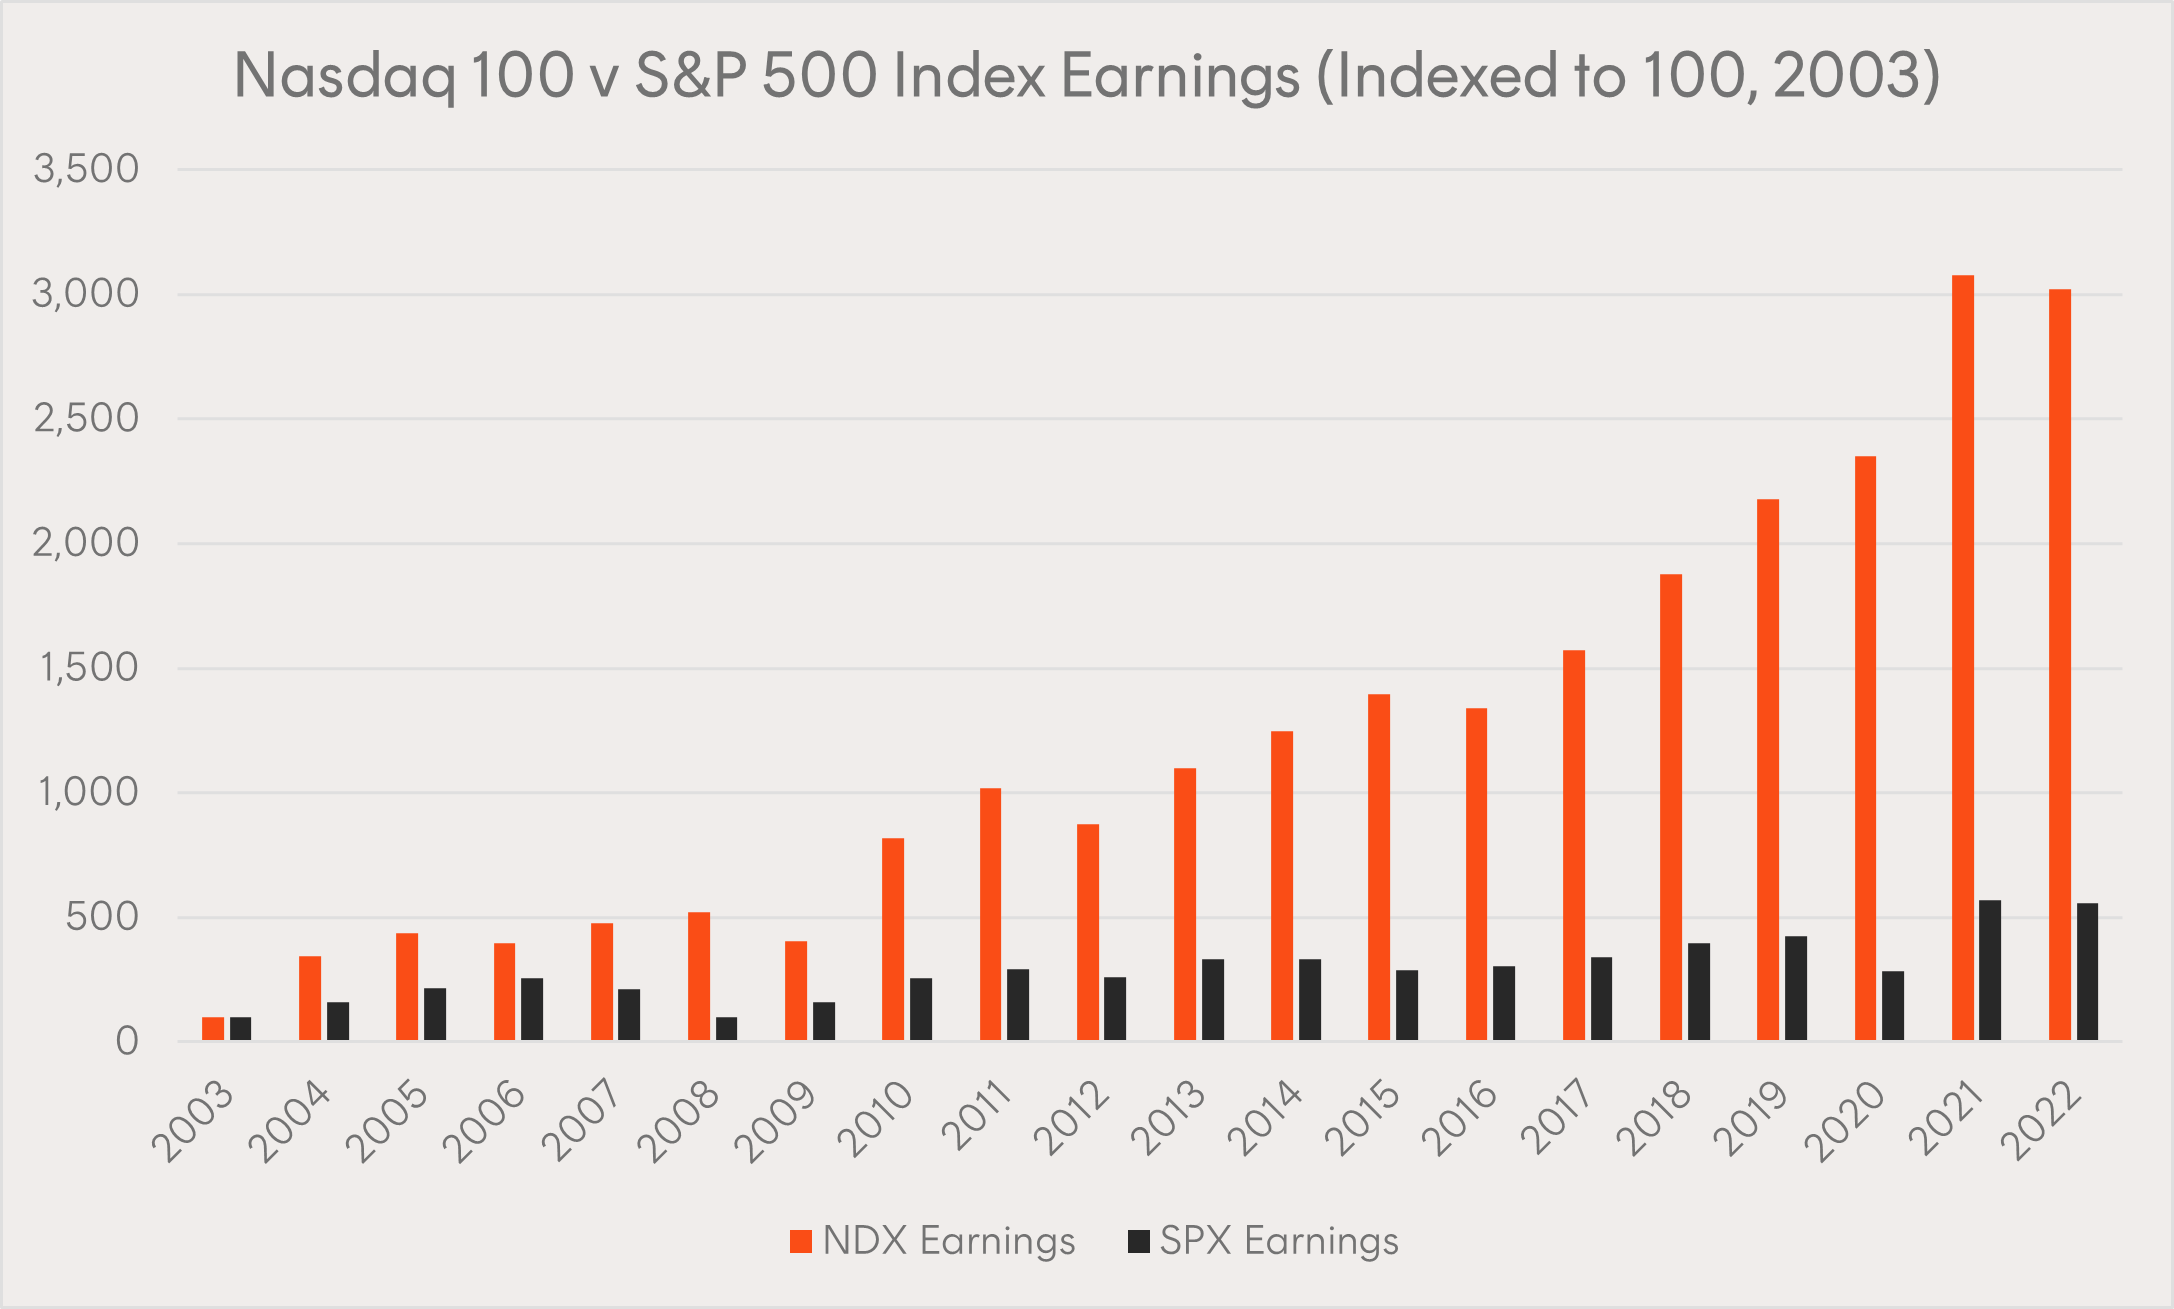
Source: Nasdaq, Betashares. Past performance is not an indicator of future performance of any index or ETF. You cannot invest directly in an index.
This strong fundamental growth is expected to continue for companies in the Nasdaq 100, with analysts forecasting sales growth of 11% p.a. between 2023 and 2025, compared to 5% for the S&P 5003.
NDQ Nasdaq 100 ETF is the only ETF traded on the ASX offering exposure to the Nasdaq 100 Index.
Build a sustainable income stream
More than one in three ETF investors are prioritising income as their number one investment objective in 2024, according to recent research from Betashares and Investment Trends4. ETFs offer a wide range of options for investors seeking income. From equity strategies that aim to maximise income – on both Australian and international shares – to ‘smart beta’ strategies that seek to produce high income as one of their investment objectives, and fixed income strategies that can produce attractive returns in various market conditions. All available to buy or sell in a single trade on an Australian exchange.
Equity income
While equities are generally thought of as a growth allocation, some can also produce an attractive income stream. Australian equity investors looking for income often turn to local equities. The Australian market, as a whole, historically has paid dividends at a higher rate than many other developed markets, and franking credits can make these dividends particularly attractive on an after-tax basis.
Maximise your yield
Betashares’ range of Yield Maximiser funds use a ‘covered call’ strategy to offer additional income over and above dividends generated by the portfolio.
This video explains the concept:
This strategy is best suited to sideways trading markets, as we’ve seen in Australia in recent years. These conditions allow investors to benefit from the option premiums, dividends, and franking credits, without losing too much upside. Covered call strategies may also help to reduce portfolio volatility – an important consideration for investors relying on their investments for income.
Betashares offers three ETFs that utilise covered call strategies:
- YMAX Australian Top 20 Equities Yield Maximiser Complex ETF aims to generate attractive quarterly income and reduce the volatility of portfolio returns by implementing an equity income investment strategy over a portfolio of the 20 largest blue-chip shares listed on the ASX.
- QMAX Nasdaq 100 Yield Maximiser Complex ETF aims to provide regular income along with exposure to a portfolio of the top 100 companies listed on the Nasdaq stock market. In addition, the Fund aims to provide lower overall volatility than the underlying Nasdaq-100 Index.
- UMAX S&P 500 Yield Maximiser Complex ETF aims to generate attractive quarterly income and reduce the volatility of portfolio returns by implementing an equity income investment strategy over a portfolio of stocks comprising the S&P 500 Index.
These ETFs do not aim to track an index.
Squeeze more out of Australian shares
Traditional equity indices, such as the S&P/ASX 200, are weighted by market capitalisation. Market capitalisation refers to the market value of the company’s shares – the share price multiplied by the number of shares on issue. Essentially, the most valuable companies receive the largest weight in the index. This can be a simple and effective approach, but it is subject to the whims of the market’s mood.
QOZ FTSE RAFI Australia 200 ETF takes a different approach. Rather than weighting by market capitalisation, QOZ is weighted in a way that reflects the economic importance of its constituents. This includes accounting measures such as sales, cash flow, dividends and book value. This approach is less affected by fads and bubbles, offers the potential for outperformance, and historically has delivered a high level of franked distributions. In the 12 months ending 31 December 2023, QOZ had a distribution yield of 5.3%, or 6.9% when grossed up for franking credits – the distributions were 73.5% franked (total franking level)5.
Fixed income
Fixed income has traditionally been viewed as the go-to asset class for income and defence. But in the years following the Global Financial Crisis, very low interest rates saw it fall out of favour with many income investors. That all changed in 2023 though, as higher rates on cash drove yields up across the asset class. As we move into 2024, fixed income could once again offer both income and defensive attributes.
A strong core for your fixed income allocation
Fixed income is a huge asset class – even larger than equities – with a wide range of different securities, strategies, and exposures available. All this choice can be intimidating at first glance, but there’s no need to make it complicated.
OZBD Australian Composite Bond ETF is designed to be a core portfolio allocation for Australian fixed income. It invests in a diversified portfolio of high-quality Australian government and corporate fixed rate bonds. OZBD focuses on bonds with high income potential, offering a yield to maturity of 4.74% p.a. (as at 10 January 2024)6.
Markets are currently pricing in two rate cuts from the RBA in 20247. If these do materialise, it may be beneficial for fixed rate bonds, as prices and yields move in opposite directions.
Take the institutional approach to cash investing
When most people think of cash, the first things that comes to mind are term deposits and at-call deposits with the bank. But cash is actually a much broader asset class than this, as institutional investors are well aware.
In addition to term deposits and at-call deposits, cash can include a range of money market securities. These usually have low credit risk, are not highly sensitive to interest rate moves, and mature within 12 months. All this results in a high level of capital stability and a low risk of capital loss.
Securities like these traditionally have been inaccessible to retail investors, due to the high minimum investments and expertise required. MMKT Australian Cash Plus Active ETF aims to provide enhanced returns on cash by enabling retail investors to access these money market securities.
The green energy transition – a $50 trillion opportunity
If the world is to limit global average temperature rises to 1.5°C, US$5 trillion per year for a cumulative US$150 trillion of investment will be required by 2050, according to the International Renewable Energy Agency8. According to estimates from the International Energy Agency, global investment in renewable energy reached a new high of US$1.74 trillion in 2023 and exceeded investments in fossil fuels for the eighth year running9. While this is encouraging, it’s still a long way short of US$5 trillion.
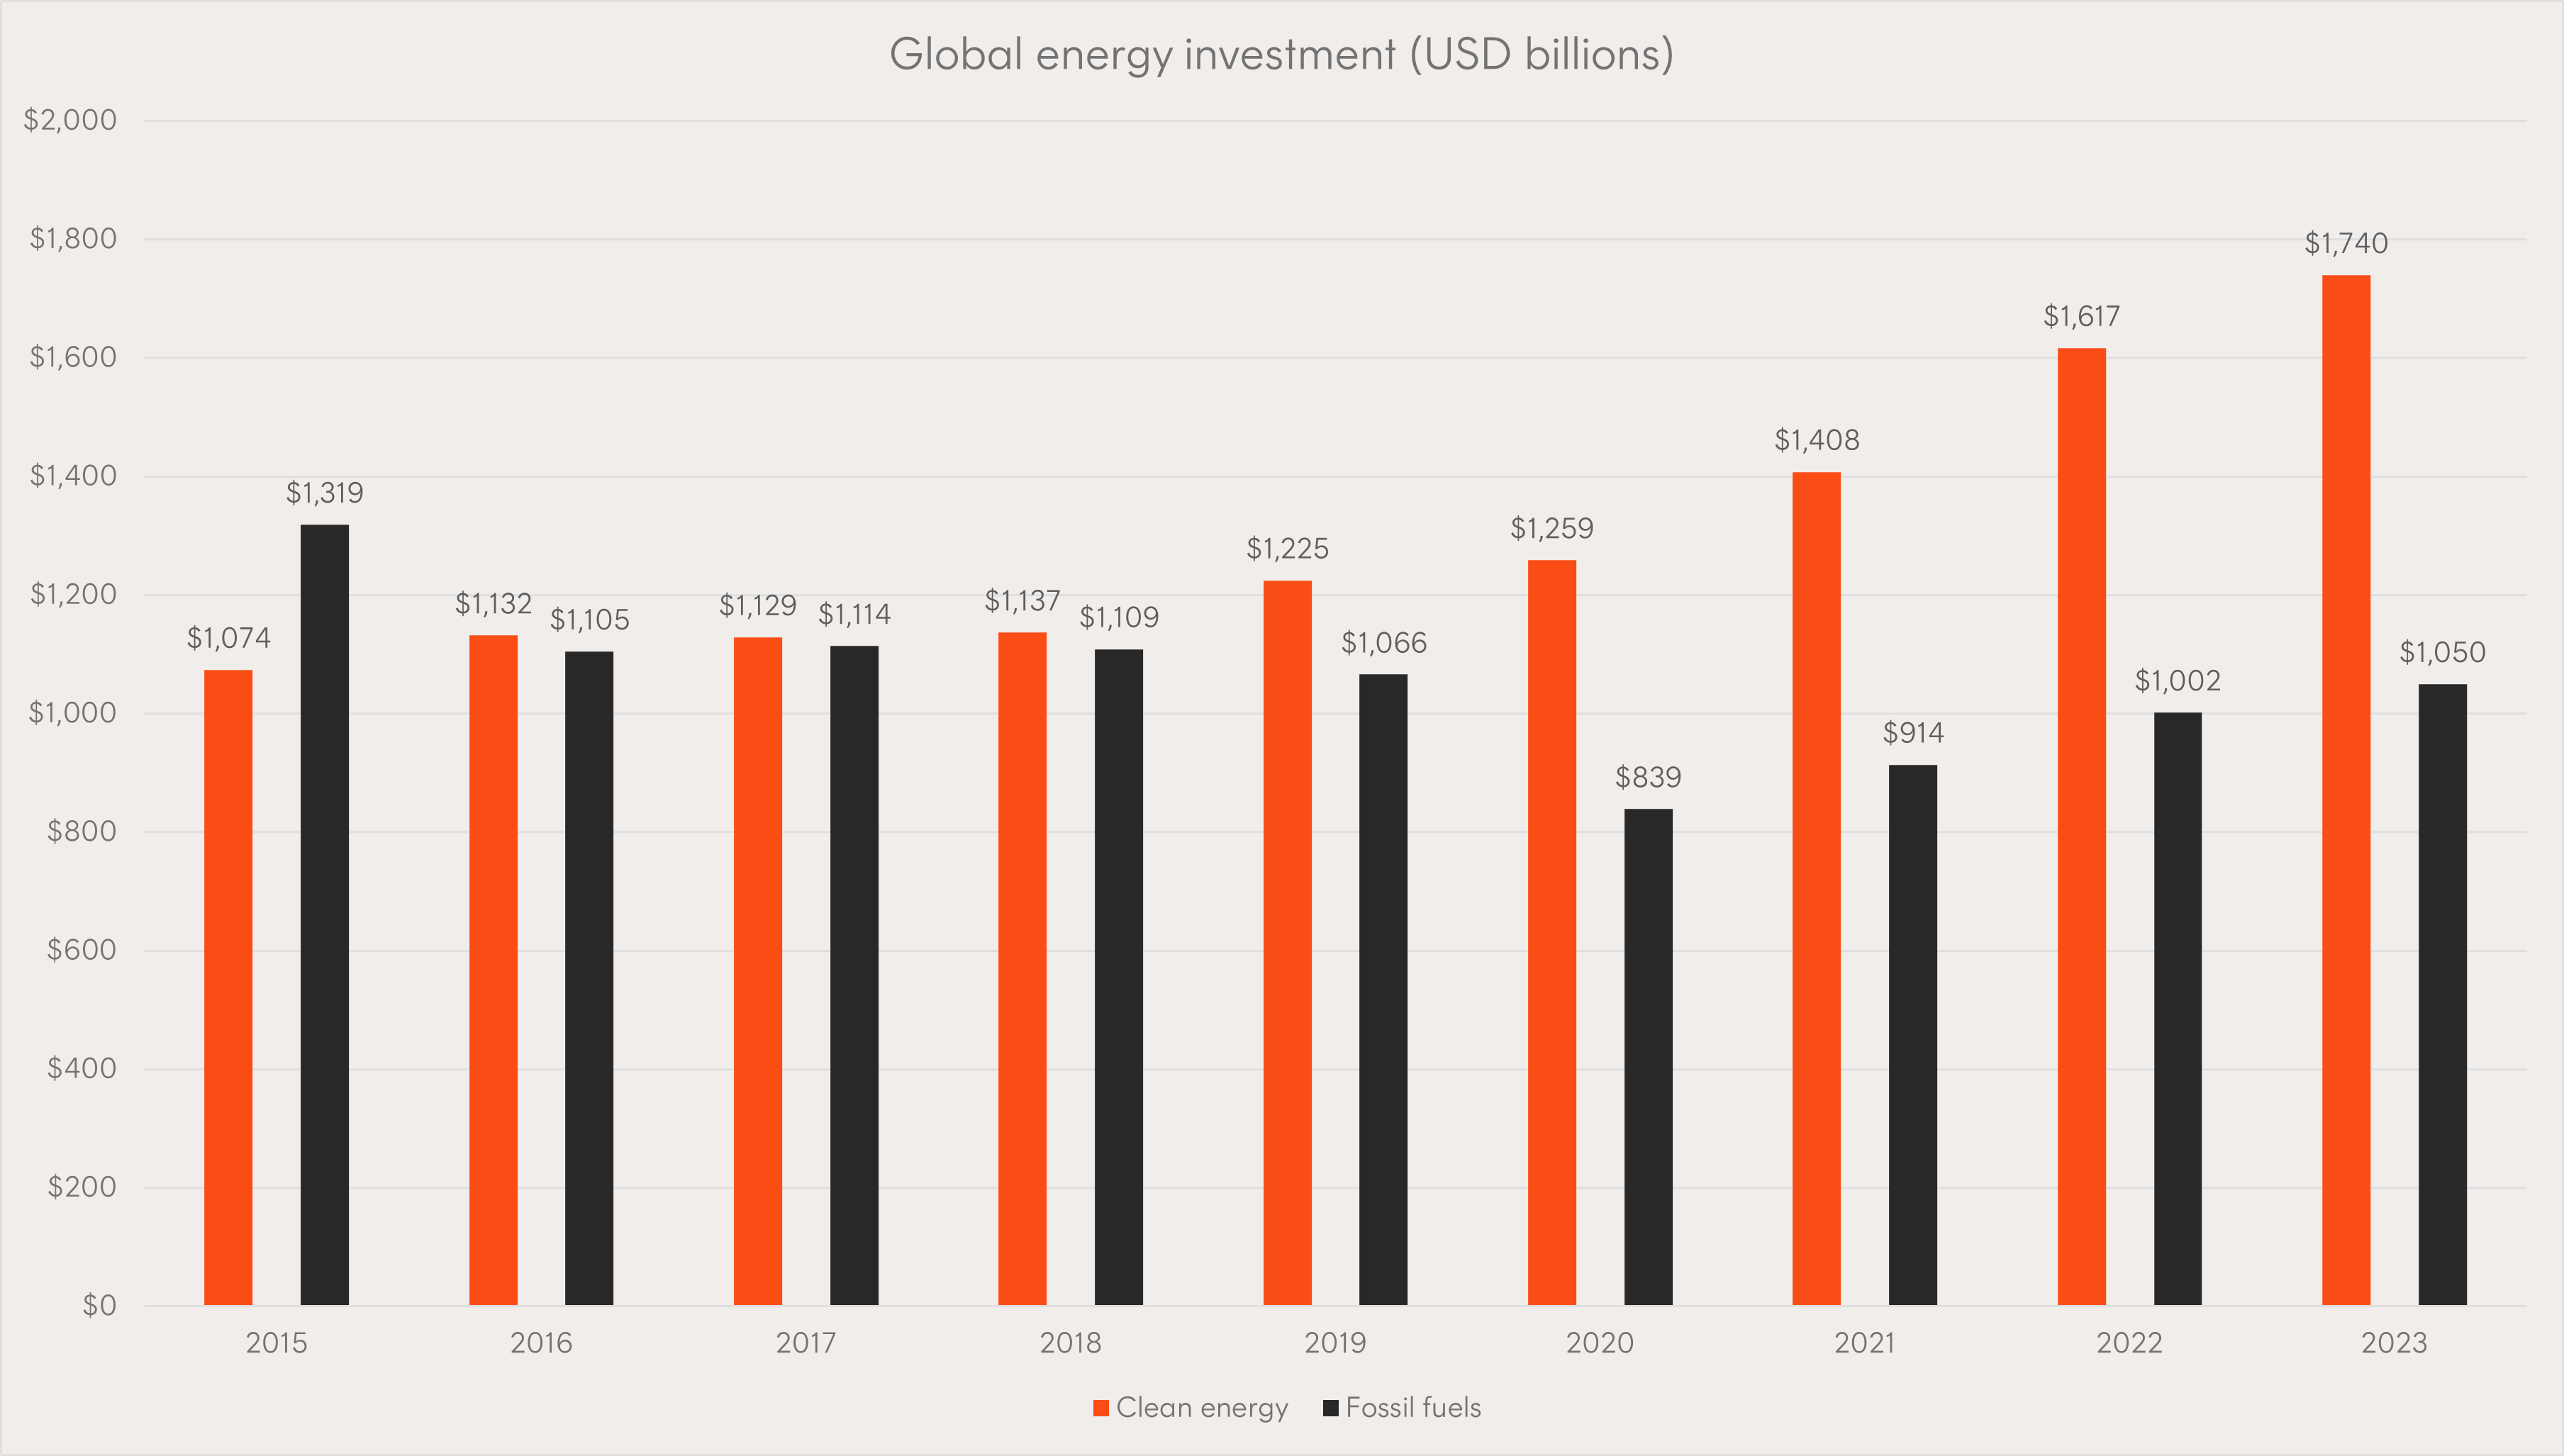
Source: IEA.
According to Goldman Sachs Research, clean tech has “turned a corner”, with declining battery costs and economies of scale in electric vehicles making electrified transport and storage more attractive to consumers and investment10.
Most industries will require a major overhaul in order to reach the required targets. And changes of this scale need investment, which investors can participate in through ETFs.
Closing the supply gap
Globally, nuclear power is currently the second largest source of CO2-free electricity, and the fourth largest source of electricity overall11.
According to the IEA, more than 45 new reactors with a capacity of 48 GWe (gigawatts electric) are scheduled to come online by 202712. To put that in perspective, there are currently 437 operating nuclear plants globally with a capacity of 393 GWe13 – that’s new capacity equal to around 10% and 12% of current capacity respectively.
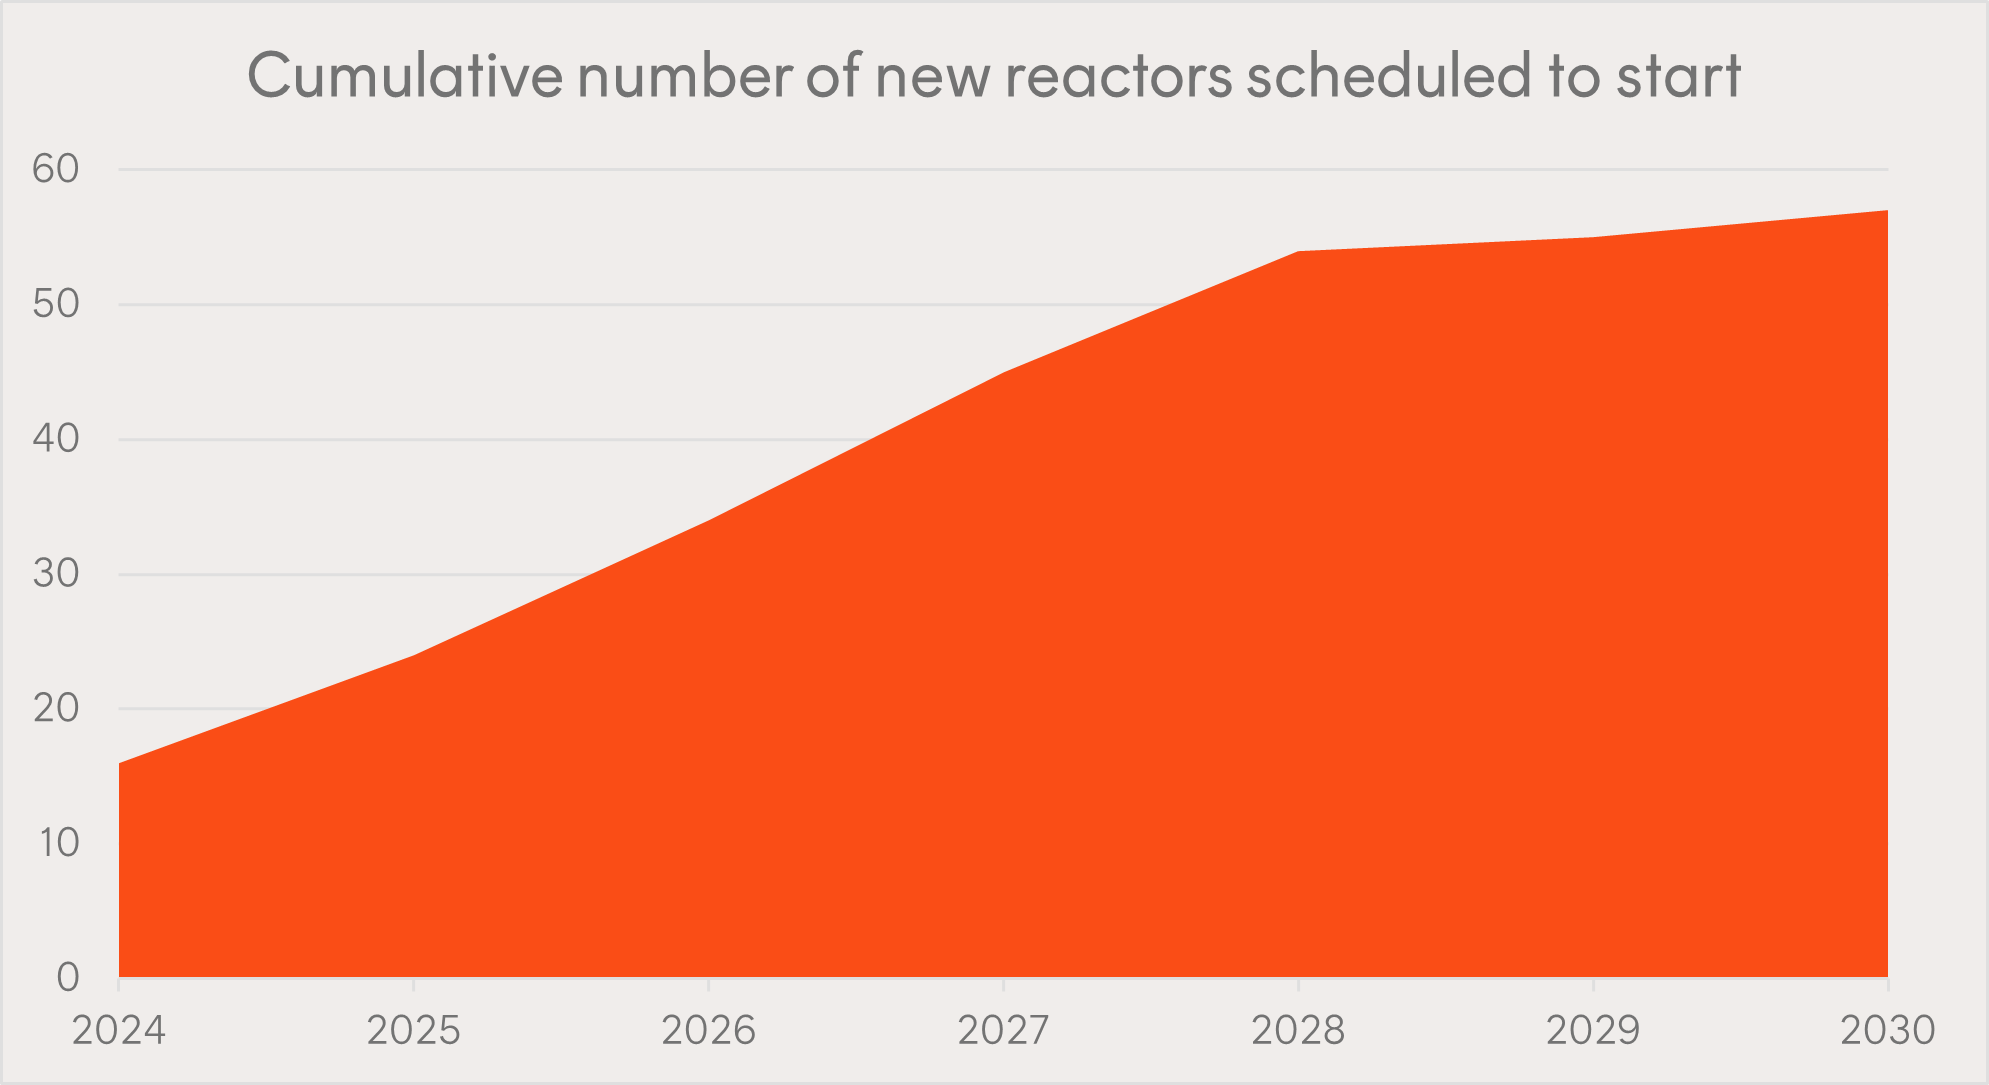 Source: IAEA.
In 2022, uranium production from mines totalled 58,201 tonnes of uranium oxide (U3O8), which accounted for just 74% of global demand14.
In short, there is currently a shortfall between mined supply and reactor demand. Both mines and new plants are expected to come online in between now and 2027. But assuming all production and generation comes online as scheduled, a shortfall in mined supply is still projected out to at least 202715.
URNM Global Uranium ETF provides exposure to leading global companies involved in the mining, exploration, development and production of uranium, modern nuclear energy, or that hold physical uranium or uranium royalties.
The metals powering the clean energy transition
The Earth is blessed with all the minerals we need to power the transition to CO2-free energy. However, defining, extracting, and processing all those deposits is going to require significant new investment. Unfortunately, over the last decade, there’s been insufficient investment in exploration and production. The Energy Transitions Commission (ETC) has estimated that investment in key energy transition metals needs to increase by more than 50%, from US$45 billion p.a. to US$70 billion p.a. through to 203016.
“On some key minerals – particularly lithium and copper – it will be challenging to scale up supply fast enough over the next decade to keep pace with rapidly rising demand,” said Adair Turner, Chair of the ETC.
Both electric cars and clean energy use notably more metals than their conventional counterparts, and many of these minerals have highly concentrated and insecure supply chains.
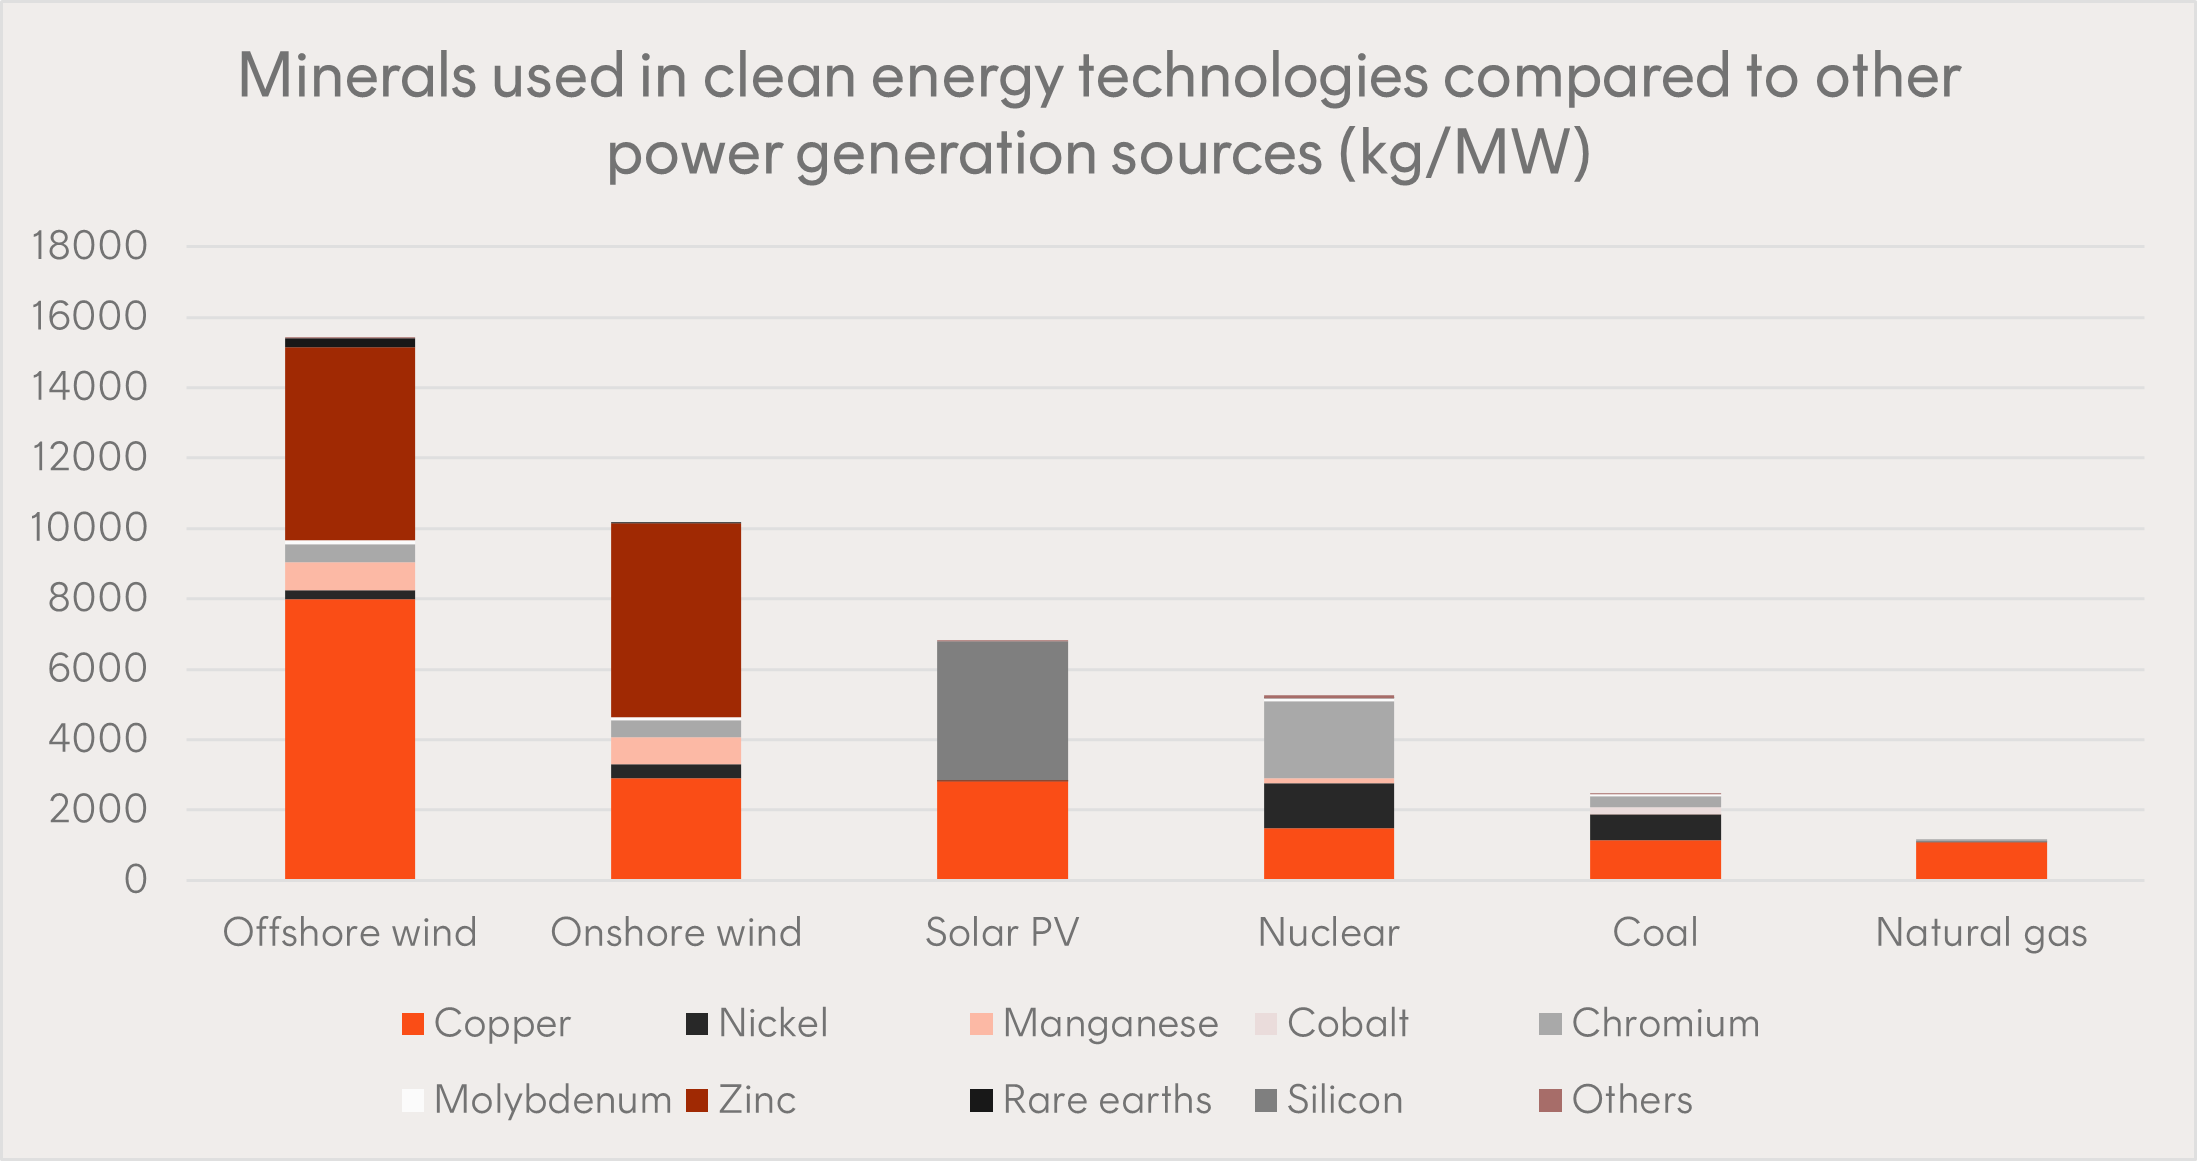 Source: IEA
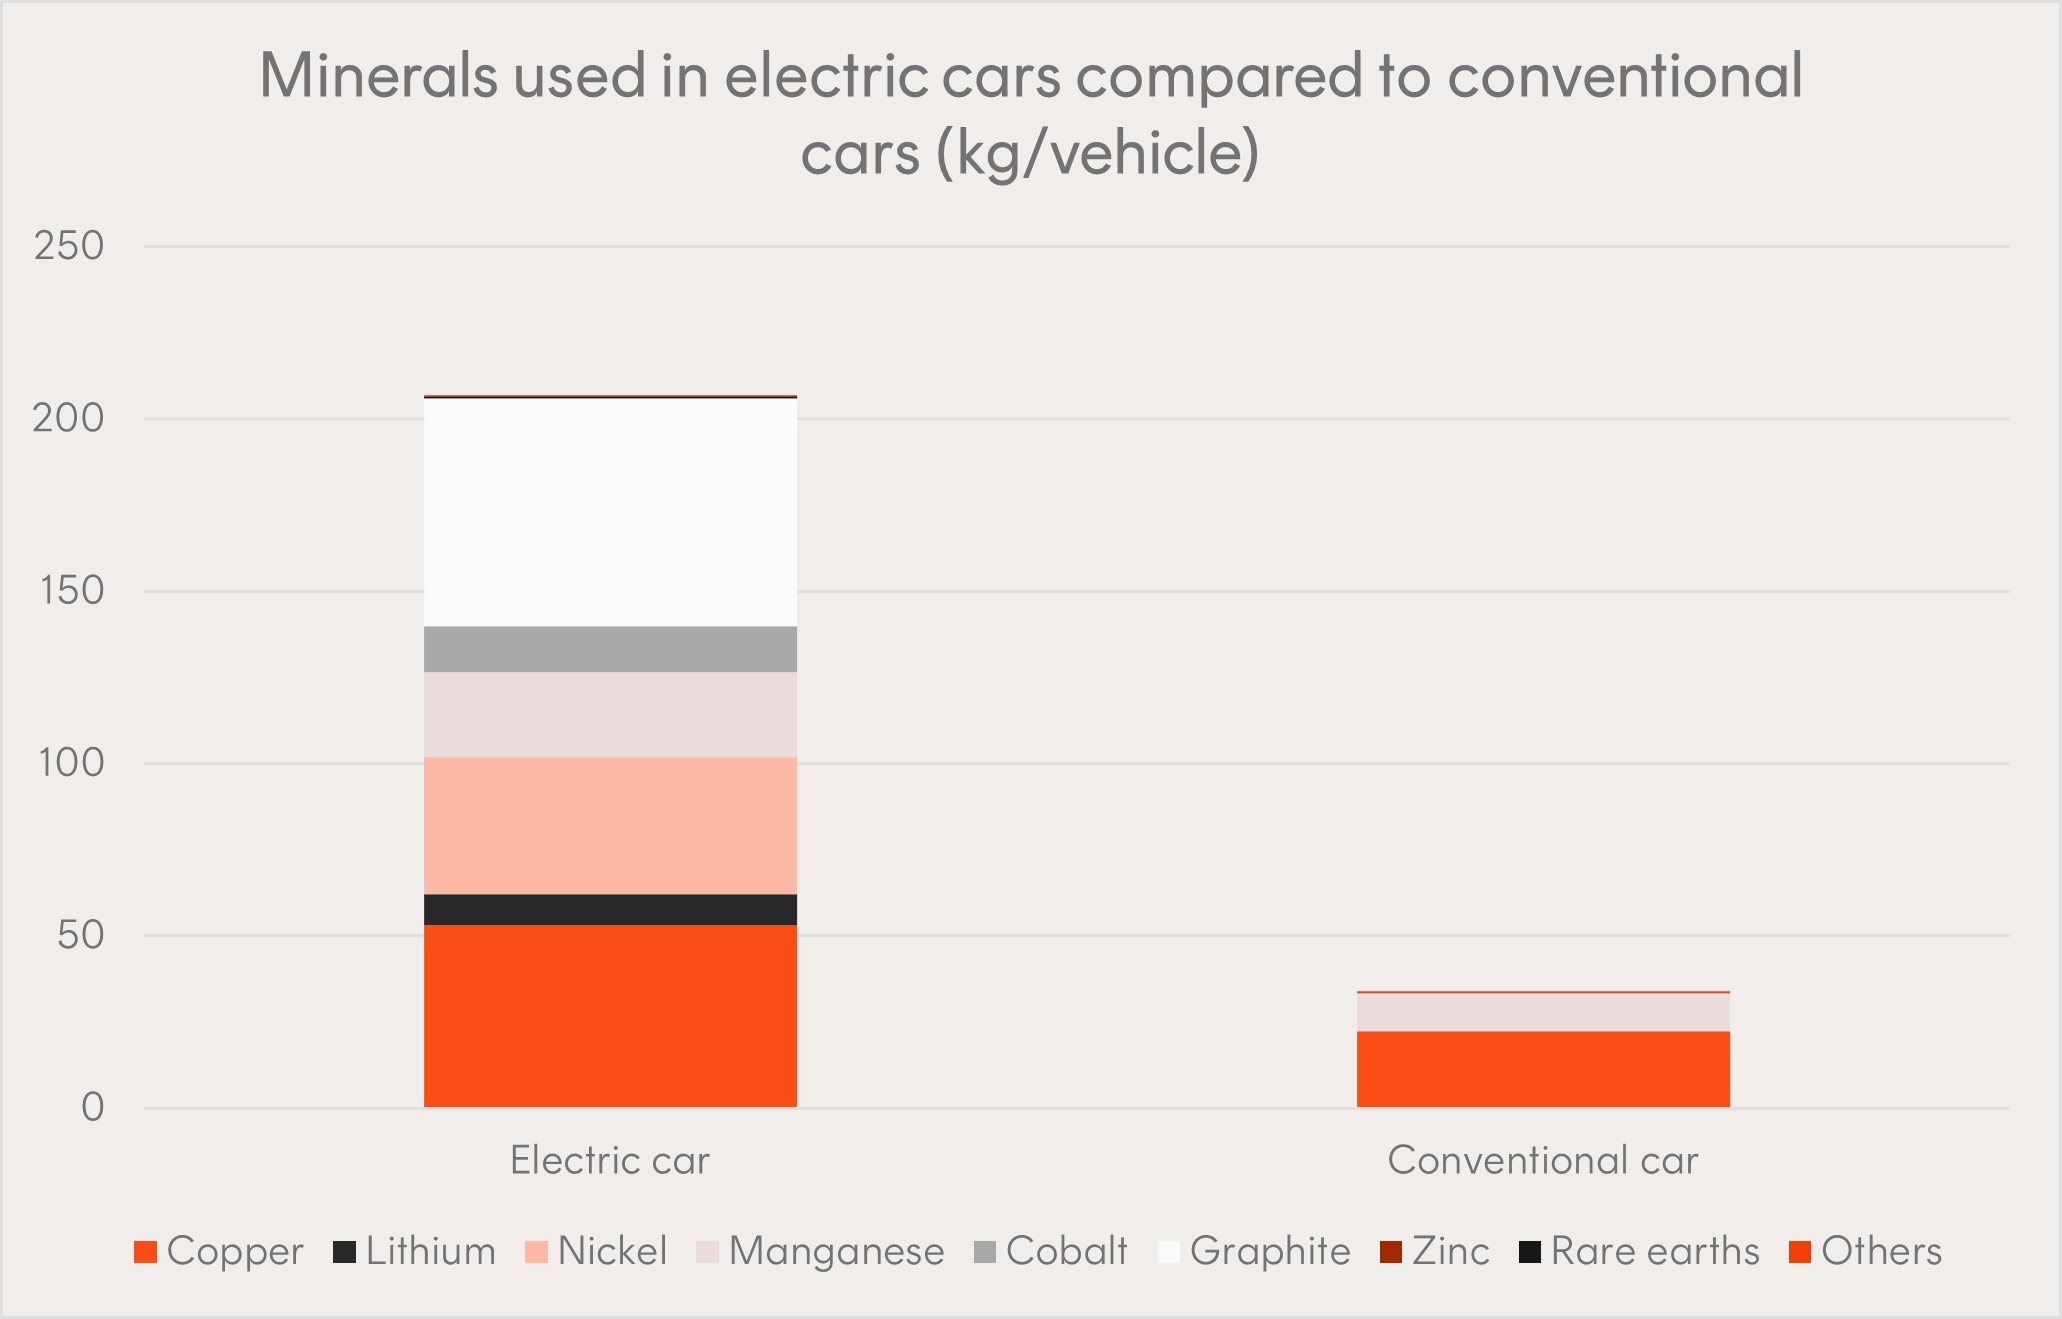 Source: IEA
XMET Energy Transition Metals ETF invests in a portfolio of global companies in the Energy Transition Metals industry. XMET provides exposure to global producers of copper, lithium, nickel, cobalt, graphite, manganese, silver and rare earth elements.
The companies leading the climate transition
Reaching zero CO2 emissions will require more than just digging up minerals. We’ll also need to build wind turbines, solar panels, electric vehicles, storage, and much more. There are five climate innovation pathways we need to consider:
- Green energy: Renewable energy assets, developers, equipment, and utilities.
- Green transportation: Electric cars, trucks, bikes, public transportation, and efficiency.
- Sustainable products: Food, materials and processes, buildings, and forestry.
- Enabling solutions: Fuel cells, alternative fuels, batteries, electric system, energy storage, semiconductors.
- Water and waste improvement: Pollution control, recycling, waste management, and efficiency.
ERTH Climate Change Innovation ETF invests in a portfolio of up to 100 leading global companies that derive at least 50% of their revenues from products and services that help to address climate change and other environmental problems through the reduction or avoidance of CO2 emissions. ERTH provides exposure to a broad range of solutions, including clean energy, electric vehicles, energy efficiency technologies, sustainable food, water efficiency and pollution control. Companies with direct involvement in the fossil fuels industry (coal, oil and natural gas), and certain other negative activities are excluded.
Funds covered in this article
Building an ‘all weather’ portfolio
- Betashares Global Cash Flow Kings ETF (CFLO)
- Betashares Australian Quality ETF (AQLT)
- Betashares NASDAQ-100 ETF (NDQ)
Sustainable income
Equity income
- Betashares Equity Yield Maximiser Fund (managed fund) (ASX: YMAX)
- Betashares NASDAQ 100 Yield Maximiser Fund (managed fund) (ASX: QMAX)
- Betashares S&P 500 Yield Maximiser Fund (managed fund) (ASX: UMAX)
- Betashares FTSE RAFI Australia 200 ETF (ASX: QOZ)
Cash & fixed income
- Betashares Australian Composite Bond ETF (ASX: OZBD)
- Betashares Australian Cash Plus Fund (managed fund) (ASX: MMKT)
The green energy transition
- Betashares Global Uranium ETF (ASX: URNM)
- Betashares Energy Transition Metals ETF (ASX: XMET)
- Betashares Climate Change Innovation ETF (ASX: ERTH)
Investing involves risk. The value of an investment and income distributions can go down as well as up. An investment in each fund should only be considered as part of a broader portfolio, taking into account your particular circumstances, including your tolerance for risk. For more information on the risks and other features of each fund, please see the relevant Product Disclosure Statement and Target Market Determination, available at www.betashares.com.au.
Any Betashares Fund that seeks to track the performance of a particular financial index is not sponsored, endorsed, issued, sold or promoted by the index provider. No index provider makes any representations in relation to the Betashares Funds or bears any liability in relation to the Betashares Funds.
1. Source: Betashares, Nasdaq. Past performance is not indicative of future performance of any index or ETF. You cannot invest directly in an index. Does not take into account any ETF fees and costs. NDQ management fees and costs are 0.48% p.a.
2. Source: S&P Dow Jones Indices – S&P 500.
3. Source: Nasdaq, Bloomberg. Based on Bloomberg analyst consensus as at 23 November 2023.
4. Survey conducted by Investment Trends, concluding August 2023. Based on 1740 respondents.
5. Yield calculated by summing the prior 12-month per unit distributions divided by the closing NAV per unit at the end of the period. Yield will vary and may be lower at the time of investment. Franking level is total franking level over the last 12 months. Past performance is not indicative of future performance of any index or ETF.
6. The annualized total expected return of the portfolio if underlying bonds are held to maturity and do not default, and the coupons are reinvested. Assumes no change in interest rates. Subject to change over time.
7. Source: ASX 30 Day Interbank Cash Rate Futures Implied Yield Curve.
8. Source: World Energy Transitions Outlook 2023
9. Source: World Energy Investment 2023
10. Source: ‘Decarbonization reaches a turning point’ – Briefings from Goldman Sachs, 15 December 2023.
11. Source: Our World In Data; Ember – Yearly Electricity Data (2023); Ember – European Electricity Review (2022); Energy Institute – Statistical Review of World Energy (2023)
12. Source: Plans For New Reactors Worldwide
13. Source: Supply of Uranium
14. Source: World Uranium Mining Production
15. Sources: World Nuclear, Sprott. Assumes all planned uranium projects and nuclear reactors come online as scheduled.
16. Source: Material and Resource Requirements for the Energy Transition. As at July 2023.
3 comments on this
Well thought out and overall cover of ETF’s. In depth widespread and clear availability for those looking to expand their portfolios. A god article, well written.
Should investors in INCM give consideration to selling out of the INCM ETF and investing the proceeds in funds outlined above for Sustainable Income / Cash & Fixed income?
Hi Paul,
This is not a question we can answer for you. The information in this blog is general only, and doesn’t take your circumstances into account. In order to work out whether changing would be correct for you, many factors would need to be considered. It’s best to speak to a registered financial adviser with questions like this.
Cheers,
Patrick