

Home
keyboard_arrow_down
chevron_right
Insights
keyboard_arrow_down
chevron_right
Dr Copper and budget woes – how to navigate a challenging Australian equity market
keyboard_arrow_down

Dr Copper and budget woes – how to navigate a challenging Australian equity market

Australian equities have become the most challenging part of a lot of investors portfolios. We unpack why along with a practical investment approach.

10 min read 9 Sep 2026

This information is for the use of financial advisers and other wholesale clients only. It must not be distributed to retail clients.

Australian equities have materially lagged global peers, both year to date and over longer-term horizons, returning 4.4% over the past twelve months against 20.4% for global shares1. Australia’s lack of direct AI beneficiaries, partly offset by the related resource rally, has left most of our domestic market looking limp in the face of supercharged earnings and returns overseas.

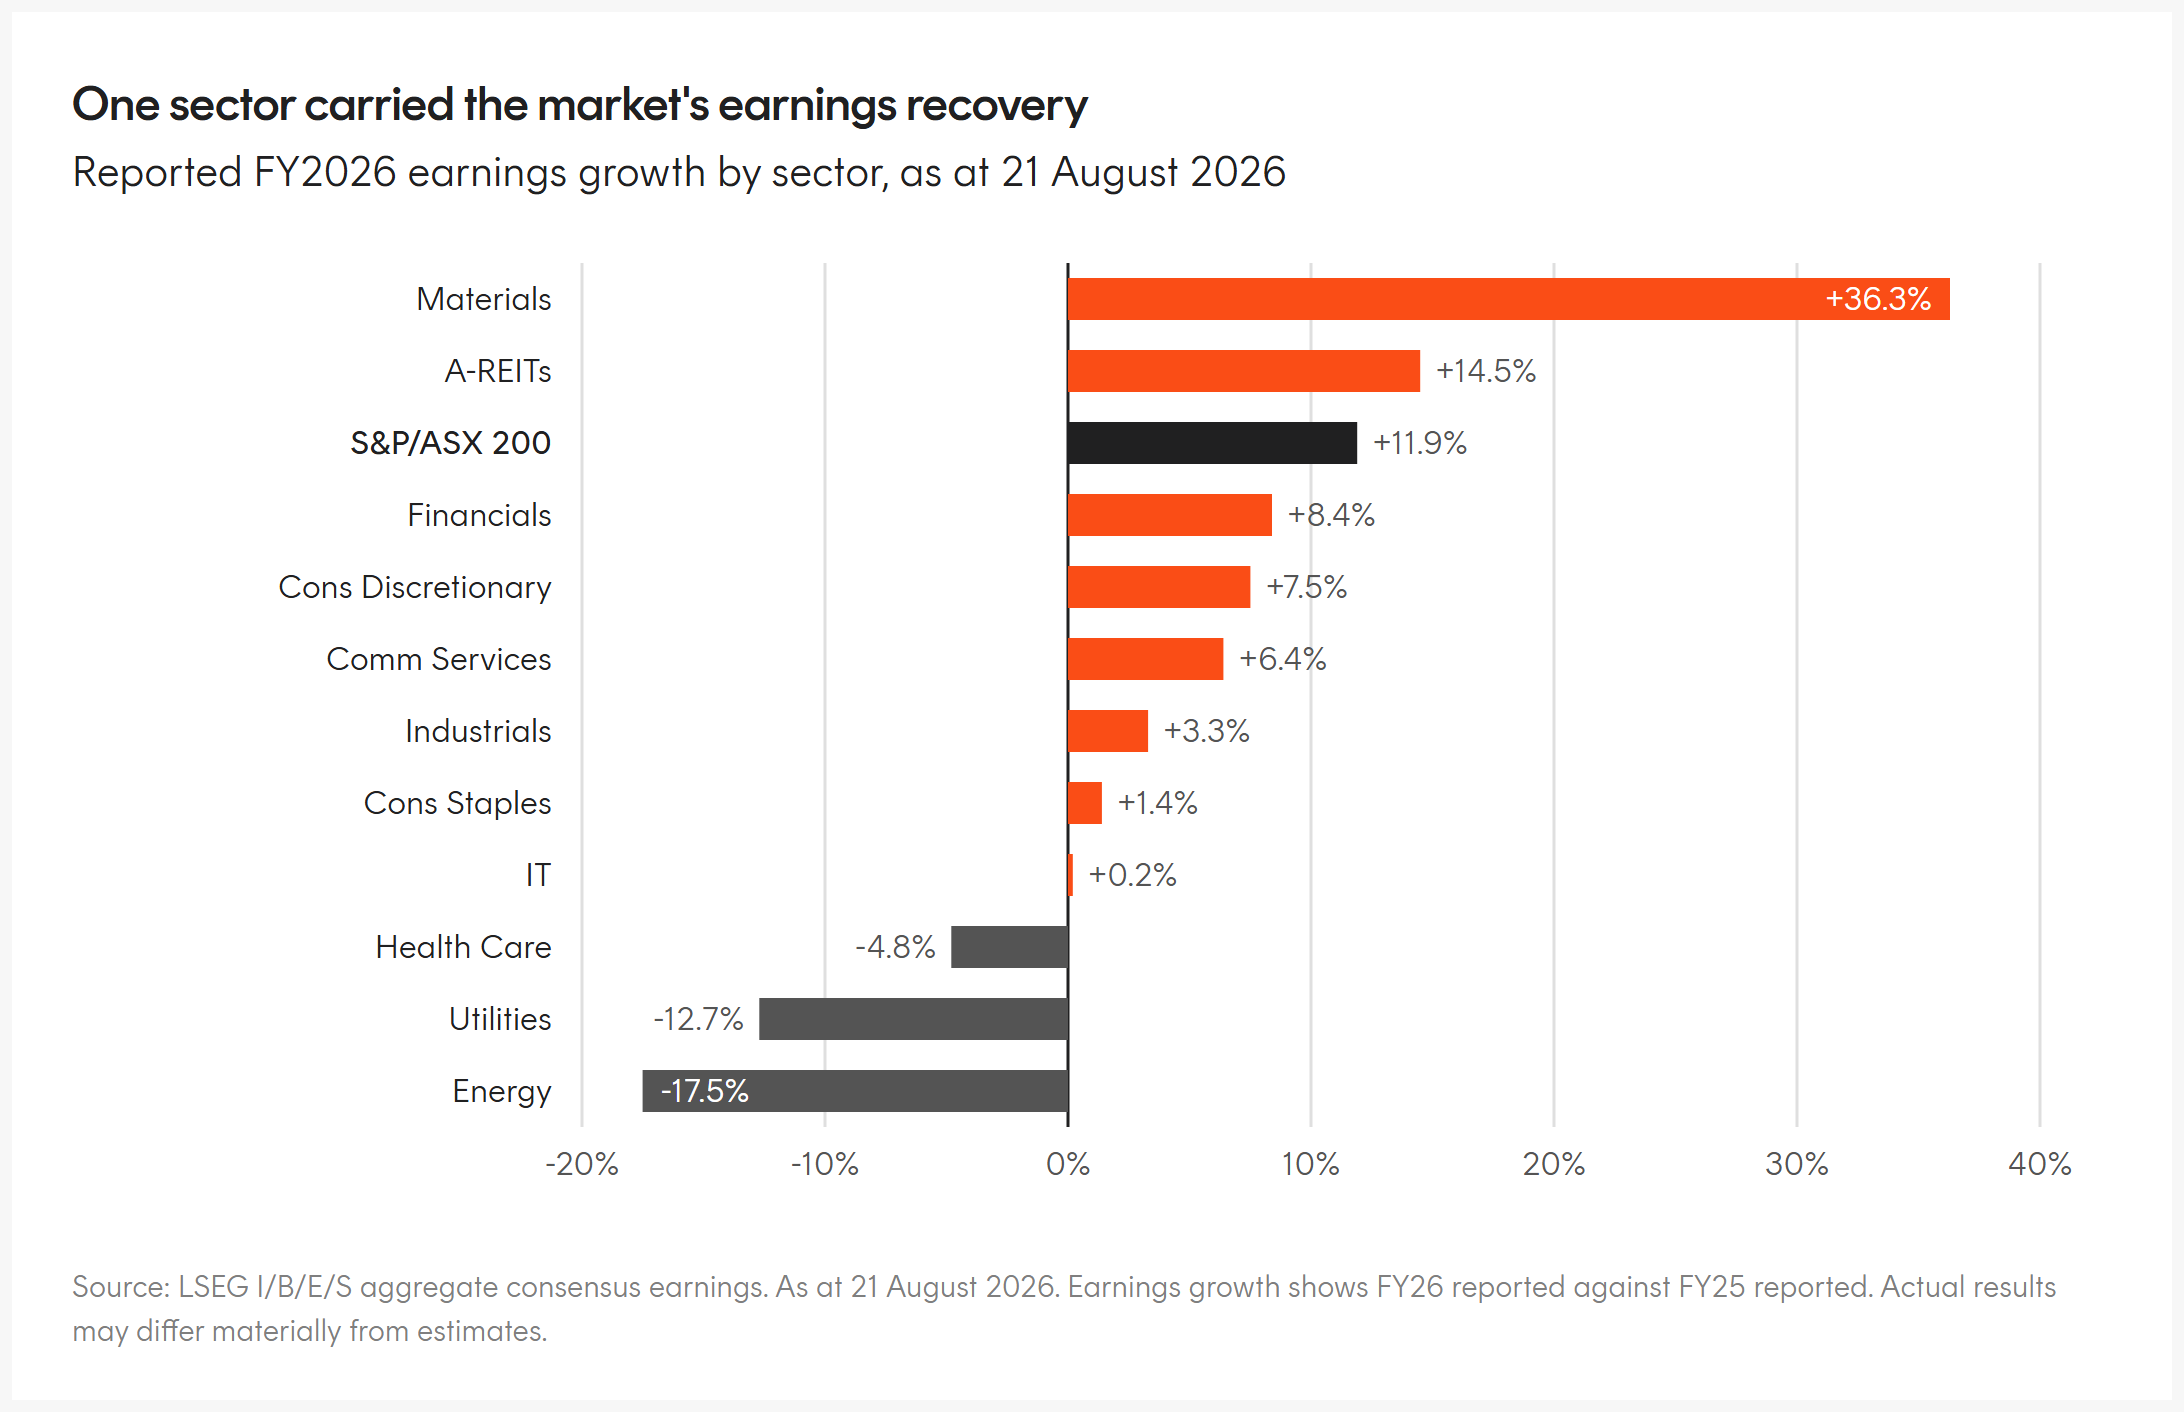
The Australian market entered 2026 on the back of three consecutive financial years of negative earnings growth. So, a reported 11.9% growth rate for FY26 is something to rejoice in2. Materials are by far the biggest contributor to this turnaround, exclude the sector and the market would have grown just 3.4%3.
Dr Copper replaces Chinese medicine for Australia’s resources sector

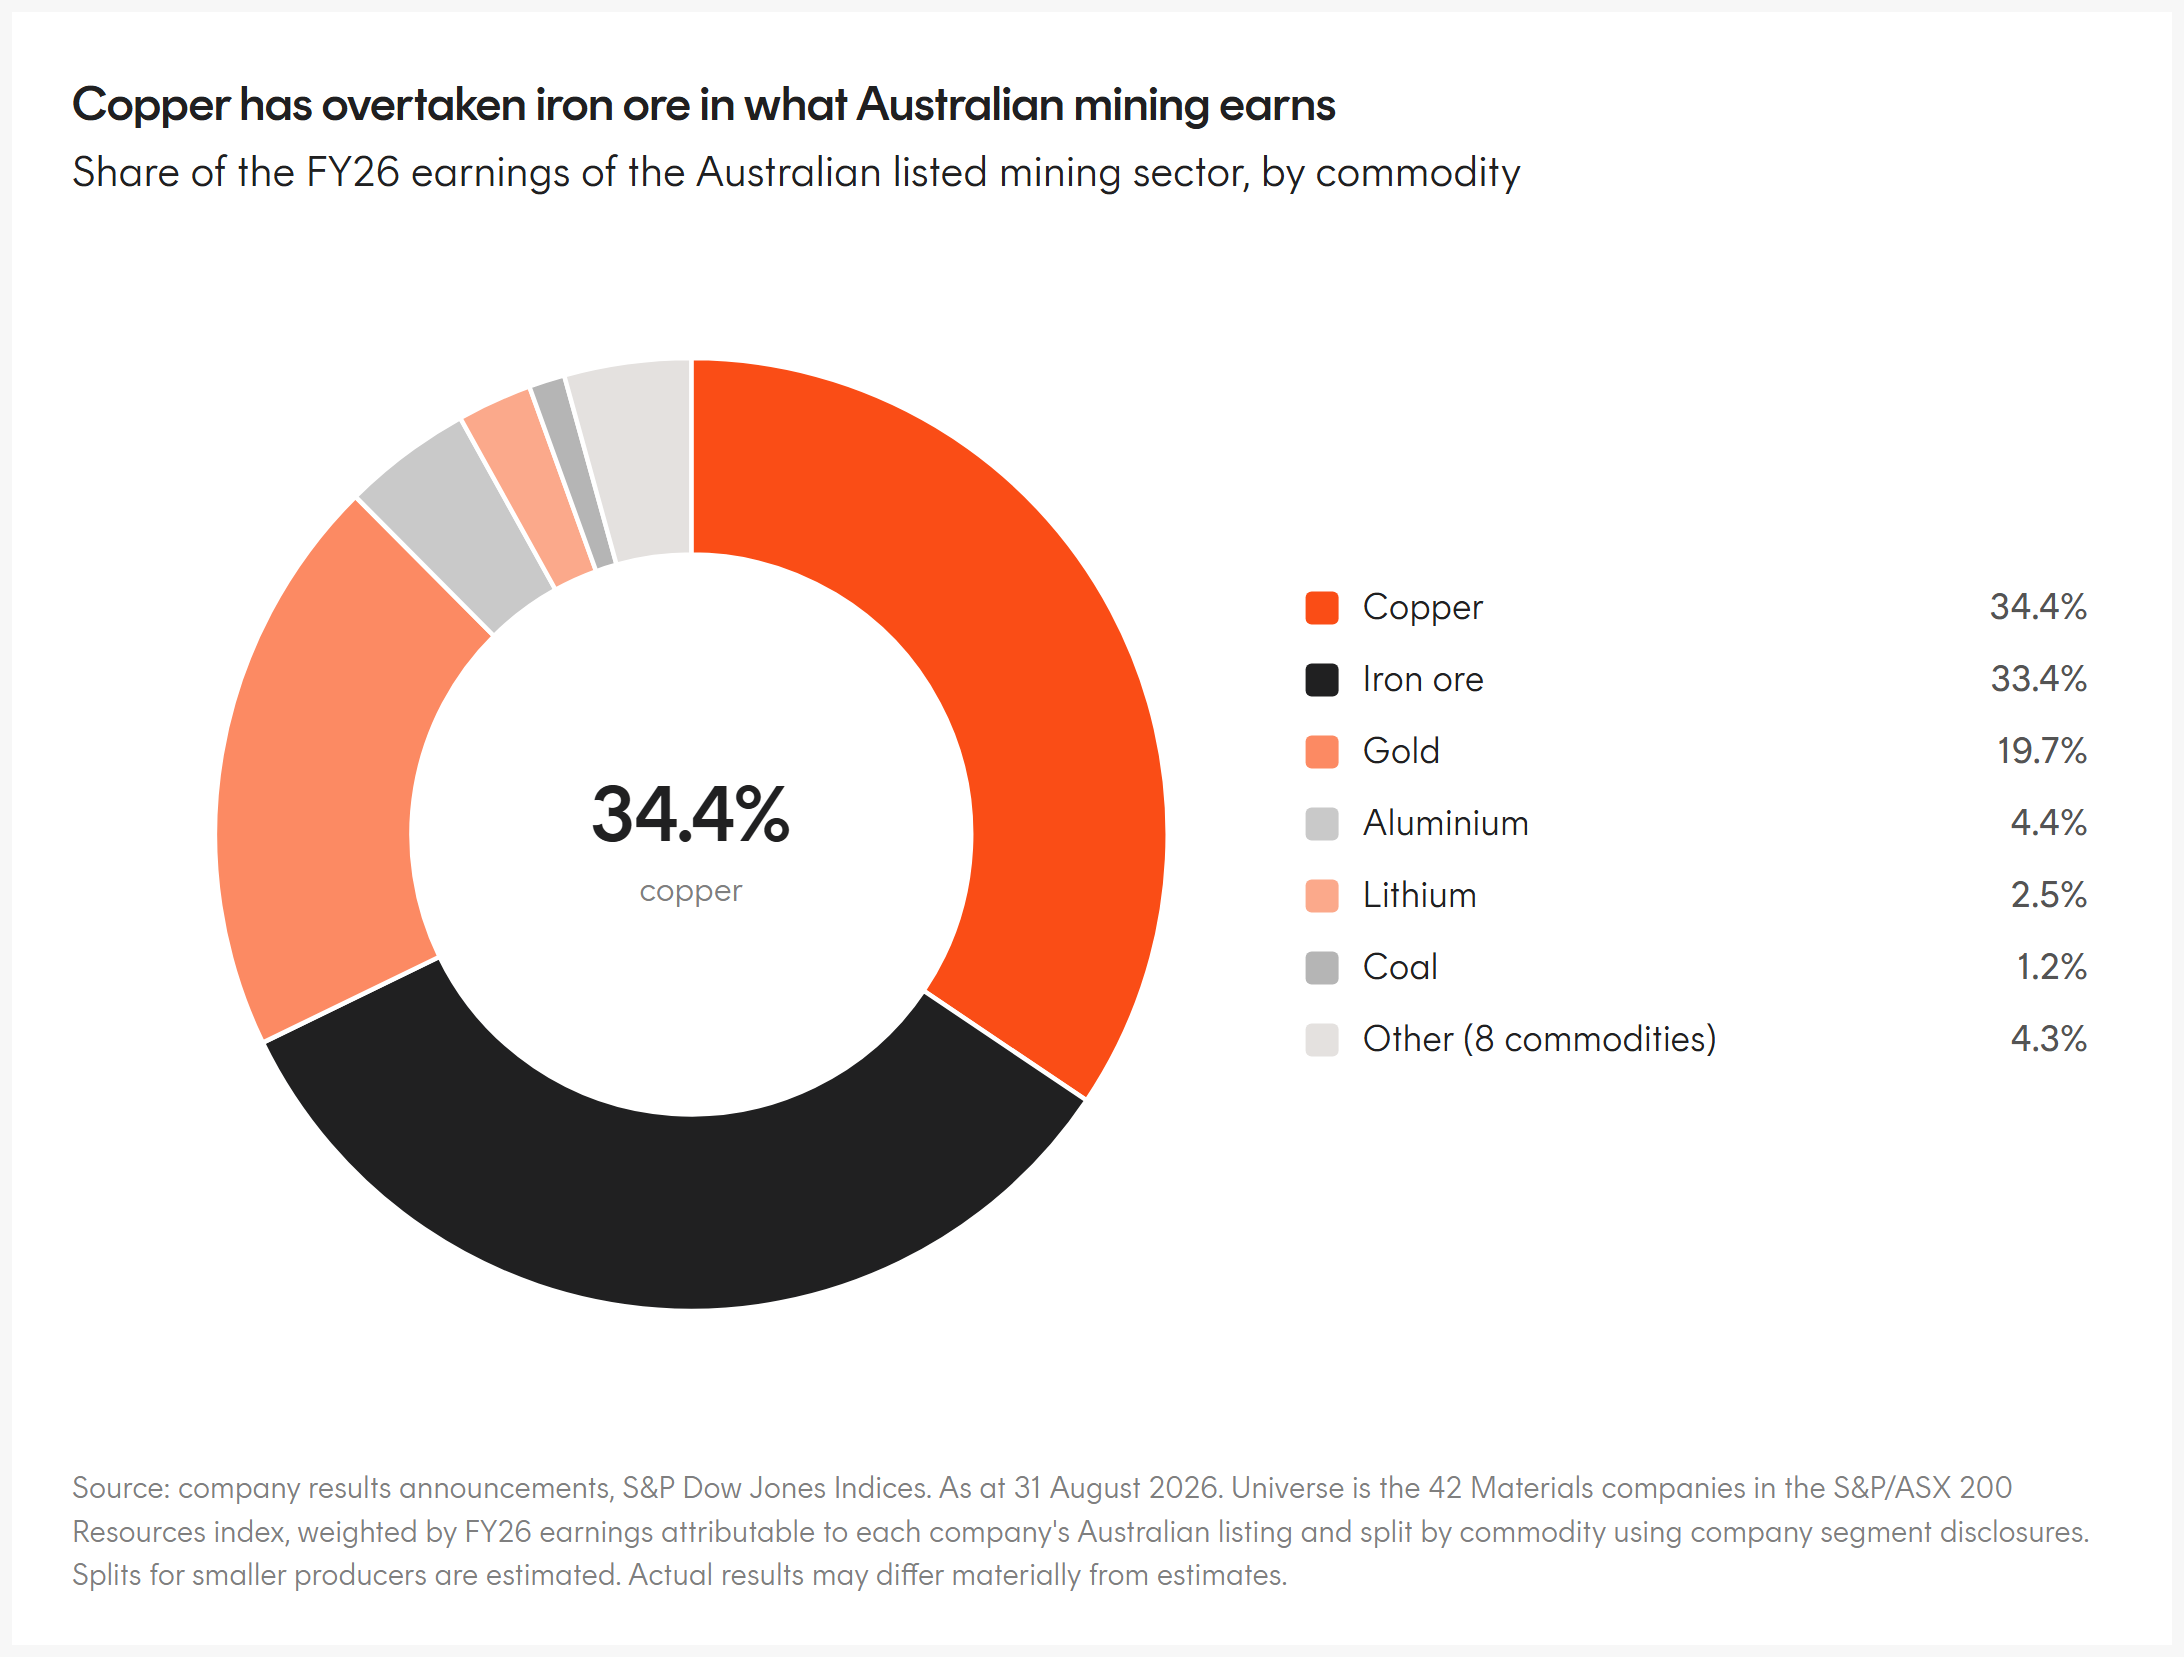
Led by BHP and Rio’s strategic pivots Australia’s materials sector is much less reliant on iron ore than it once was. BHP’s FY26 result in August confirmed copper at 54.2% of segment earnings against iron ore’s 43.3%4, the first full year copper has been the majority, while Rio reported in late July revealing their copper earnings were up 84% year on year and now just behind iron ore earnings5.

The surging copper price, related to the green energy transition and AI buildouts, has therefore been a significant positive contributor to the sector’s performance, alongside a gold price that rallied 9.5% through the season, albeit still below early year record highs. Gold miners, now 5.7% of the ASX 200 and a larger slice than the entire energy sector, rose 28.6% in August6, so this bodes well for the Australian market so long as these commodities maintain their value.
Budget woes for the Big 4 mortgage hose

Australia’s other majors, the big banks, are not faring as well. They fell 7.4% through August while their FY27 earnings estimates were cut just 0.5%, a de-rating rather than a downgrade7.

Since the GFC international banks have diversified into higher-growth businesses including payments, capital markets and wealth management. These global peers are seeing historic growth and profits.

Australia’s Big Four took a different path. They simplified, exited adjacent businesses and doubled down on home lending, a mature market now facing fresh headwinds following the Federal Budget’s tax changes.

Australian financials sit near a twenty-three-year valuation extreme, in the 95th percentile of that history8. It is however worth separating the cohort, as CBA still stands out as expensive.

Australian earnings resume their downtrend on a challenged outlook

Turning to the remainder of the market, the forward view has deteriorated since the Federal Budget. The FY27 earnings estimate for the Australian market has fallen by 2.9% in total. Communication Services is down 2.9%, Consumer Discretionary 4.0%, and Health Care 11.1%. Financials sits effectively unchanged while Materials, the sector that carried FY26, was cut 8.8% through the earnings season itself as input costs climbed while commodity prices held9.
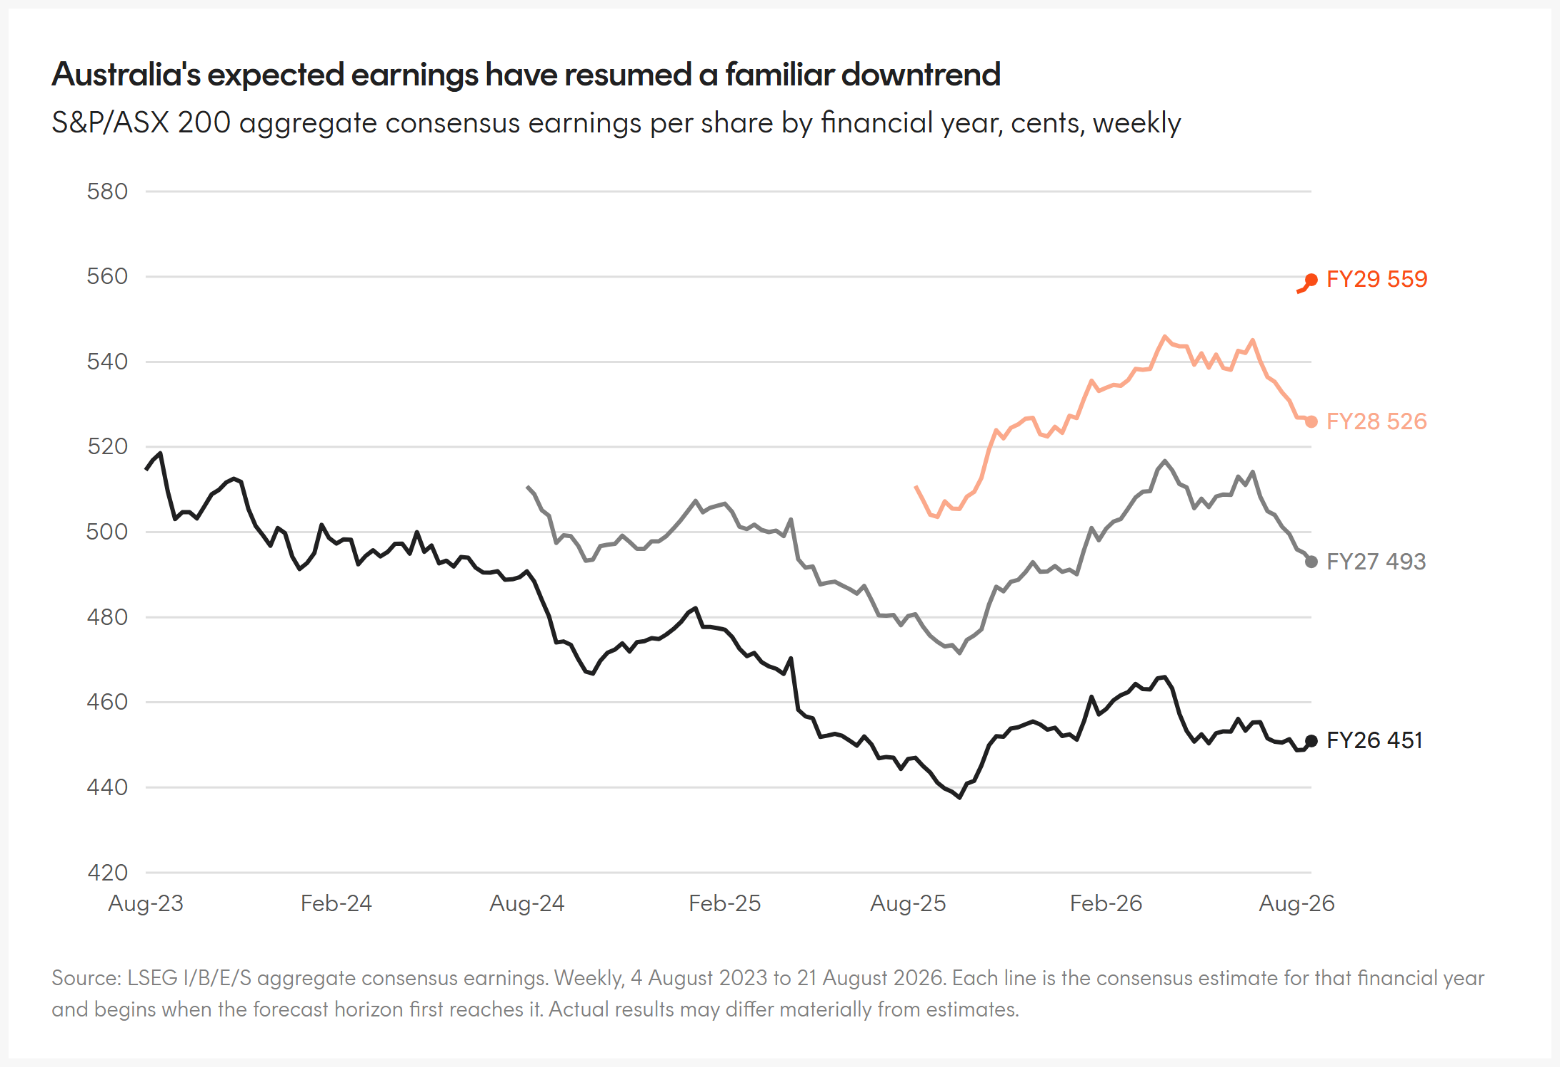
The consumer is the part of this that reads as a genuine domestic signal. Its cuts were largely in place before the season began following the budget, yet investors still punished companies well beyond them. JB Hi-Fi reported record sales and a higher full-year profit, saw its forward earnings trimmed 4.4%, and fell 12.3% on the day and 16.8% over the month, taking Harvey Norman, Premier and Wesfarmers down more than 4% with it10. Wesfarmers was upgraded and still lost 11%. Where estimates did fall, earnings came down roughly twice as far as sales11, a margin story rather than demand.

It must be noted that not all of these downgrades belong to the Budget. Utilities downgrades reflect retailers absorbing lower power prices. Health Care’s cut is almost entirely CSL, a global earner. Dividends and buybacks held up better than earnings did. Nevertheless, the ASX 200’s 4.7% gain since the federal budget has come from a re-rating higher rather than any earnings upgrades, with the market’s price up 3.2% through the season while forward earnings fell 3.0%12. In a season that paid for guidance over results, that leaves little room for disappointment.

Investment implications: How to navigate the challenged Australian equity market

Anecdotally we have been hearing from clients that the Australian equities portion of their portfolios has become the most challenging to manage. The data on recent active manager performance supports this.

Over the past 6- and 12-months the Australian equity active manager cohort, weighted by funds under management (FUM), has underperformed our broad market Australian equities index ETF, A200 Australia 200 ETF, by 3.8% and 2.3% respectively13. The monthly return dispersion of these managers is the widest in nine years14, picking the wrong manager has rarely been costlier.
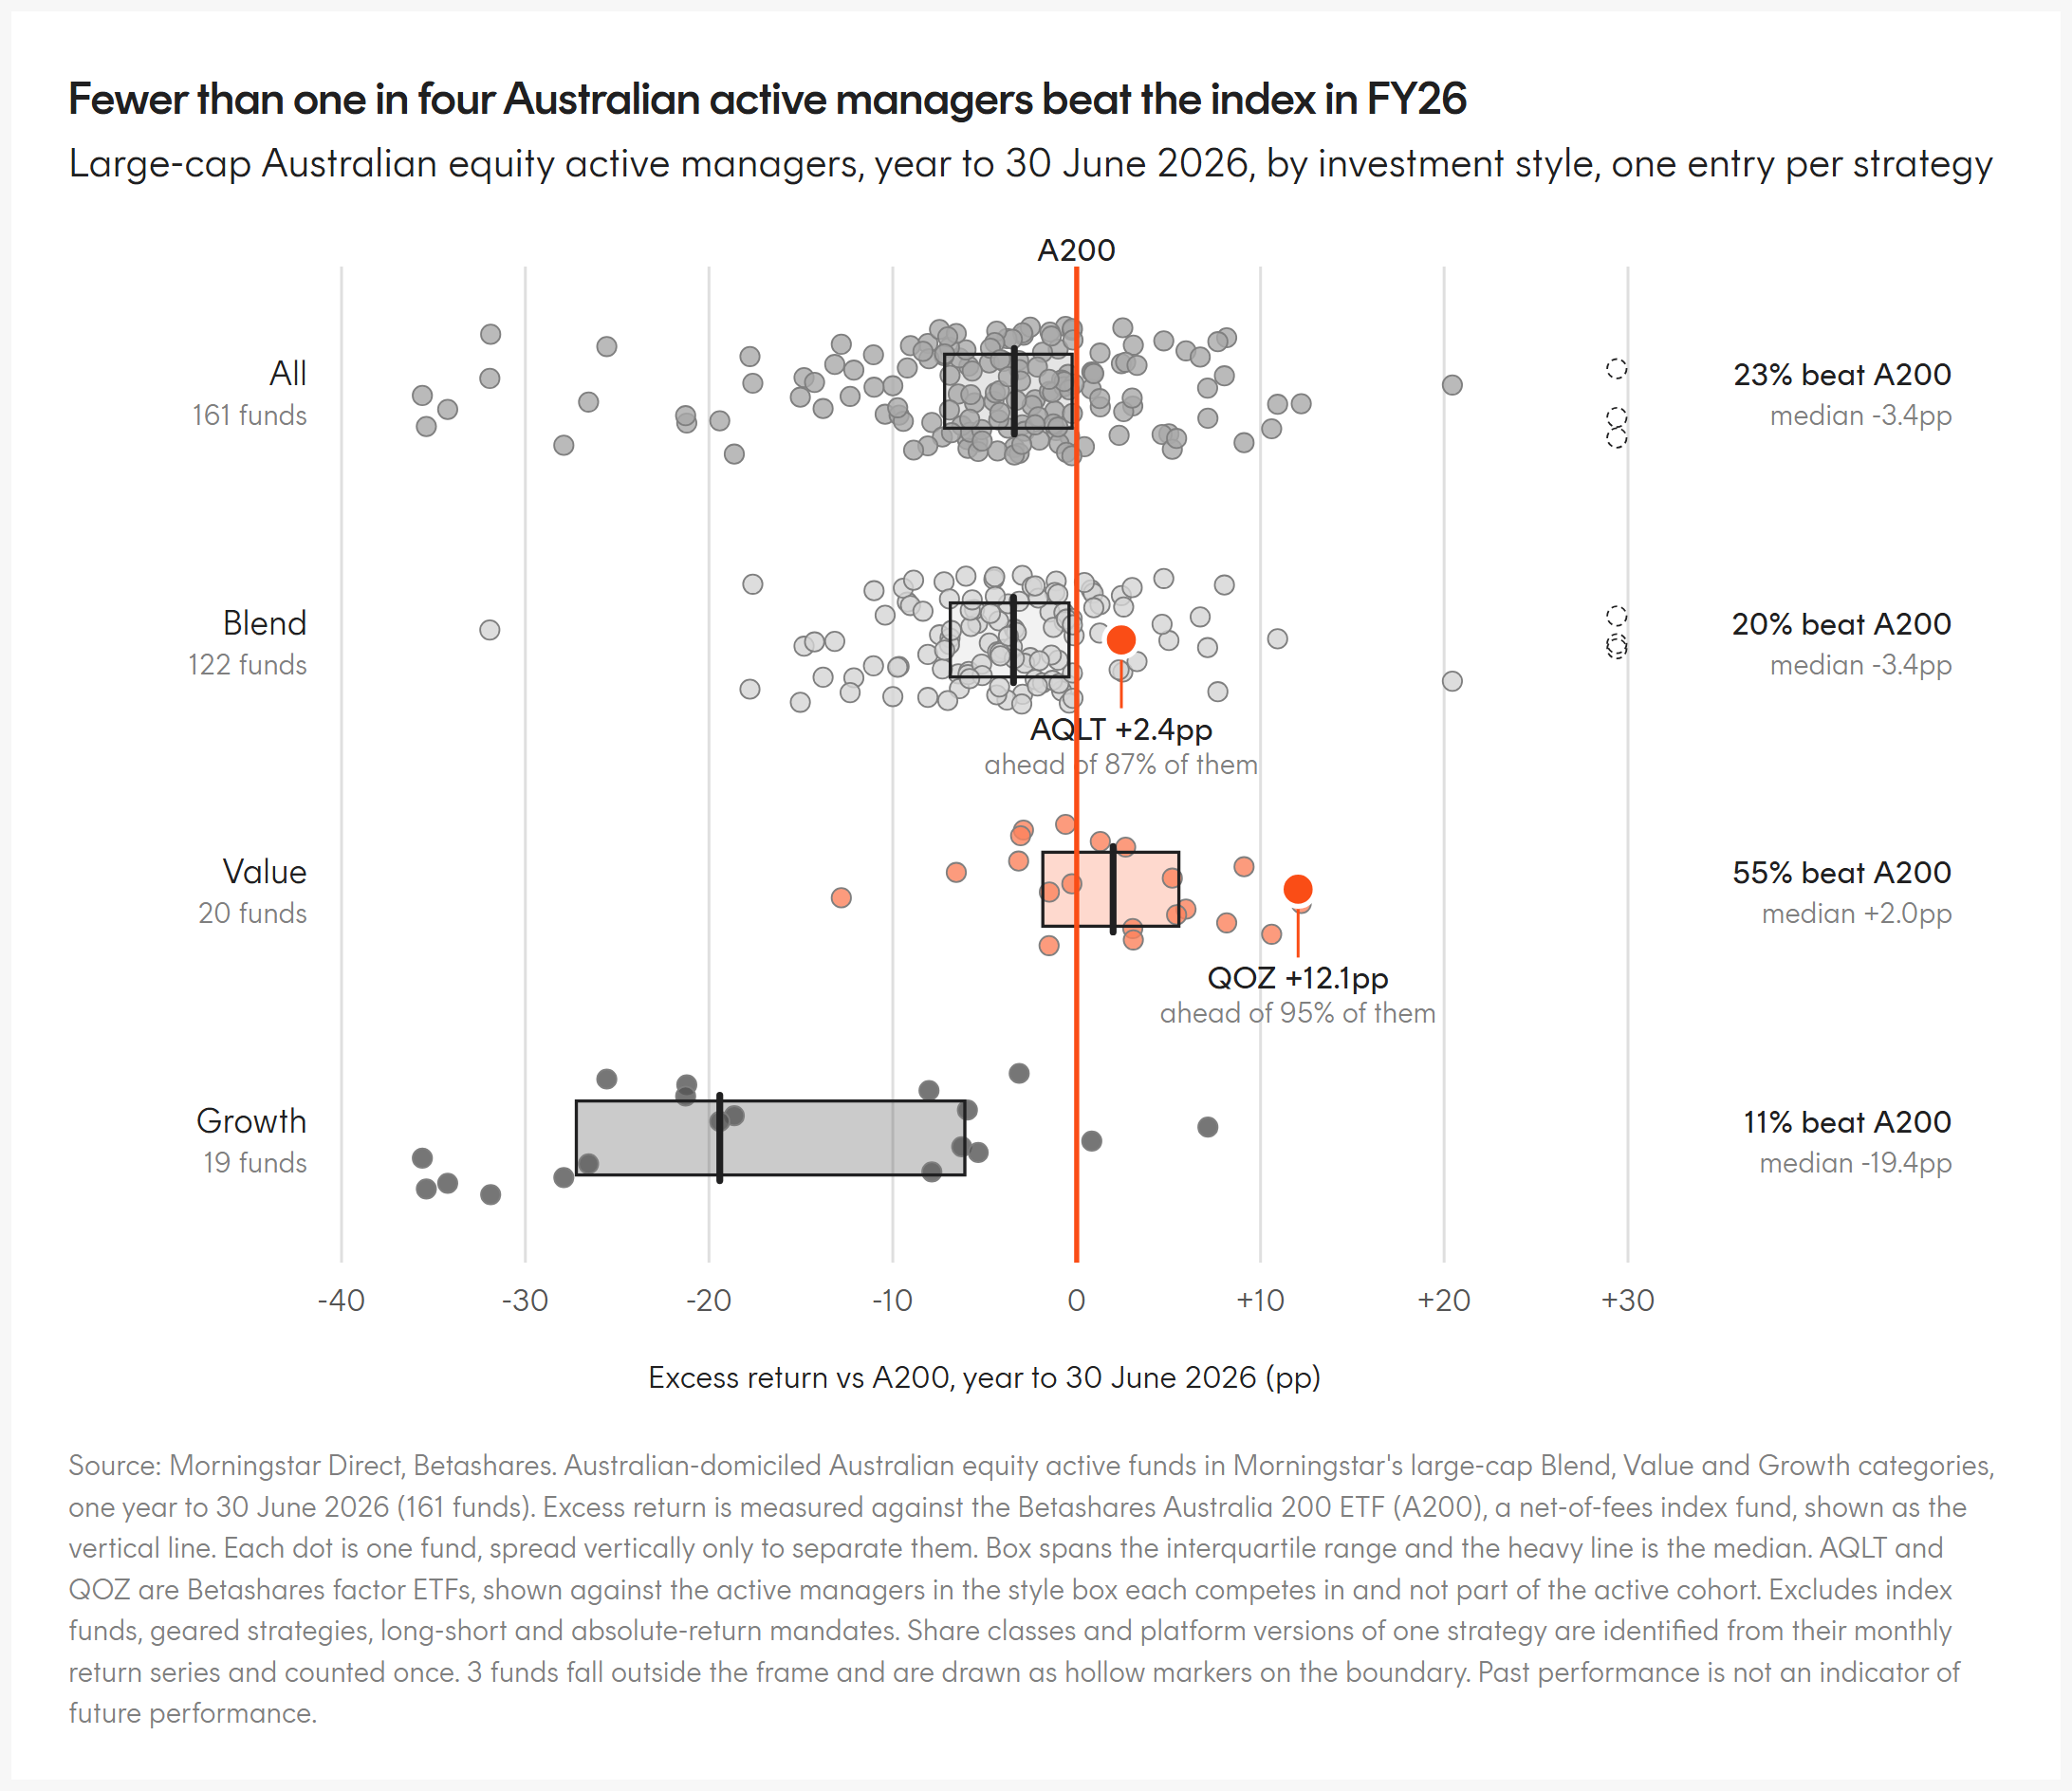
Over the same period our passive Australian quality and value factor ETFs have both outperformed A200 as well as a majority of active managers with the same style biases as defined by Morningstar15, highlighted in the below chart. We believe a well-constructed, systematic, low-cost and diversified approach to capturing defined risk premia has a better chance at delivering on the pursuit of market beta outperformance than a higher cost more concentrated active manager cohort that can be susceptible to style drift over time.

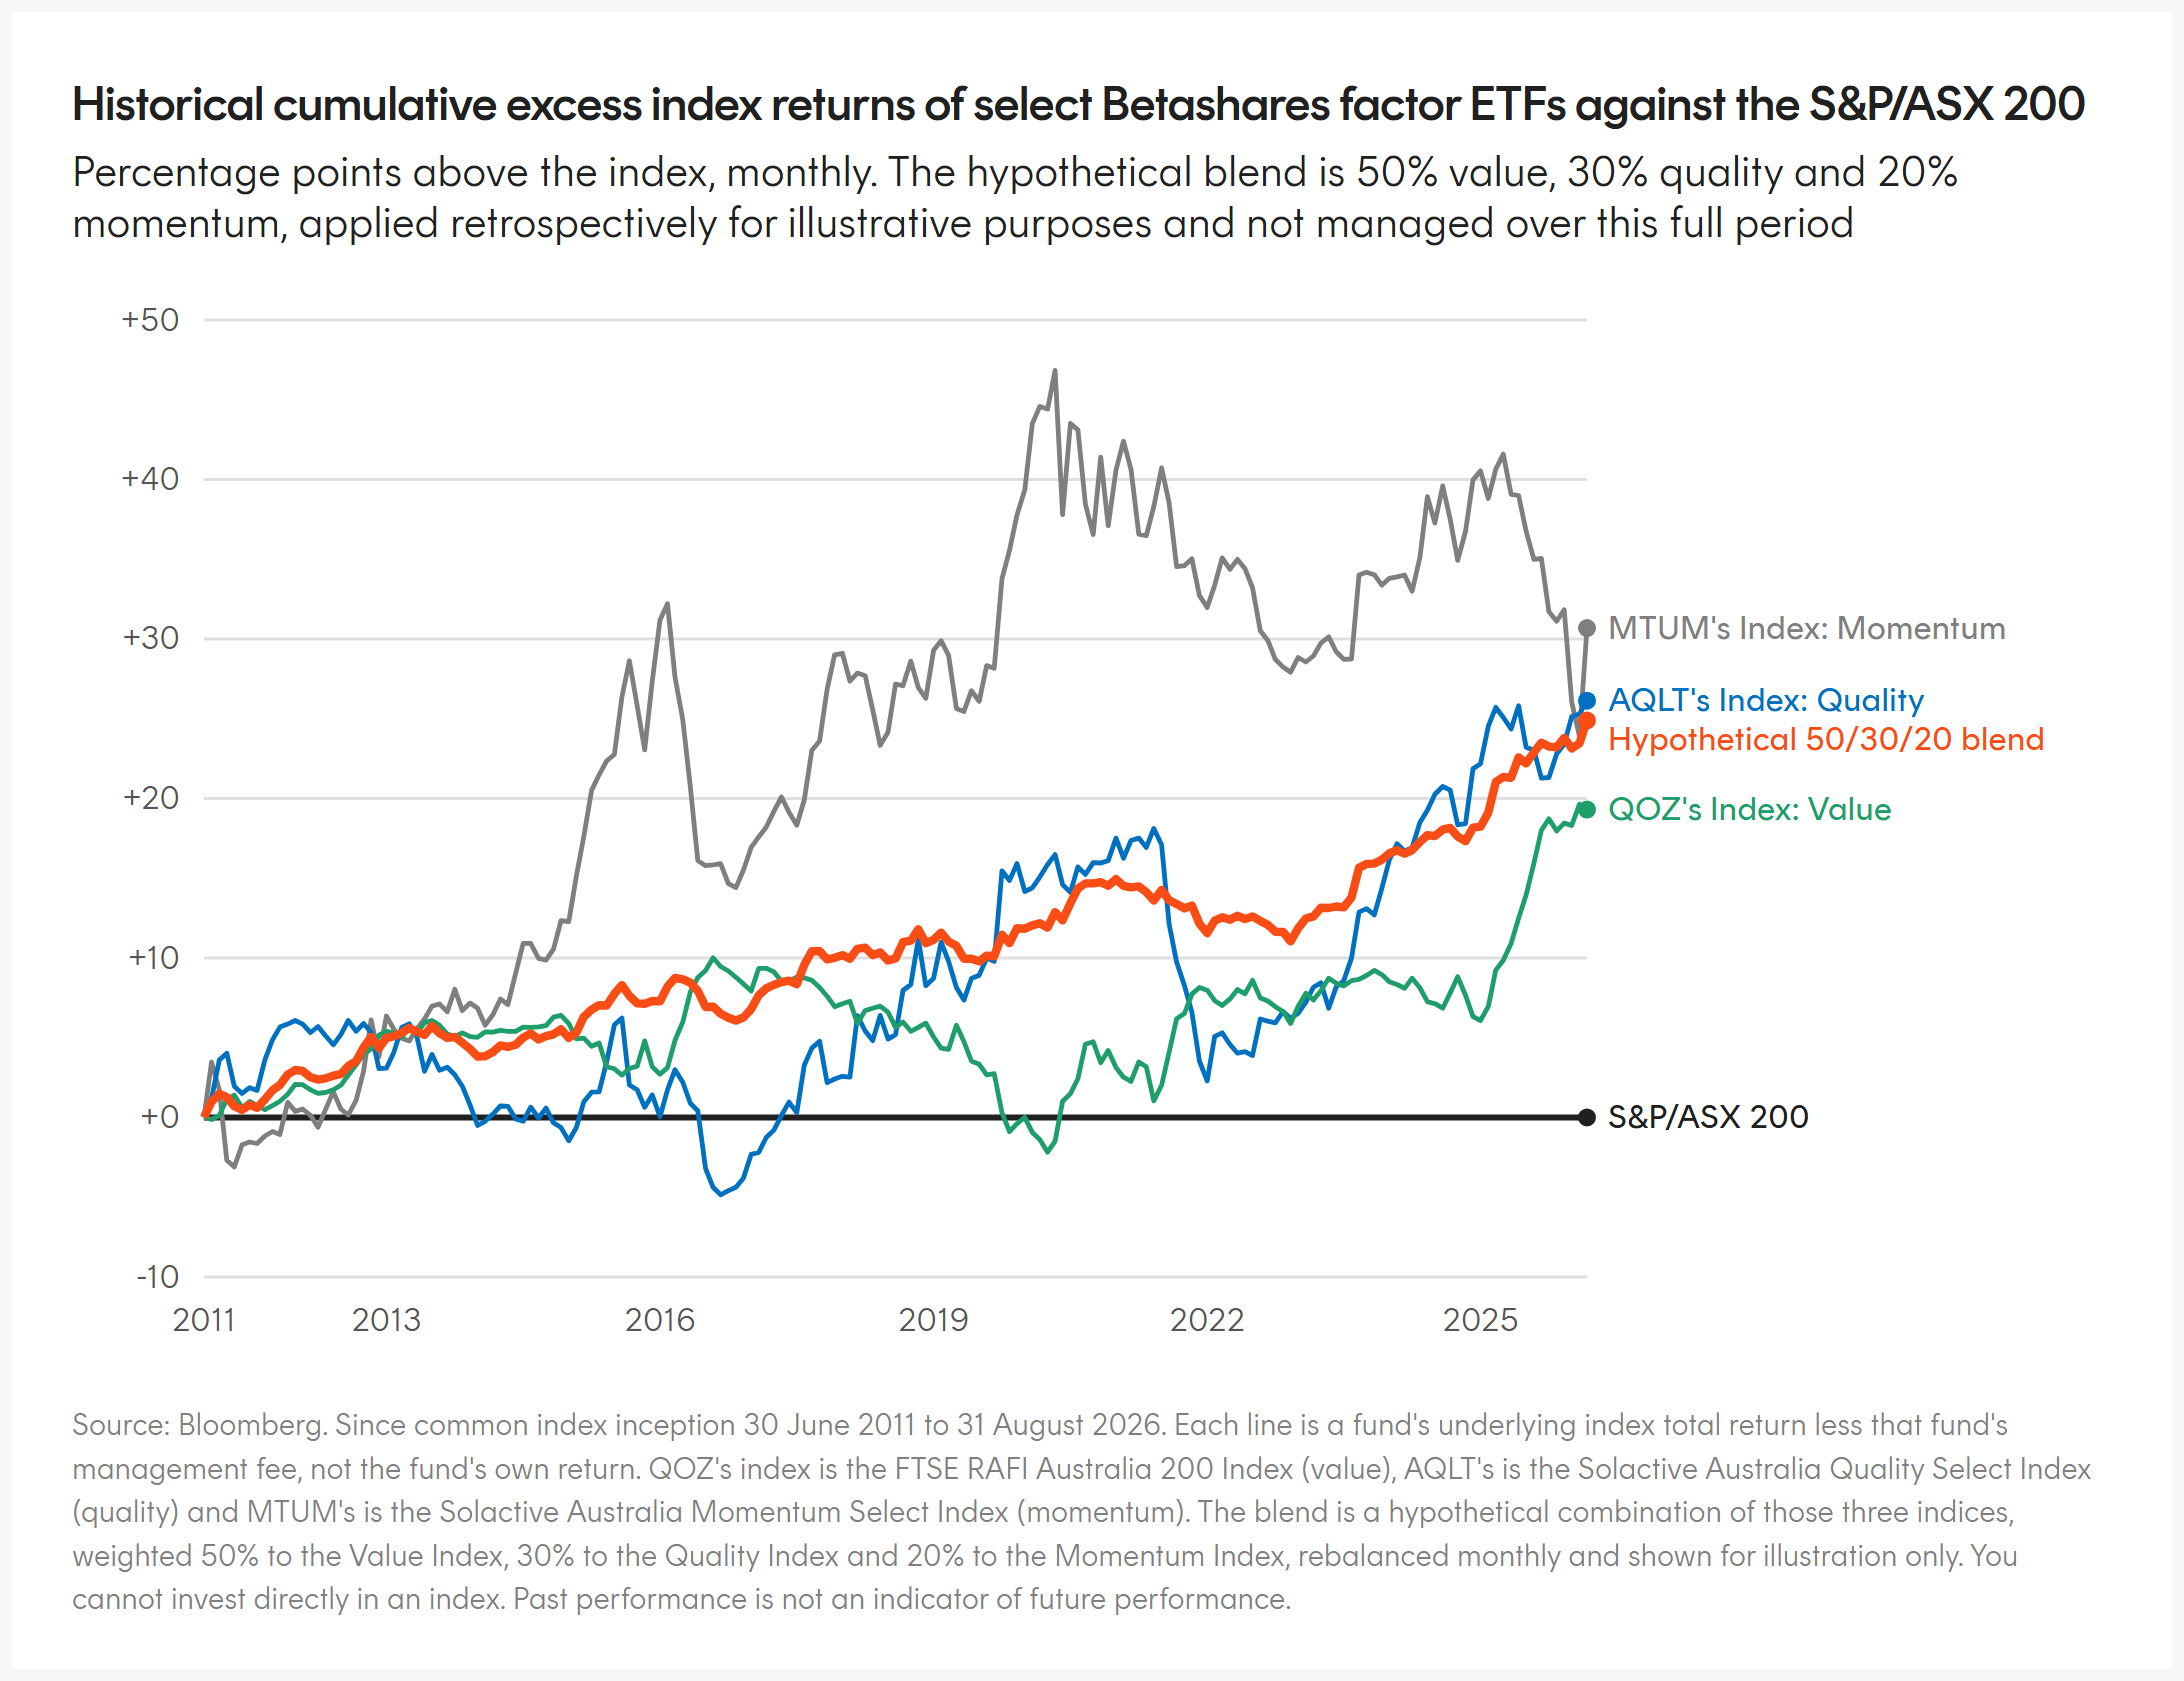
Better still, blending these efficient factor building blocks may achieve improved risk adjusted returns as different factor exposures are expected to out- and underperform during different phases of the market cycle. In our own DAA Managed Accounts we use a blend of 50% A200, for low cost market beta, alongside 50% allocated to QOZ FTSE RAFI Australia 200 ETF, AQLT Australian Quality ETF and MTUM Australian Momentum ETF in a 50/30/20 split. A factor blend which has provided outperformance over the market beta A200 over both short and longer-term periods16.

The below chart shows cumulative excess returns versus the S&P/ASX 200. When a line, such as AQLT’s is moving up it represents outperformance versus the S&P/ASX 200 rather than total returns alone.
There are risks associated with an investment in the Funds. An investment in the Funds should only be considered as a part of a broader portfolio, taking into account your particular circumstances, including your tolerance for risk. For more information on risks and other features of the Funds, please see the Product Disclosure Statement and Target Market Determination, both available on www.betashares.com.au.


The information contained in this article is general information only and does not take into account any person’s financial objectives, situation or needs. Investors should consider the appropriateness of the information taking into account such factors and seek financial advice. This article is provided for information purposes only and is not a recommendation to make any investment or adopt any investment strategy.

1. Source: Bloomberg. As at 31 August 2026. Total returns for the S&P/ASX 200 and the MSCI World Index over the twelve months to 31 August 2026. Past performance is not an indicator of future performance. You cannot invest directly in an index.

2. Source: LSEG I/B/E/S. As at 21 August 2026. Analyst consensus earnings growth for the S&P/ASX 200 for FY26, 1 July 2025 to 30 June 2026.

3. Source: LSEG I/B/E/S. As at 21 August 2026. Analyst consensus earnings growth for the S&P/ASX 200 for FY26, 1 July 2025 to 30 June 2026, and the same measure excluding the Materials sector. Actual results may differ materially from expectations.

4. Source: BHP FY26 financial results. 18 August 2026, based on segment underlying EBITDA before group and unallocated items.

5. Source: Rio Tinto H1 CY26 financial results. 30 July 2026, based on underlying EBITDA.

6. Source: Bloomberg, S&P Dow Jones Indices. Gold price movement 24 July 2026 to 31 August 2026. Gold miners are the 21 S&P/ASX 200 constituents classified in the GICS Gold sub-industry, 5.7% of the index by weight as at 31 August 2026, and their return is for the month of August 2026. Past performance is not an indicator of future performance.

7. Source: Bloomberg, LSEG I/B/E/S. Price return for the S&P/ASX 200 Banks index for the month of August 2026. The earnings revision is the change in FY27 analyst consensus earnings for the S&P/ASX 200 Financials sector from 8 May 2026 to 21 August 2026. Actual results may differ materially from expectations. Past performance is not an indicator of future performance. You cannot invest directly in an index.

8. Source: LSEG I/B/E/S. As at 21 August 2026. The S&P/ASX 200 Financials sector’s 12-month forward price-to-earnings ratio of 18.1x is in the 94.5th percentile of weekly observations since available data from February 2003.

9. Source: LSEG I/B/E/S. As at 21 August 2026. Change in FY27 analyst consensus earnings per share from 8 May 2026, the last weekly observation before the Federal Budget, to 21 August 2026. The Materials figure is the change from 26 June 2026 to 21 August 2026. Actual results may differ materially from expectations.

10. Source: JB Hi-Fi Limited, 2026 Full Year Results, ASX announcement, 17 August 2026; Bloomberg; LSEG I/B/E/S. Share price moves are for 17 August 2026, JB Hi-Fi’s results day, and for the calendar month of August 2026. Changes in forward earnings are changes in twelve-month forward analyst consensus earnings per share from 25 June 2026 to 20 August 2026. Past performance is not an indicator of future performance.

11. Source: LSEG I/B/E/S, Bloomberg. Share price movements are for the month of August 2026 and for 17 August 2026, the day of JB Hi-Fi’s FY26 result. Changes to forward earnings and sales are changes in 12-month forward analyst consensus from 25 June 2026 to 20 August 2026. Actual results may differ materially from expectations. Past performance is not an indicator of future performance.

12. Source: Bloomberg, LSEG I/B/E/S. S&P/ASX 200 price return from 12 May 2026 to 31 August 2026. Price and forward earnings changes over the reporting season are from 26 June 2026 to 21 August 2026. Actual results may differ materially from expectations. Past performance is not an indicator of future performance.

13. Source: Morningstar Direct. 30 June 2025 and 31 December 2025 to 30 June 2026. Measures the funds under management weighted returns of all active Australian equity funds in Morningstar’s Australia & New Zealand category as classified by Morningstar. Returns for active managers and Betashares Australia 200 ETF (ASX: A200) are net of fees. A200’s management fee is 0.04% p.a. Past performance is not an indicator of future performance.

14. Source: Morningstar Direct, Betashares. Dispersion is the average monthly cross-sectional interquartile range of returns for active Australian equity funds in Morningstar’s large-cap Blend, Value and Growth categories, measured over each financial year from FY2018 to FY2026. FY2026 is 1.57 against a nine-year average of 1.28. Past performance is not an indicator of future performance.

15. Source: Morningstar Direct, Betashares. One year to 30 June 2026. Betashares Australian Quality ETF (ASX: AQLT) is compared with active funds in Morningstar’s large-cap Blend category and Betashares FTSE RAFI Australia 200 ETF (ASX: QOZ) with the large-cap Value category, and both with Betashares Australia 200 ETF (ASX: A200) which is used as a broad benchmark for all funds. AQLT was incepted on 4 April 2022 and has returned 12.2% p.a. to 30 June 2026. QOZ was incepted on10 July 2013 and has returned 10.0% p.a. to 30 June 2026. A200 was incepted on 7 May 2018 and has returned 9.1 p.a. to 30 June 2026. Returns are net of fees. Past performance is not an indicator of future performance.

16. Source: Bloomberg. Since common index inception 30 June 2011 to 31 August 2026. The blend is a hypothetical 50/30/20 combination of the indices underlying QOZ, AQLT and MTUM, rebalanced monthly and applied retrospectively for illustrative purposes; it was not managed over this full period. Each line is an index total return less the relevant fund’s management fee, not the fund’s own return. Past performance is not an indicator of future performance.

Written by
Tom Wickenden works as an investment strategist in Betashares investment strategy and research team. Tom is responsible for supporting both the sales and marketing teams across Betashares’ wide range of funds including all major asset classes. In his day-today Tom writes investment insights, prepares and presents investment presentations, attends meetings as a specialist resource, and represents Betashares in external media, podcasts, conferences, and op-eds. Prior to Betashares Tom worked in an accounting firm in London specialising in the fields of audit and forensic accounting. Tom is a Chartered Financial Analyst and has a Bachelor of Commerce majoring in Economics and Accounting from the University of Sydney.