
Tom Wickenden
7 minutes reading time
Key takeaways:
- Betashares FTSE RAFI Australia 200 ETF (ASX: QOZ) experienced its strongest year of outperformance between rebalances vs the ASX 200 last year (+10.6%), marking five of the past six years outperformingi.
- While overweights to the materials sector and underweights to select technology names and CSL at the start of the period were significant contributors to outperformance, a majority of positions drove the overall outperformance.
- QOZ’s recent rebalance saw a reduction in the materials allocation, following strong performance in the prior year, and a timely increase to energy companies.
- As a refresher, rather than market capitalisation QOZ’s index (the FTSE RAFI Australia 200 index) considers company’s sales, cash flows, dividends, and book values relative to one other and allocates index weights accordingly.
QOZ FTSE RAFI Australia 200 ETF outperformed the benchmark S&P/ASX 200 (ASX 200) by 10.6% between its most recent annual rebalances, the largest margin since launching in 2013, taking since inception outperformance to 0.92% p.a.ii
Marking five out of the past six years outperforming the ASX 200 between annual rebalances, we analyse QOZ’s performance over the past year and its positioning for the year ahead.
As a refresher, rather than market capitalisation QOZ’s index (the FTSE RAFI Australia 200 index) considers company’s sales, cash flows, dividends, and book values relative to one other and allocates index weights accordingly.
A reminder that past performance is not indicative of future performance.
Getting the big bets right
At each annual rebalance, QOZ’s index methodology aims to overweight companies that are cheaper than their relative fundamental values and underweight companies that are more expensive i.e. buy low and sell high. In this regard QOZ’s portfolio, can be viewed as a series of individual stock weighting bets versus the ASX 200.
In QOZ’s rebalance last year (21 March 2025) the index increased its weight in materials and energy, while reducing exposure to financials. CBA replaced CSL to become the biggest underweight in the index, while the overweight to BHP was the most significant. On a relative proportional basis there were big tilts to resource names like Newmont and Ampol and big reductions in technology stocks such as Xero and Wisetech.
As the year panned out most of these positional bets paid off as company’s values converged with their fundamentals. 63% of positions in QOZ’s portfolio contributed to outperformance versus the ASX 200, and importantly the return contribution of the winners significantly outweighed what the losers detractediii. Of individual positions that materially contributed to or detracted from relative performance, only 5 were negative versus 29 positive, as shown in the chart belowiv.
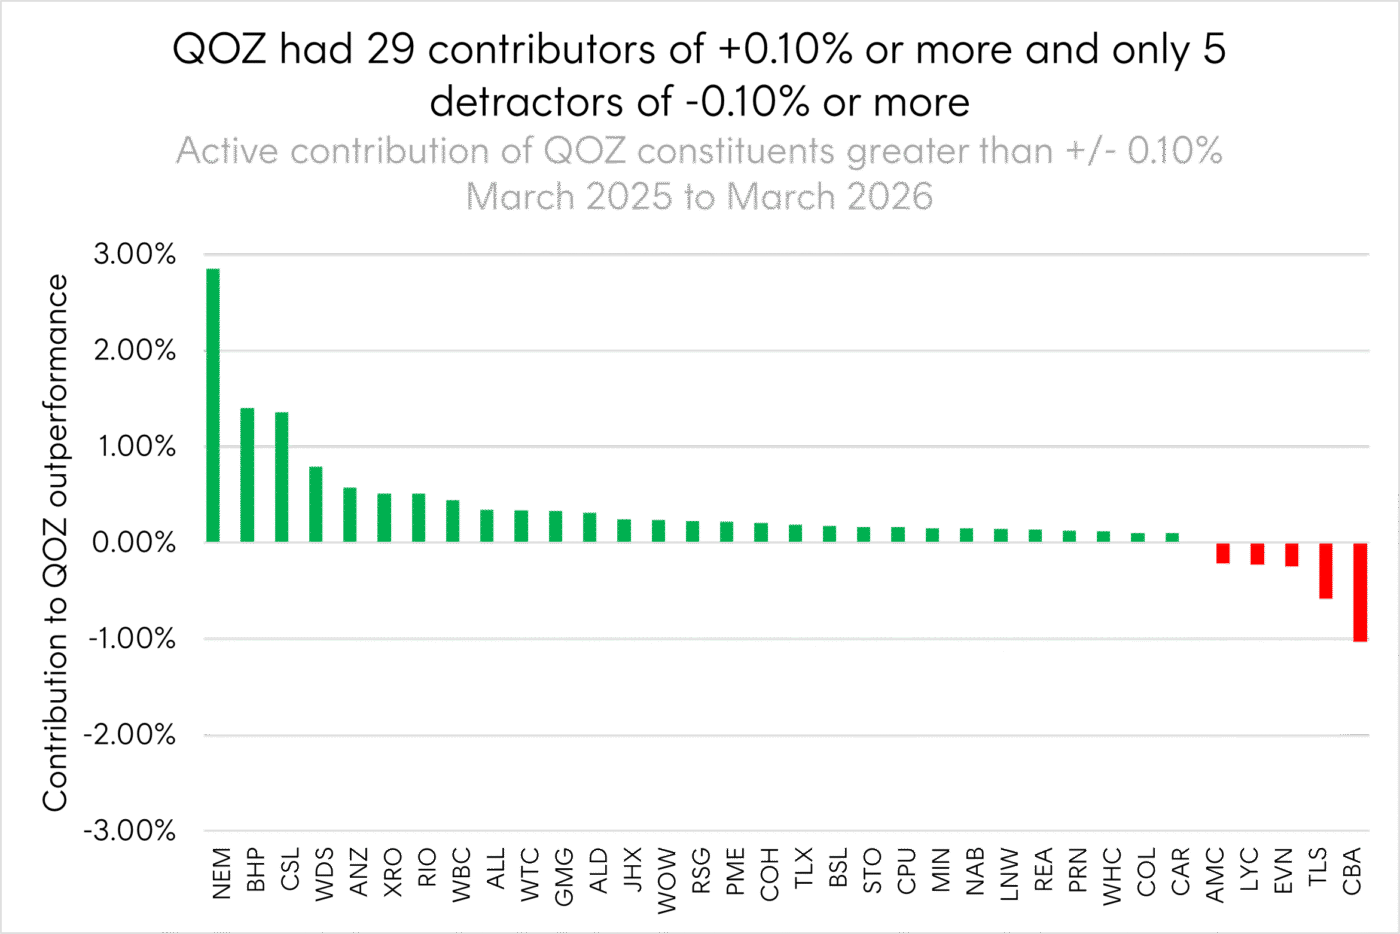
Source: Bloomberg. 21 March 2025 to 20 March 2026. QOZ attribution relative to the S&P/ASX 200. Past performance is not an indicator of future performance. You cannot invest directly in an index.
The materials and energy overweights contributed meaningfully. Gold and diversified miners like Newmont, BHP, Woodside and Rio Tinto had underperformed financials and higher growth names in Australia since 2023 leading to relatively lower valuations.
As commodity prices firmed and earnings expectations rebounded significantly, these names re-rated sharply, rewarding QOZ’s contrarian positioning.
QOZ’s reduced exposure to richly valued names proved equally valuable. In the pro-growth environment of previous years Australian technology stocks, like Xero and WiseTech, had risen to rich valuations that suffered at the end of 2025 and start of 2026 as the RBA hiked rates in the face of persistent inflation.
CSL, which had become a haven for active managers in the large cap space looking to avoid seemingly overpriced banks and underperforming resource companies, was the single most valuable underweight call by QOZ after it declined materially over the year.
The main cost of the strategy was CBA, structurally underweighted in QOZ as the world’s most expensive bankv, yet despite this it continued to outperform throughout the year.
Promisingly, eight of the top ten active positions drove outperformance.
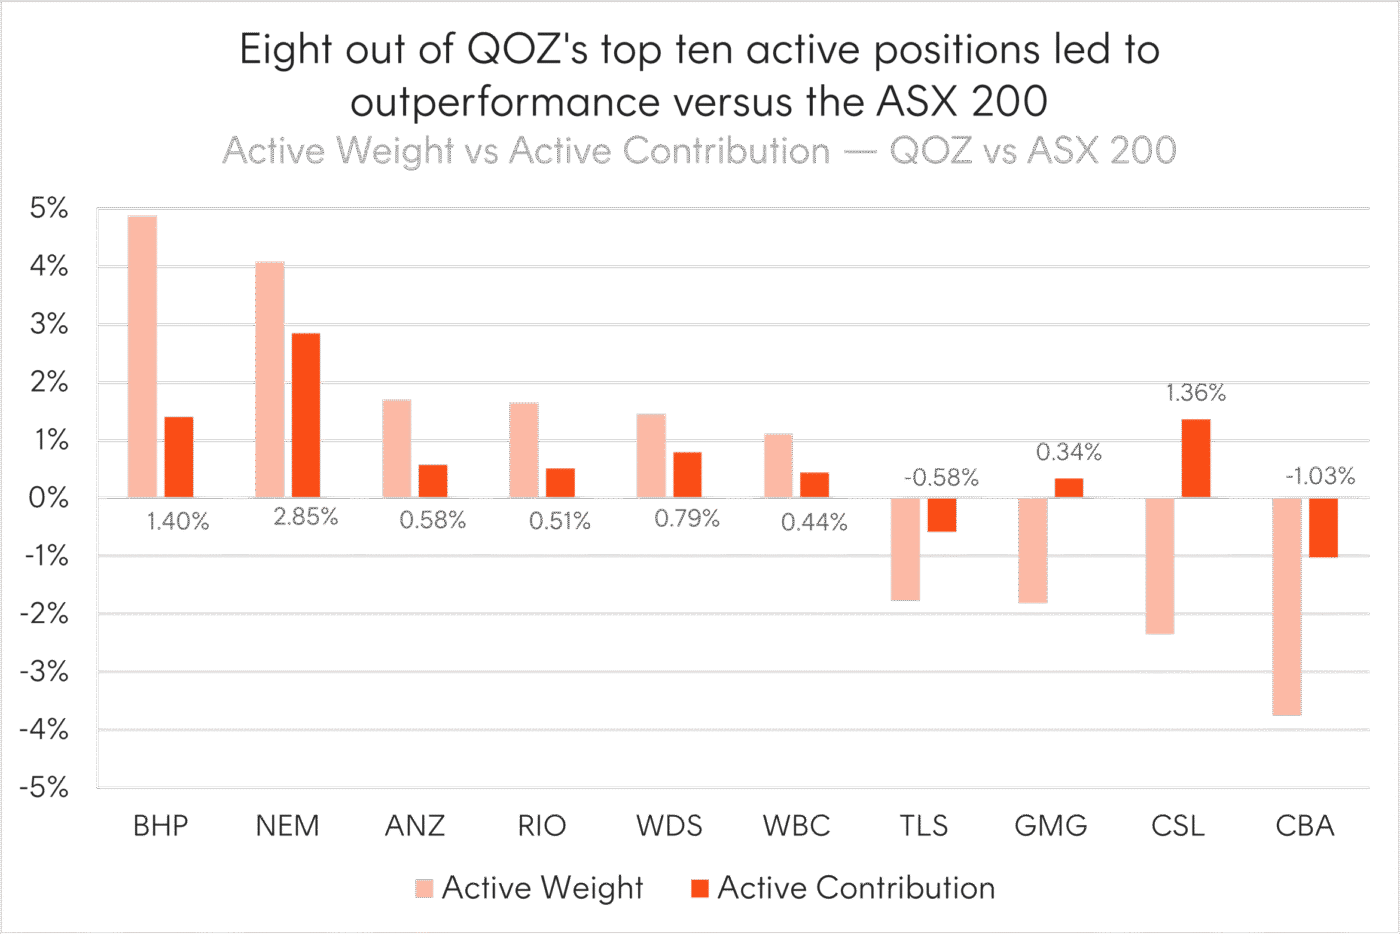
Source: Bloomberg. 21 March 2025 to 20 March 2026. QOZ active weight and contribution attribution relative to the S&P/ASX 200. Past performance is not an indicator of future performance. You cannot invest directly in an index.
At a sector level, all but utilities and consumer staples contributed positively to active return. Both sector positioning, being overweight outperforming sectors and underweight underperforming ones (allocation effect), and the re-weighting of stocks within sectors (selection effect) contributed to outperformance across most sectors.
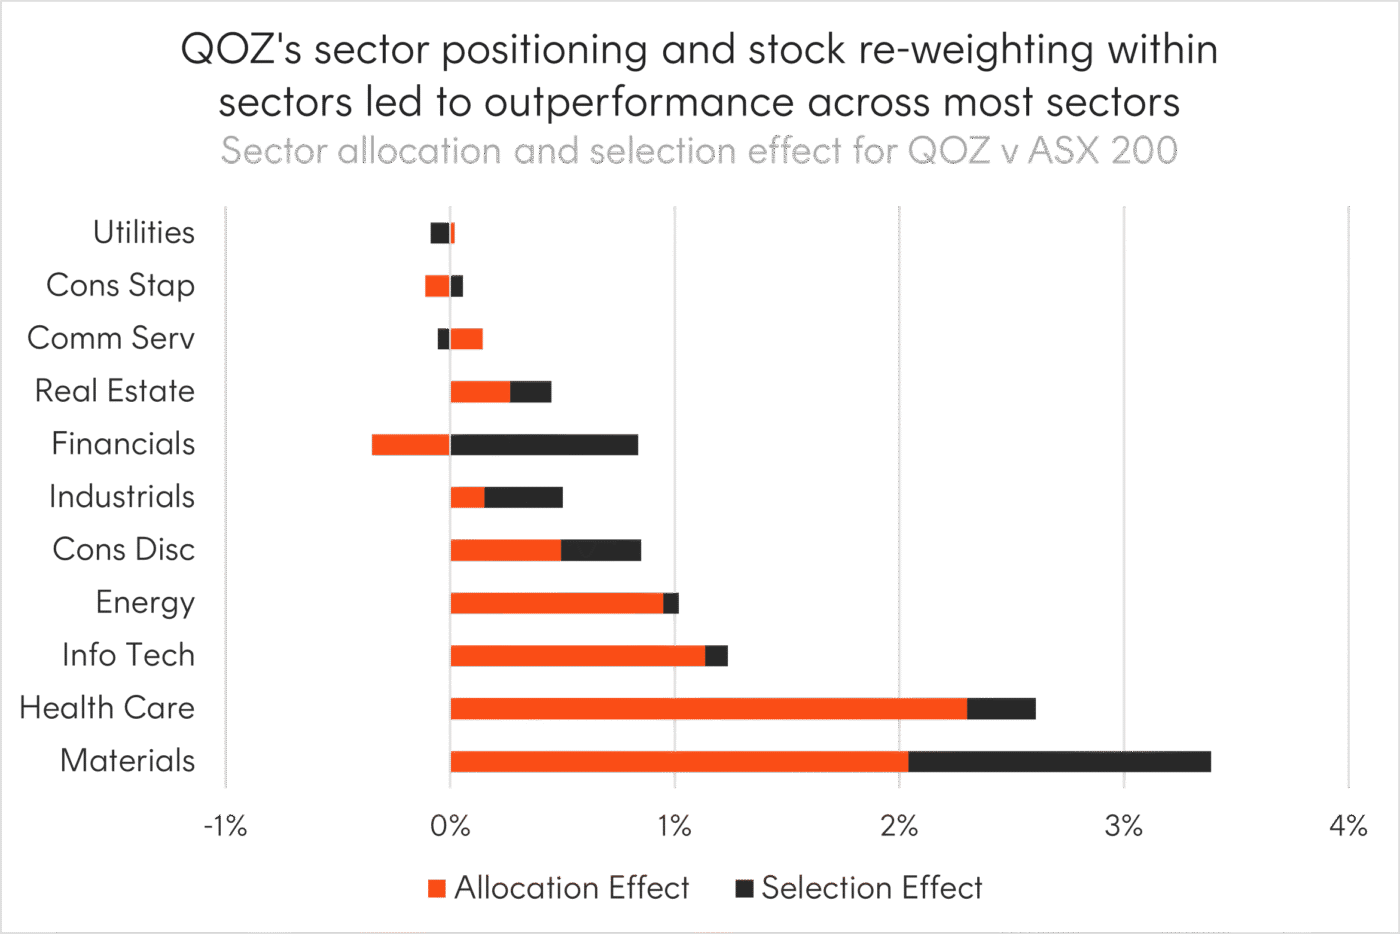
Source: Bloomberg, Betashares. 21 March 2025 to 20 March 2026. QOZ sector attribution relative to the S&P/ASX 200. Past performance is not an indicator of future performance. You cannot invest directly in an index.
Materials trimmed, energy now the biggest overweight position
In this year’s rebalance, on 20 March 2026, materials saw the largest sector change, trimmed by 9% after the sector rallied 28% over the past 12 monthsvi. A clear example of QOZ’s methodology in action, taking profits and reducing exposure to recent outperformers.
Energy is now the largest sector overweight, a positioning that appears timely given recent developments in global energy markets.
Overall positioning is now more market-neutral at a sector level compared to prior years, although meaningful active weights remain at the individual stock level.
BHP and CBA remain the largest overweight and underweight positions, respectively, at the single-stock level. CSL, historically a prominent active weight, is now only a modest underweight (~0.3%) following its recent sell-off.
On a relative proportional basis, there are notable tilts toward energy names, including Ampol, Woodside, and Santos.
Investment implications
QOZ seeks to rebalance its portfolio each year to benefit from market mispricings. While cheap stocks can become cheaper and more expensive stocks more expensive over time prices typically mean revert to fundamentals. QOZ dynamically reweights 200 companies on the ASX aiming to benefit from each stocks relative repricing throughout the cycle.
QOZ is used as a core building block in Betashares Dynamic Managed Accounts blended with other select Australian smart beta ETFs with the aim of outperforming the broader market and improving risk adjusted returns.
You can find more information about QOZ on the fund page here.
There are risks associated with an investment in QOZ, including market risk, security specific risk and sector concentration risk. Investment value can go up and down. An investment in the Fund should only be considered as a part of a broader portfolio, taking into account your client’s particular circumstances, including your tolerance for risk. For more information on risks and other features of the Fund, please see the Product Disclosure Statement and Target Market Determination, both available on this website.
No assurance is given that any of the companies in QOZ’s portfolio will remain in the portfolio or will be profitable investments. Past performacne is not indicative of future performance.
Any information provided is not a recommendation or offer to make any investment or to adopt any particular investment strategy. Financial advisers should make their own professional assessment of the suitability of such information, relying on your own inquiries.
Sources:
1. Bloomberg. As at 21 March 2026. Rebalance period between 21 March 2025 and 20 March 2026. QOZ was incepted on 10 July 2013. Performance figures are actual fund returns net of QOZ’s management fees and costs of 0.40% p.a. Past performance is not an indicator of future performance.
2. Bloomberg. As at 21 March 2026. Rebalance period between 21 March 2025 and 20 March 2026. QOZ was incepted on 10 July 2013. Performance figures are actual fund returns net of QOZ’s management fees and costs of 0.40% p.a..Past performance is not an indicator of future performance.
3. Bloomberg. 21 March 2025 to 20 March 2026. Past performance is not an indicator of future performance.
4. Bloomberg. 21 March 2025 to 20 March 2026. Relative to the ASX 200. Past performance is not an indicator of future performance. You cannot invest directly in an index.
5. Bloomberg. As at 31 March 2025. Based on CBA’s price-to-book ratio relative to major global banks.
6. Bloomberg. 21 March 2025 to 20 March 2026. Past performance is not an indicator of future performance. You cannot invest directly in an index.
1 comment on this
Hi
Please email through a Lonsec report on QOZ.
Thanks