
Tom Wickenden
13 minutes reading time
Key takeaways:
- While the short-term impacts of the Iran war still threaten to be significant it may be the longer-term implications to energy security and national self sufficiency that matter most for investors.
- Investors fears about big tech data centre spending and software displacement are at odds with one another as spend on data centres looks more justified and AI monetisation ramps up.
- We believe the RBA’s two hikes in Q1 reinforce three key trends in Australian equities: the rotation toward income and value investment styles, pressure on sectors sensitive to interest rate changes, and the materials and energy inflation impulse also spurring earnings growth.
Last quarter we unpacked why the AI rally was on notice, discussed the outperformance of markets outside the US heading into 2026 and explored the implications of the expected divergence in central bank policy.
In Q1 of 2026 these themes have evolved significantly. Questions around the AI rally shifted from concerns of overspending to fears of disruption, ex-US outperformance gathered speed before the Iran war reversed those gains, and persistent inflation coupled with an expected energy price shock from the Iran conflict saw the RBA hike rates twice during the quarter.
Considering how captive markets have been to the ever-changing news flow, the sell-off in March was orderly. Volatility remains far from extreme and markets could be poised for a rebound on any signs of deescalation between the US and Iran. The “buy the dip” mentality remains intact.
3 Things we learned
Iran war, the long and the short of it
In the first two months of Q1, markets followed the playbook. Developed ex-US and emerging market equities were outperforming with a strong global growth outlook and a weakening US dollar. Gold was trading above US$5,000 an ounce for the first time while US indices were treading water on AI jitters.
Then, on the last day in February, the US invaded Iran and began a war that remained ongoing as of the end of Q1. What Trump may have hoped would be a swift operation, toppling the existing leadership and spurring protesters to install a new government, has instead become his trickiest geopolitical entanglement yet. Equity markets pared their early year gains to be trading down across the world over the past month.
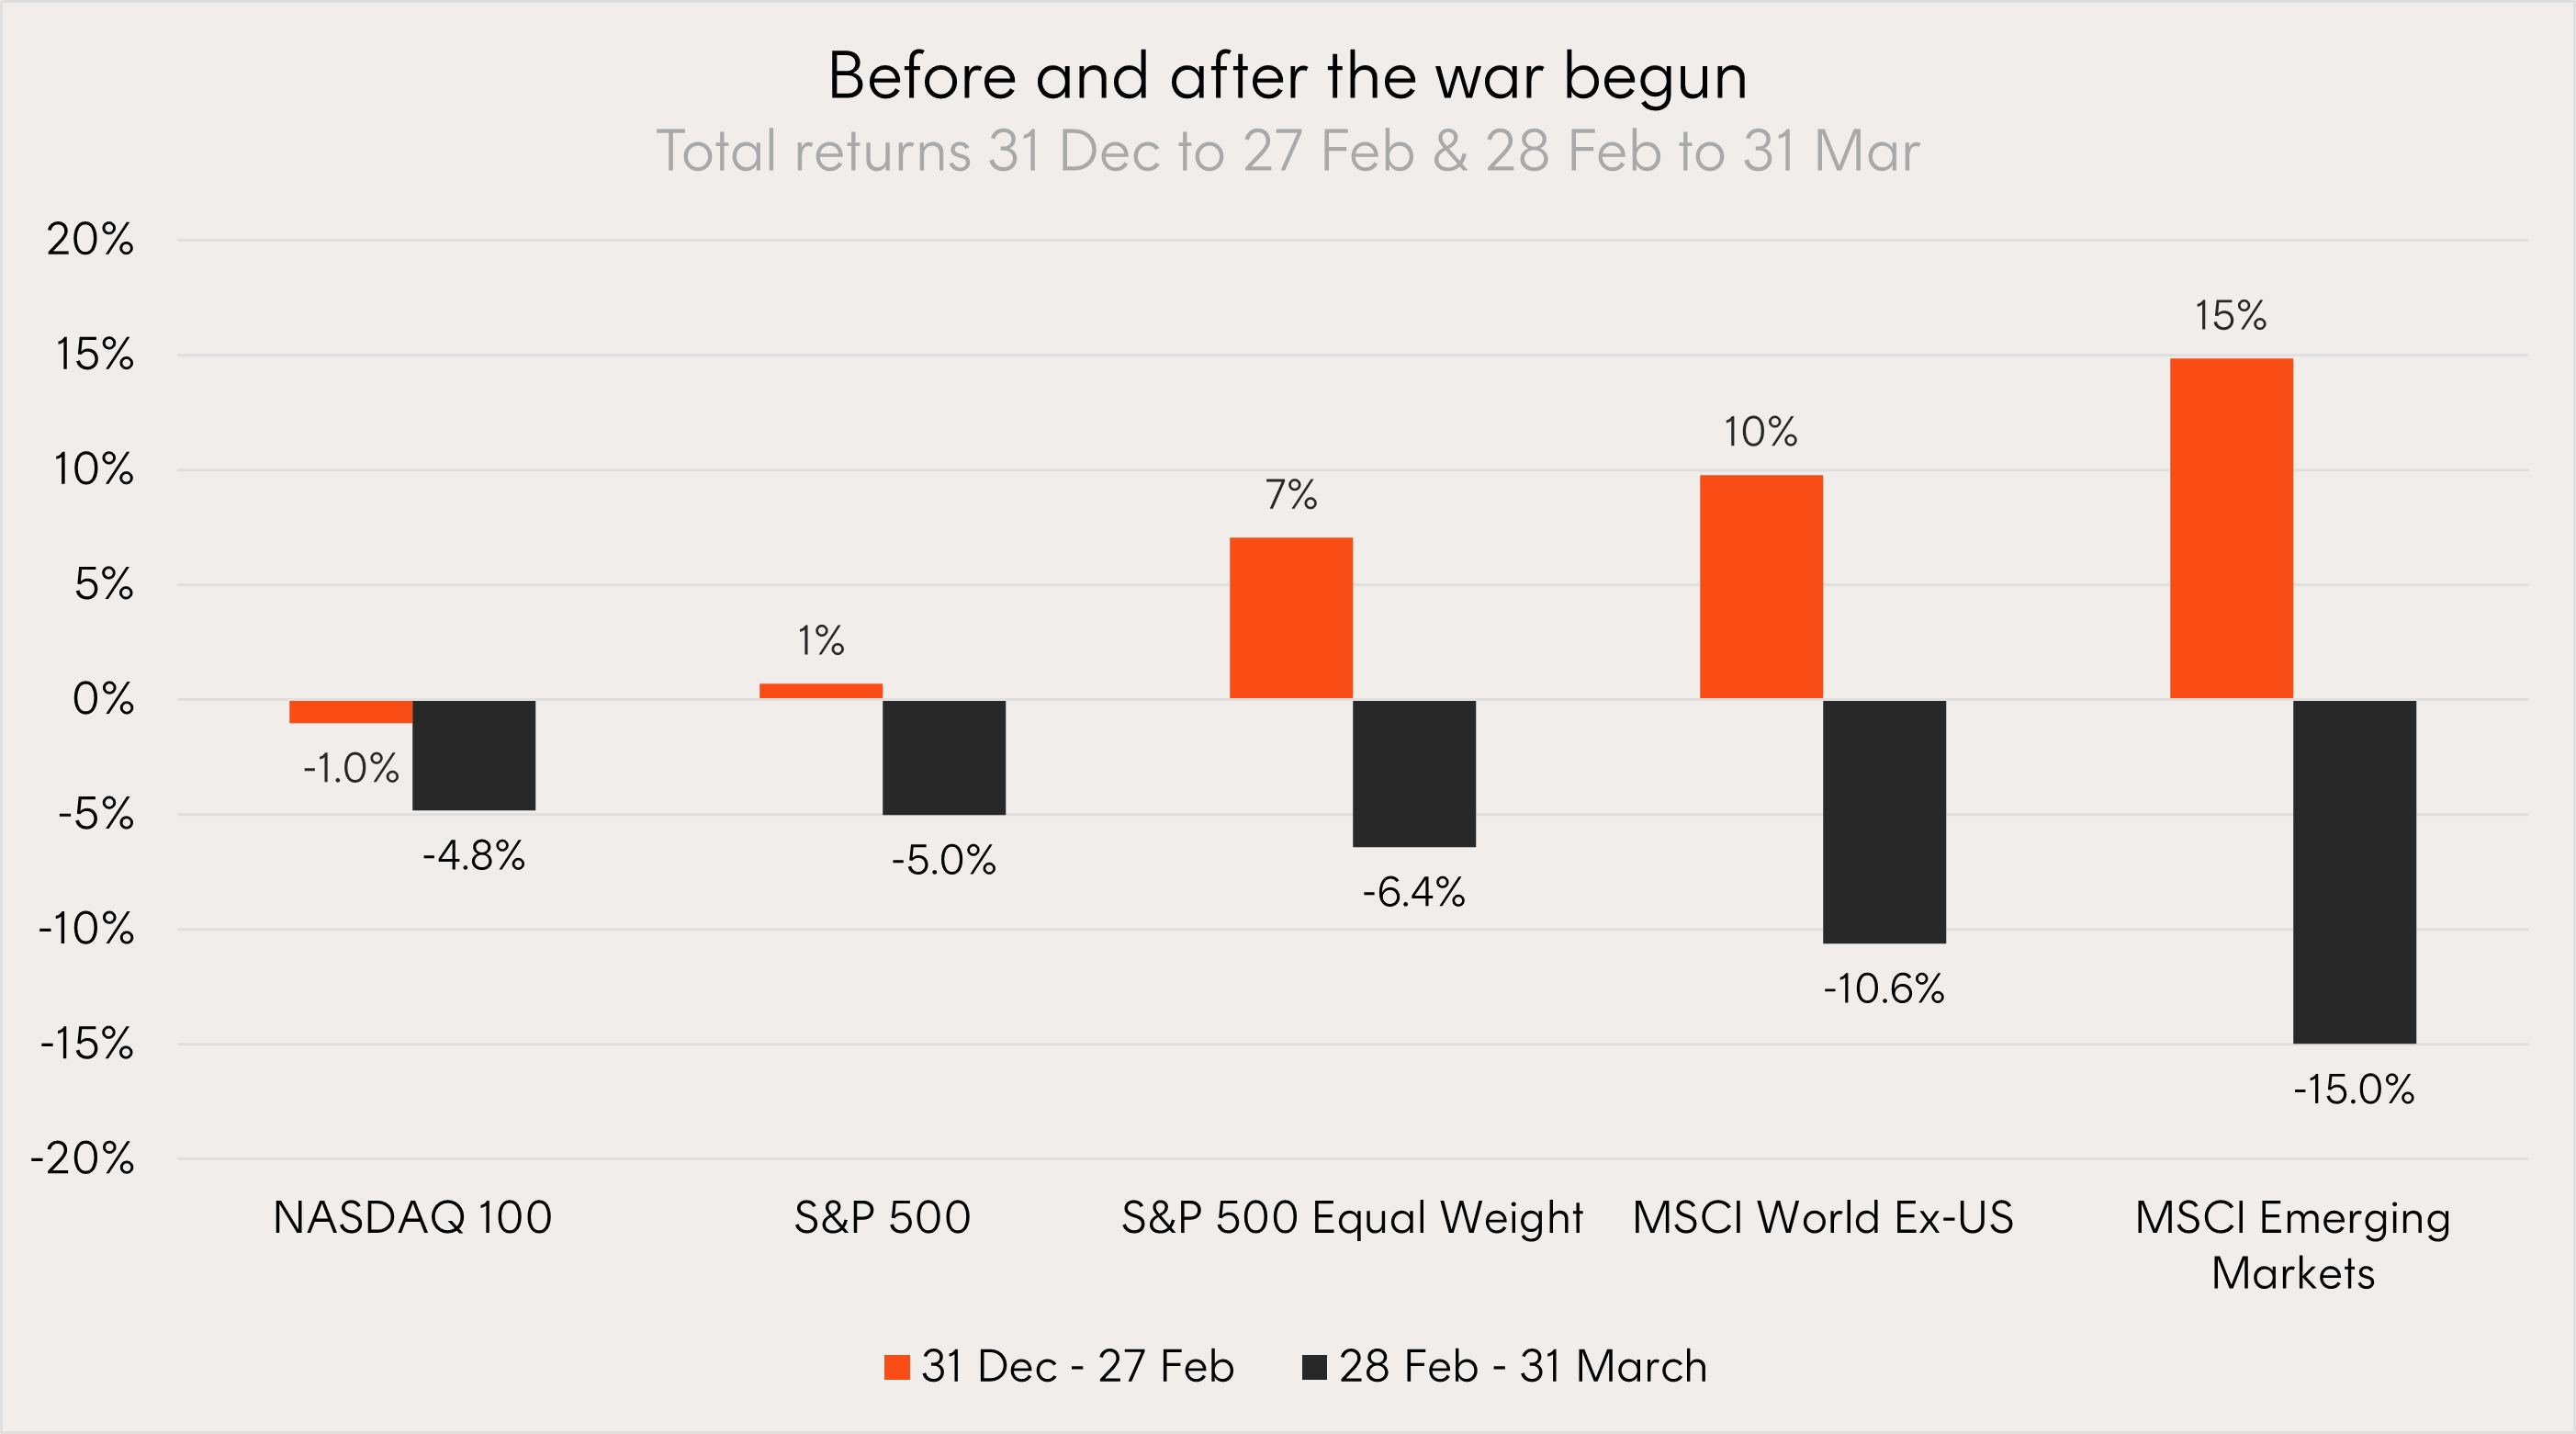
Source: Bloomberg. Total returns of select indices between 31 December to 27 February and 28 February to 31 March. You cannot invest directly in an index. Past performance is not an indicator of future performance. Short-term performance can be volatile and is not a reliable guide to future returns.
Four weeks into the war, the same Iranian leadership remains in charge, global oil supply is severely disrupted, and Trump has been lashing out on Truth Social against enemies and allies alike. It is increasingly clear that Trump wants a clean off-ramp – but the Iranian regime’s current ceasefire terms would leave it in a stronger position than before the war, physical destruction notwithstanding.
The short-term threat is the hit to global growth and inflationary pressure from higher oil prices. Given the recency of the shock, its impact will only show up in hard economic data with a lag, but anecdotally, signs of disruption are mounting. Across Asia, a range of novel approaches are being trialled to reduce petrol and LNG consumption – from driving restrictions to encouraging workers to dress in T-shirts and cut back on air-conditioning. Meanwhile higher petrol prices and flight cancellations are now a reality in developed market countries. In short, the longer the war runs, the greater the risk of global recession. Our base case assumption remains a timely de-escalation without a severe shock to the global economy.
But it may be the longer-term implications that matter most for investors, long after any resolution in Iran. Russia’s invasion of Ukraine accelerated defence spending and European energy diversification. The Iran conflict is now doing the same for global energy self-sufficiency while further fracturing the US security umbrella and embedding geopolitics as a structural driver of asset prices, rather than an episodic risk to be faded.
As a consequence, Investors may be looking to, sectors such as energy producers, uranium, defence, critical minerals, and agricultural inputs going forward.
Investors AI conundrum
There is a growing contradiction in the AI narrative: investors’ fears about big tech companies over-investing in AI infrastructure on one hand, and software displacement on the other, are at odds with one another.
Heading into 2026, the market’s focus was whether a handful of companies commanding a large share of global equity markets – Microsoft, Alphabet, Amazon, and Apple – could sustain the enormous capital expenditure planned for data centres and AI model infrastructure.
However, in Q1, as the prominence of AI tools grew, most notably those announced and released in Anthropic’s Claude, investors instead began to question which companies would be displaced first, starting with a US$1.5 trillion sell-off in software companies1. Broad US equity indices have been largely unscathed from the sell-off helped by the diversification between hardware winners and software losers.
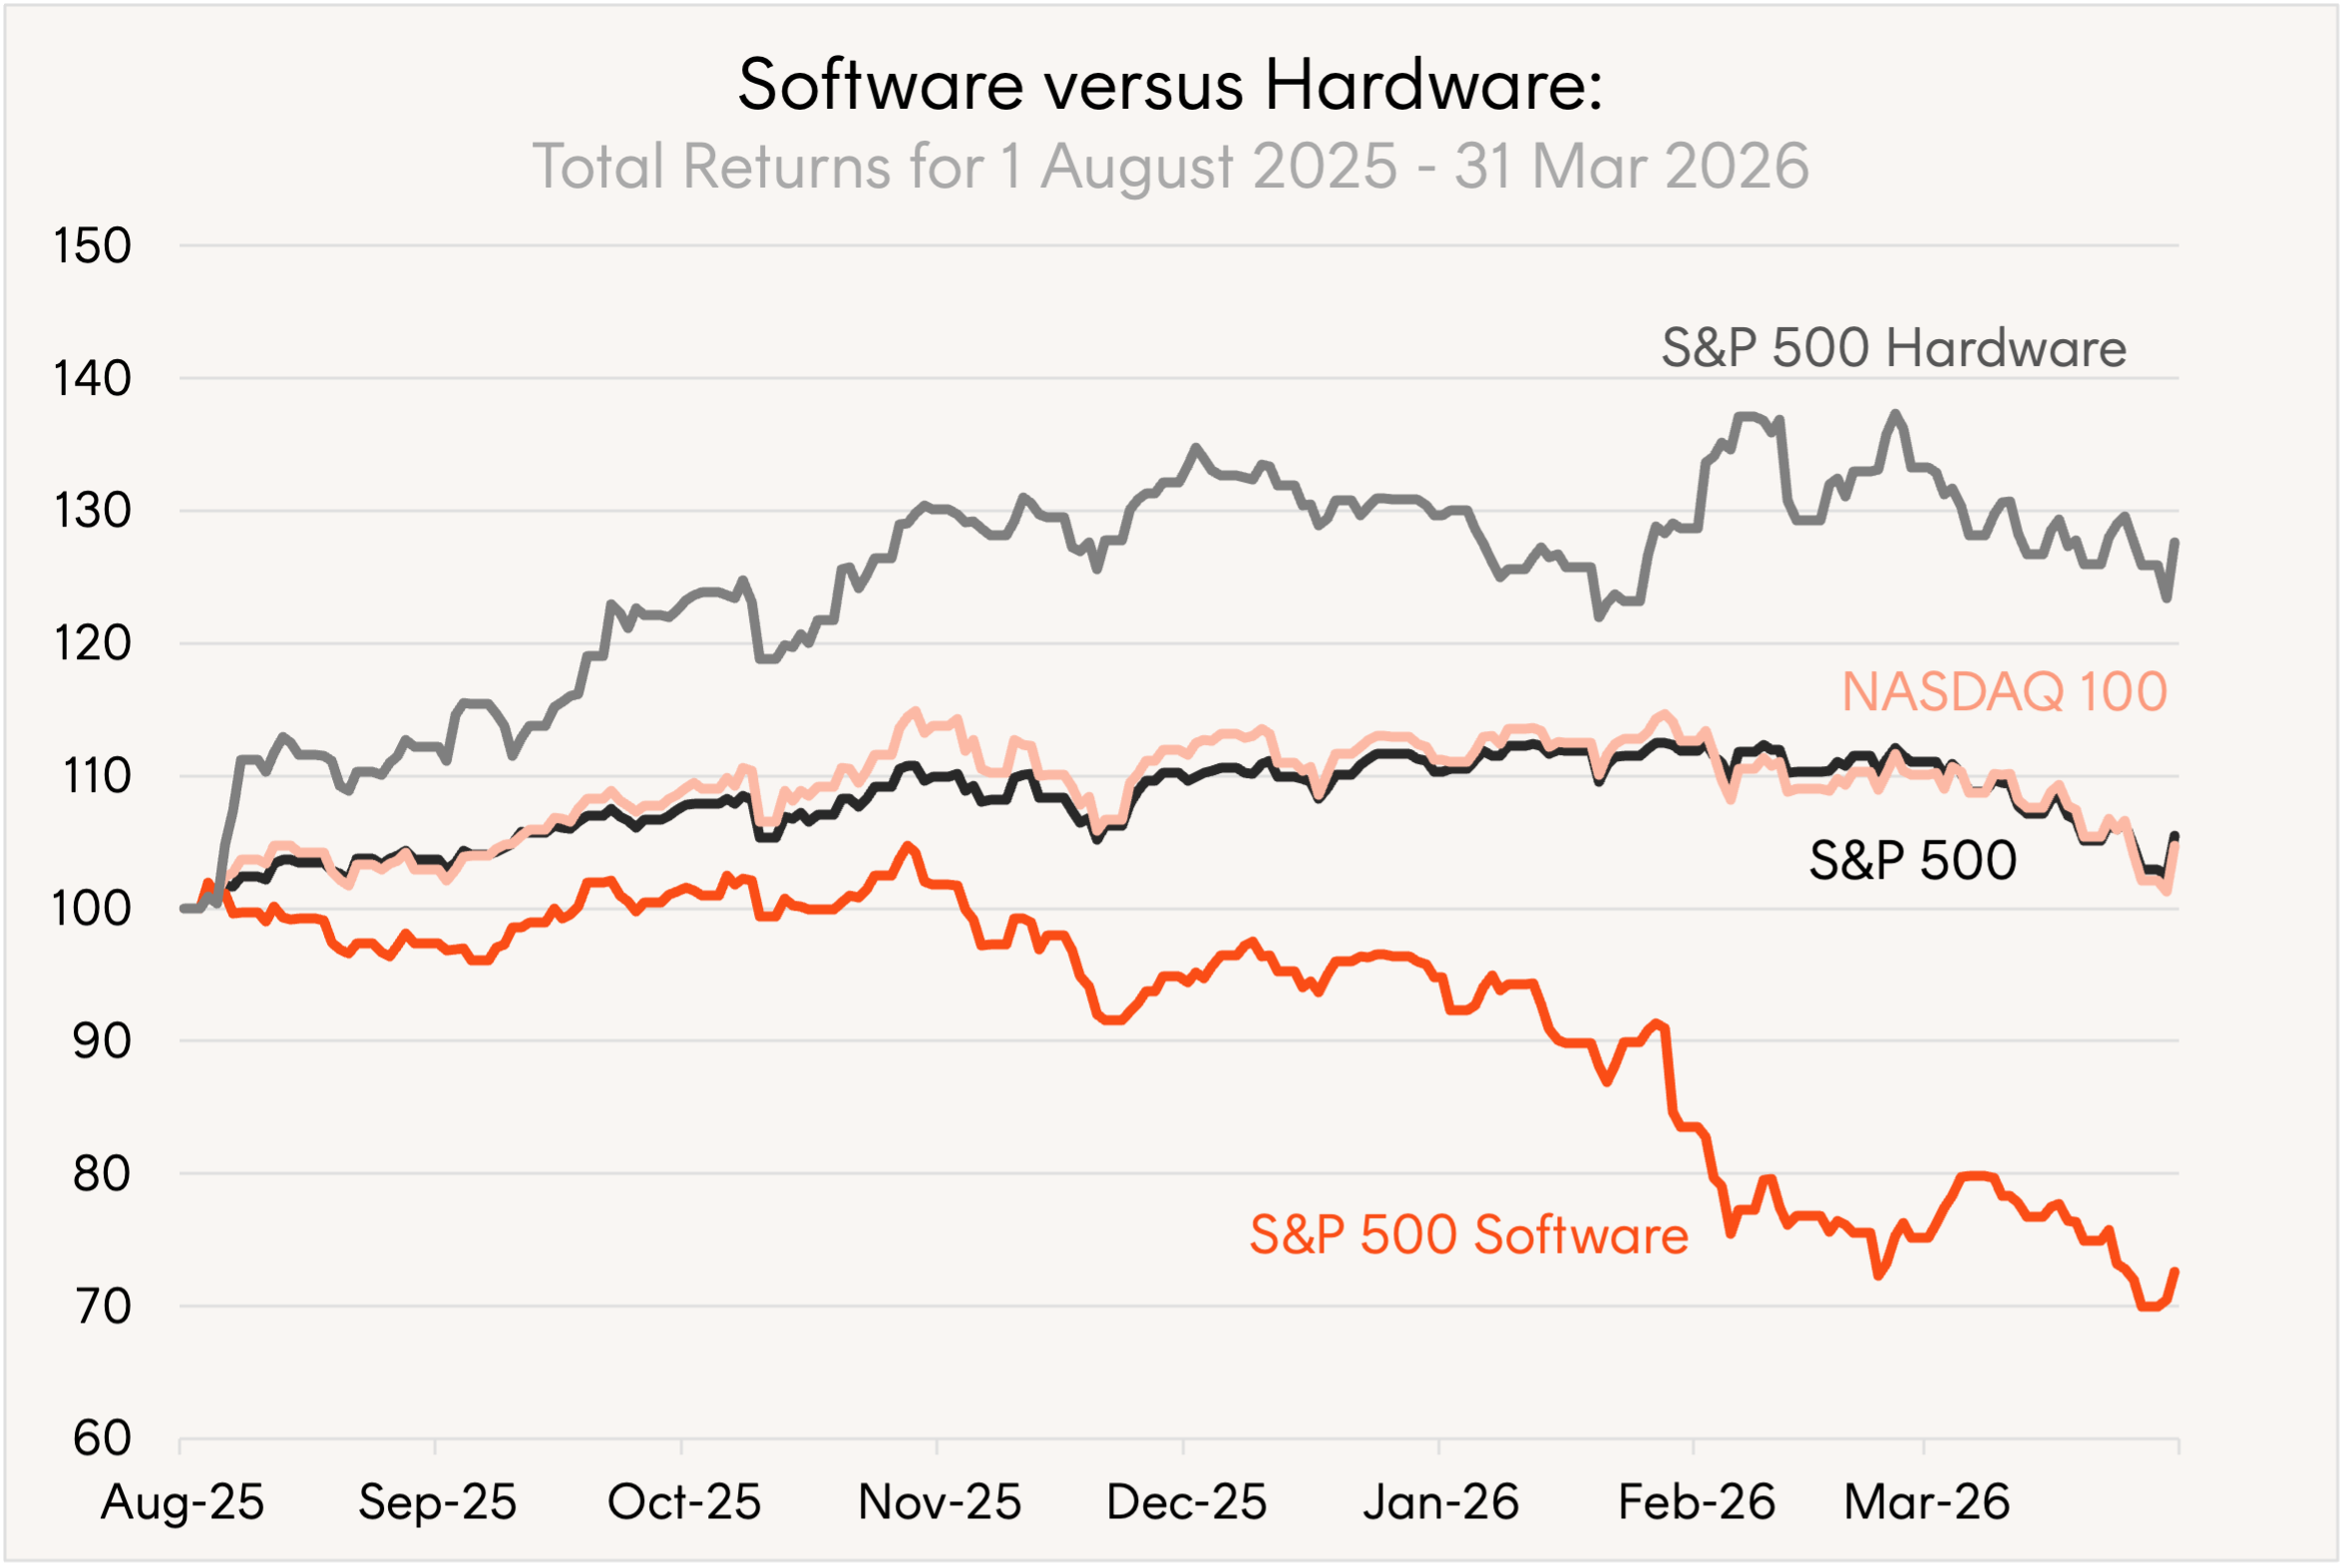
Source: Bloomberg, 1 August 2025 to 31 March 2026. S&P 500 Software and S&P 500 Hardware are industry sub-groups within the S&P 500. You cannot invest in an index. Past performance is not an indicator of future performance. Short-term performance can be volatile and is not a reliable guide to future returns.
These two fears are difficult to hold simultaneously. If AI adoption is rapid and pervasive enough to threaten the business models of the world’s largest software companies, the compute required to do that work is enormous and the technology is valuable.
Microsoft has reported that demand for Azure capacity exceeds supply2. AWS has said the same3. The hyperscaler spending on data centres is looking justified.
Of course, a significant portion of capex spending is going toward creating the leading AI model. This is where uncertainty, and justified fear, remains. If a winner takes all model emerges, other competitors may struggle to generate a sufficient return on their own massive investments.
Meanwhile, AI monetisation is already ramping up, even as providers subsidise usage to capture market share. Anthropic reported annualised revenue surpassing US$30bn in 2026 (the pace of revenue if current trends continued for a full year), up from US$9bn at the end of 2025. The number of business customers spending over US$1m on an annualised basis doubled in less than two months, from 500 to 10004. These gains come as businesses are deploying AI tools cheaply and building reliance on them. When that reliance is deep and switching costs are high, pricing power will increase even further.
The RBA’s long and winding path to neutral
The quarter began with markets expecting the Reserve Bank of Australia to hold rates steady through the first quarter of 2026. It ended with two hikes delivered, most of the interest rate cuts from 2025 reversed, and all four major banks (as well as Betashares’ Chief Economist, David Bassanese) forecasting a third move in May5.
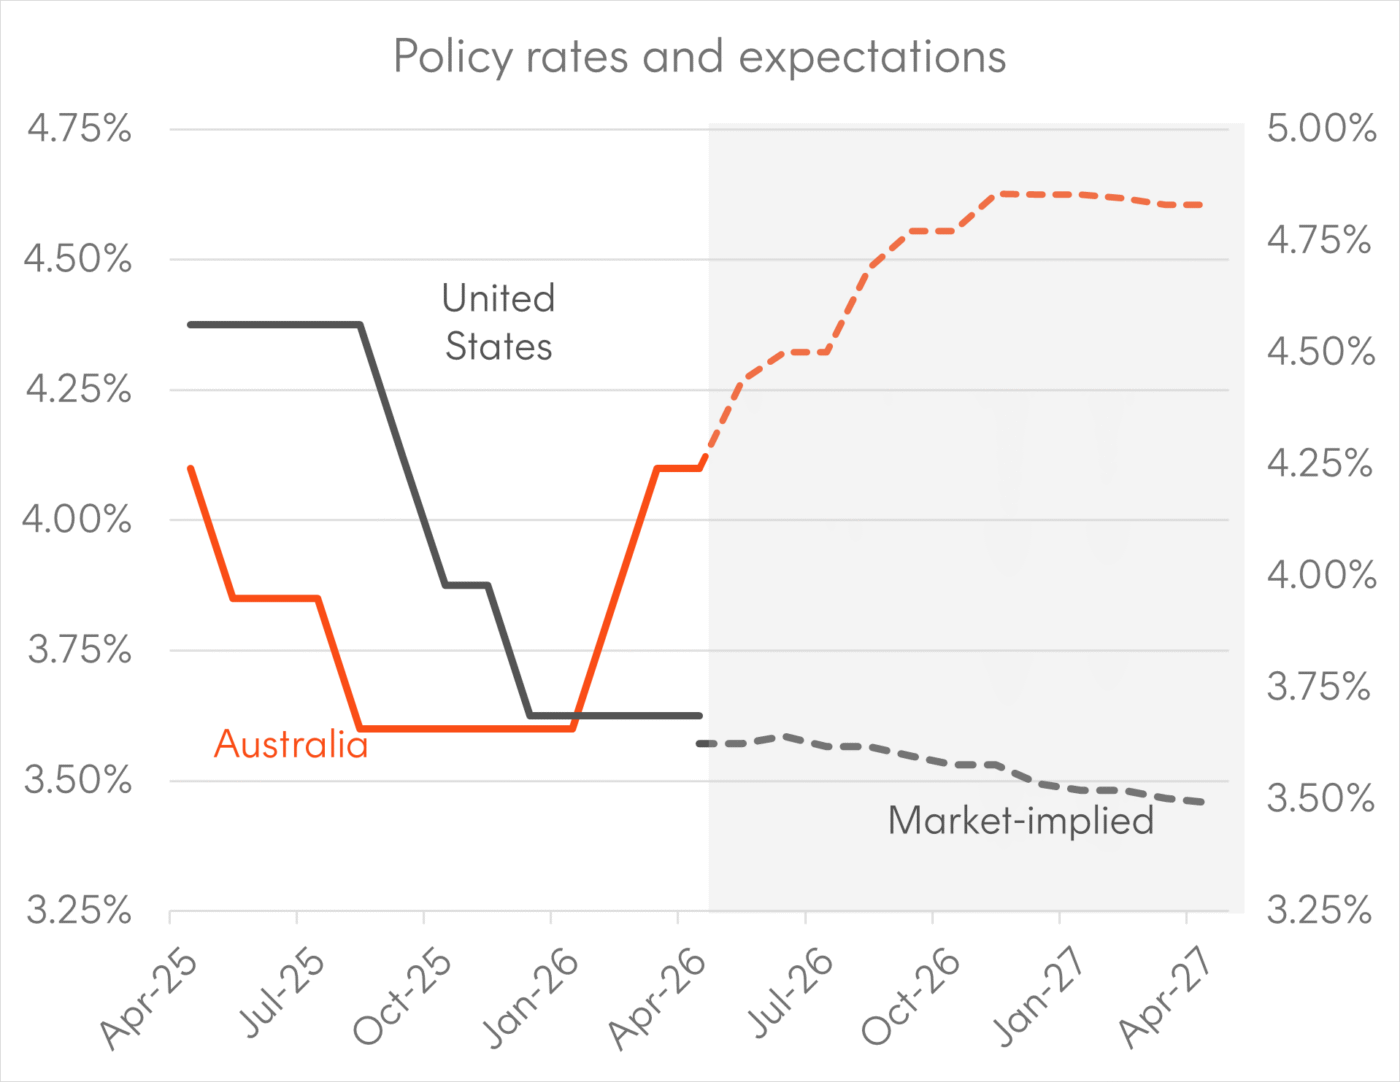
Source: Bloomberg. As at 31 March 2026.
After cutting three times in 2025, the RBA entered 2026 facing:
- Q4 GDP reported at 2.6% annually, above the economy’s estimated 2% limit.
- Trimmed mean inflation (an underlying inflation measure that strips out the most extreme price movements to give a clearer read on inflation trends) rising to 3.4% year-on-year, above the top of the 2–3% target band.
- Unemployment holding at 4.1%, historically low and tighter than the RBA had forecast.
These dynamics led the RBA to hike interest rates in February, the first hike since November 2023. Notably, the meeting’s statement projected inflation would not return to the midpoint of the target band until 2028. Six weeks later the Board hiked a second time to 4.10%, this time in a 5-4 vote. In her press conference, Governor Bullock stated all 9 members agreed a hike was needed but differed on the timing, while stating the war in the Middle East has complicated the decision but not caused it.
In the same week as the second RBA hike the Fed, European Central Bank, Bank of England and Bank of Japan left rates unchanged as the Middle East conflict clouded the growth outlook. Australia entered Q2 as the only major developed market central bank actively tightening (Japan the other outlier on its own path toward more normal interest rate levels).
For Australian equities these hikes reinforce three key trends:
- The rotation toward income and value that has been building since late 2025 is now structurally supported. Higher rates in Australia reward companies with predictable cash flows, strong dividend yields, and low debt levels.
- Rate-sensitive sectors face a more difficult 2026 than most entered the year expecting. This has most notably impacted the local technology market.
- The same commodity shock that has complicated the RBA’s path is generating meaningful earnings upgrades across the resources and materials sector. Energy names are direct beneficiaries of elevated oil. The broader critical minerals complex is seeing accelerating strategic interest. Iron ore has rebounded back above US$100 per tonne.
2 Charts we’re watching
Defence contractor order books grow by US$100bn
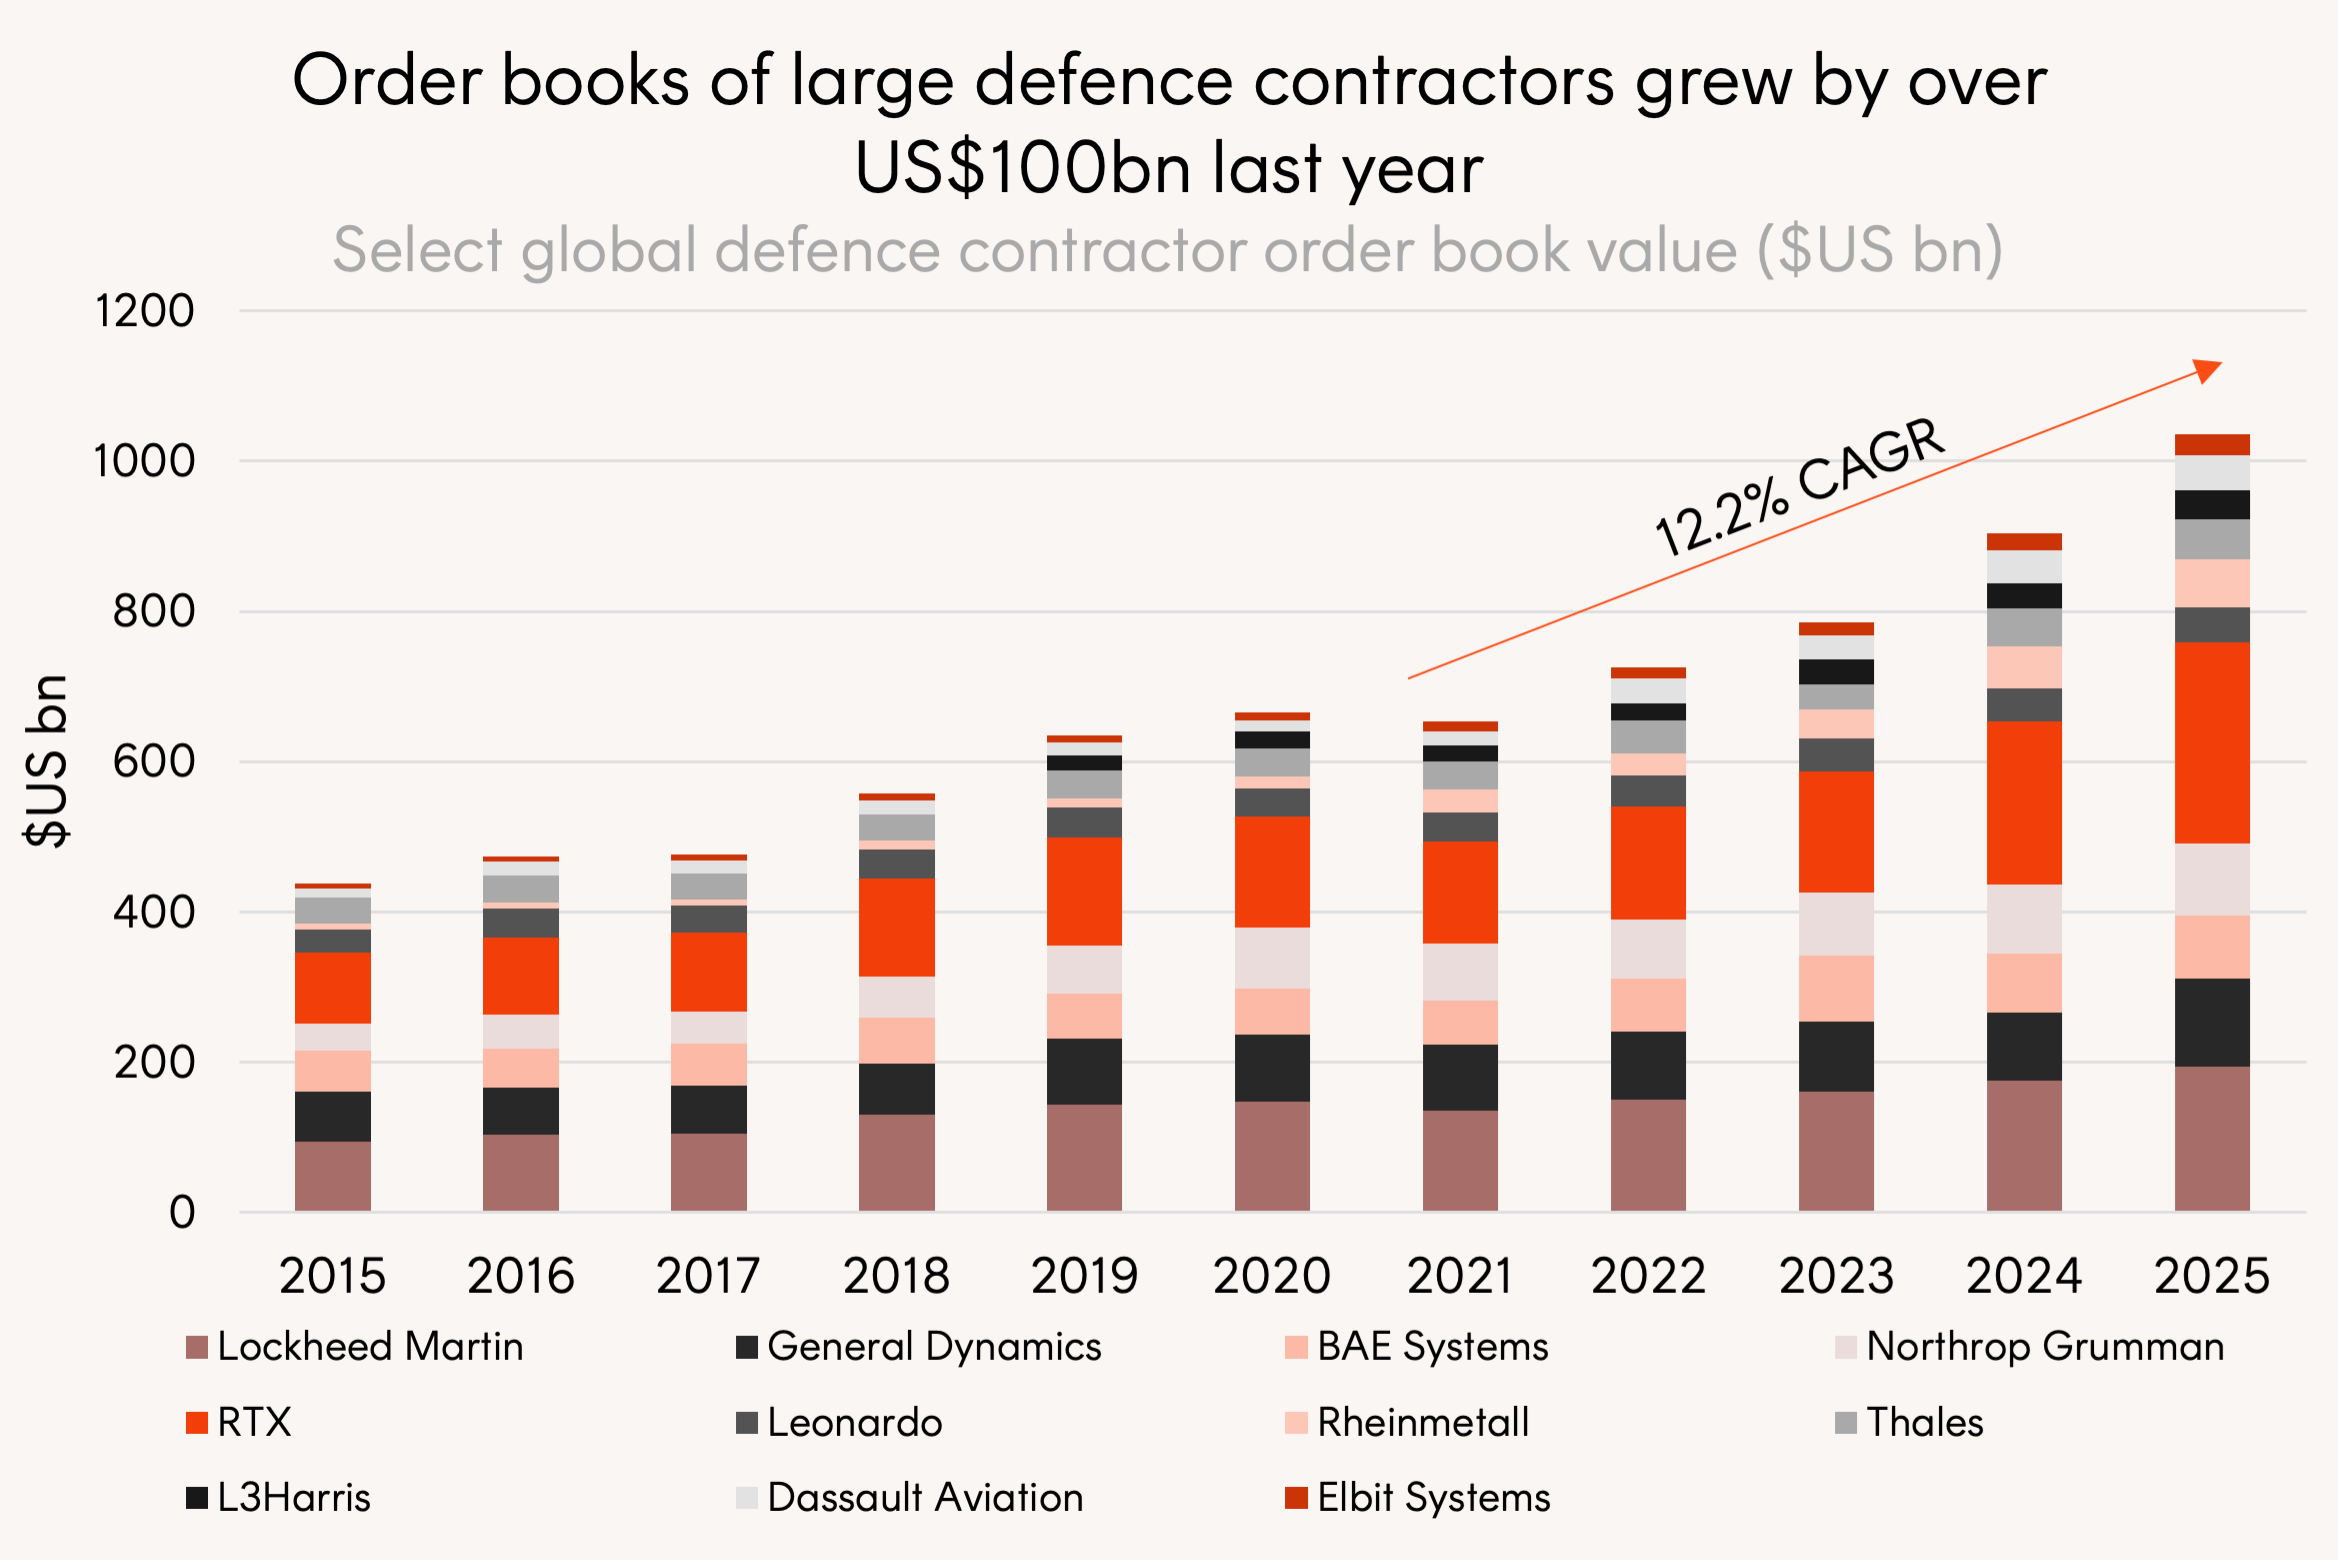
Source: Bloomberg, Betashares. Backlog order book value of select global defence contractors 2015 to 2025.
For the second year in a row, major defence contractors saw their order books grow by over US$100bn. Record levels of contracted future orders are traditionally a leading indicator of earnings growth, which is expected to accelerate further in 2026 as the US replenishes arms depleted during the Iran war. The defence contractor order books we track have collectively exceeded US$1 trillion for the first time in history 6.
The global defence sector7 has been among the best performing since Trump’s inauguration, offering direct exposure to rising geopolitical tension. The sector’s performance peaked in mid-January, before the Iran war began, and has since pulled back. This plateau comes as the US administration released a FY27 budget proposal that calls for ~US$1.5 trillion in national defence spending – a 44% year on year increase representing the largest in history.
Australian high yield and value factors outperform in volatile markets
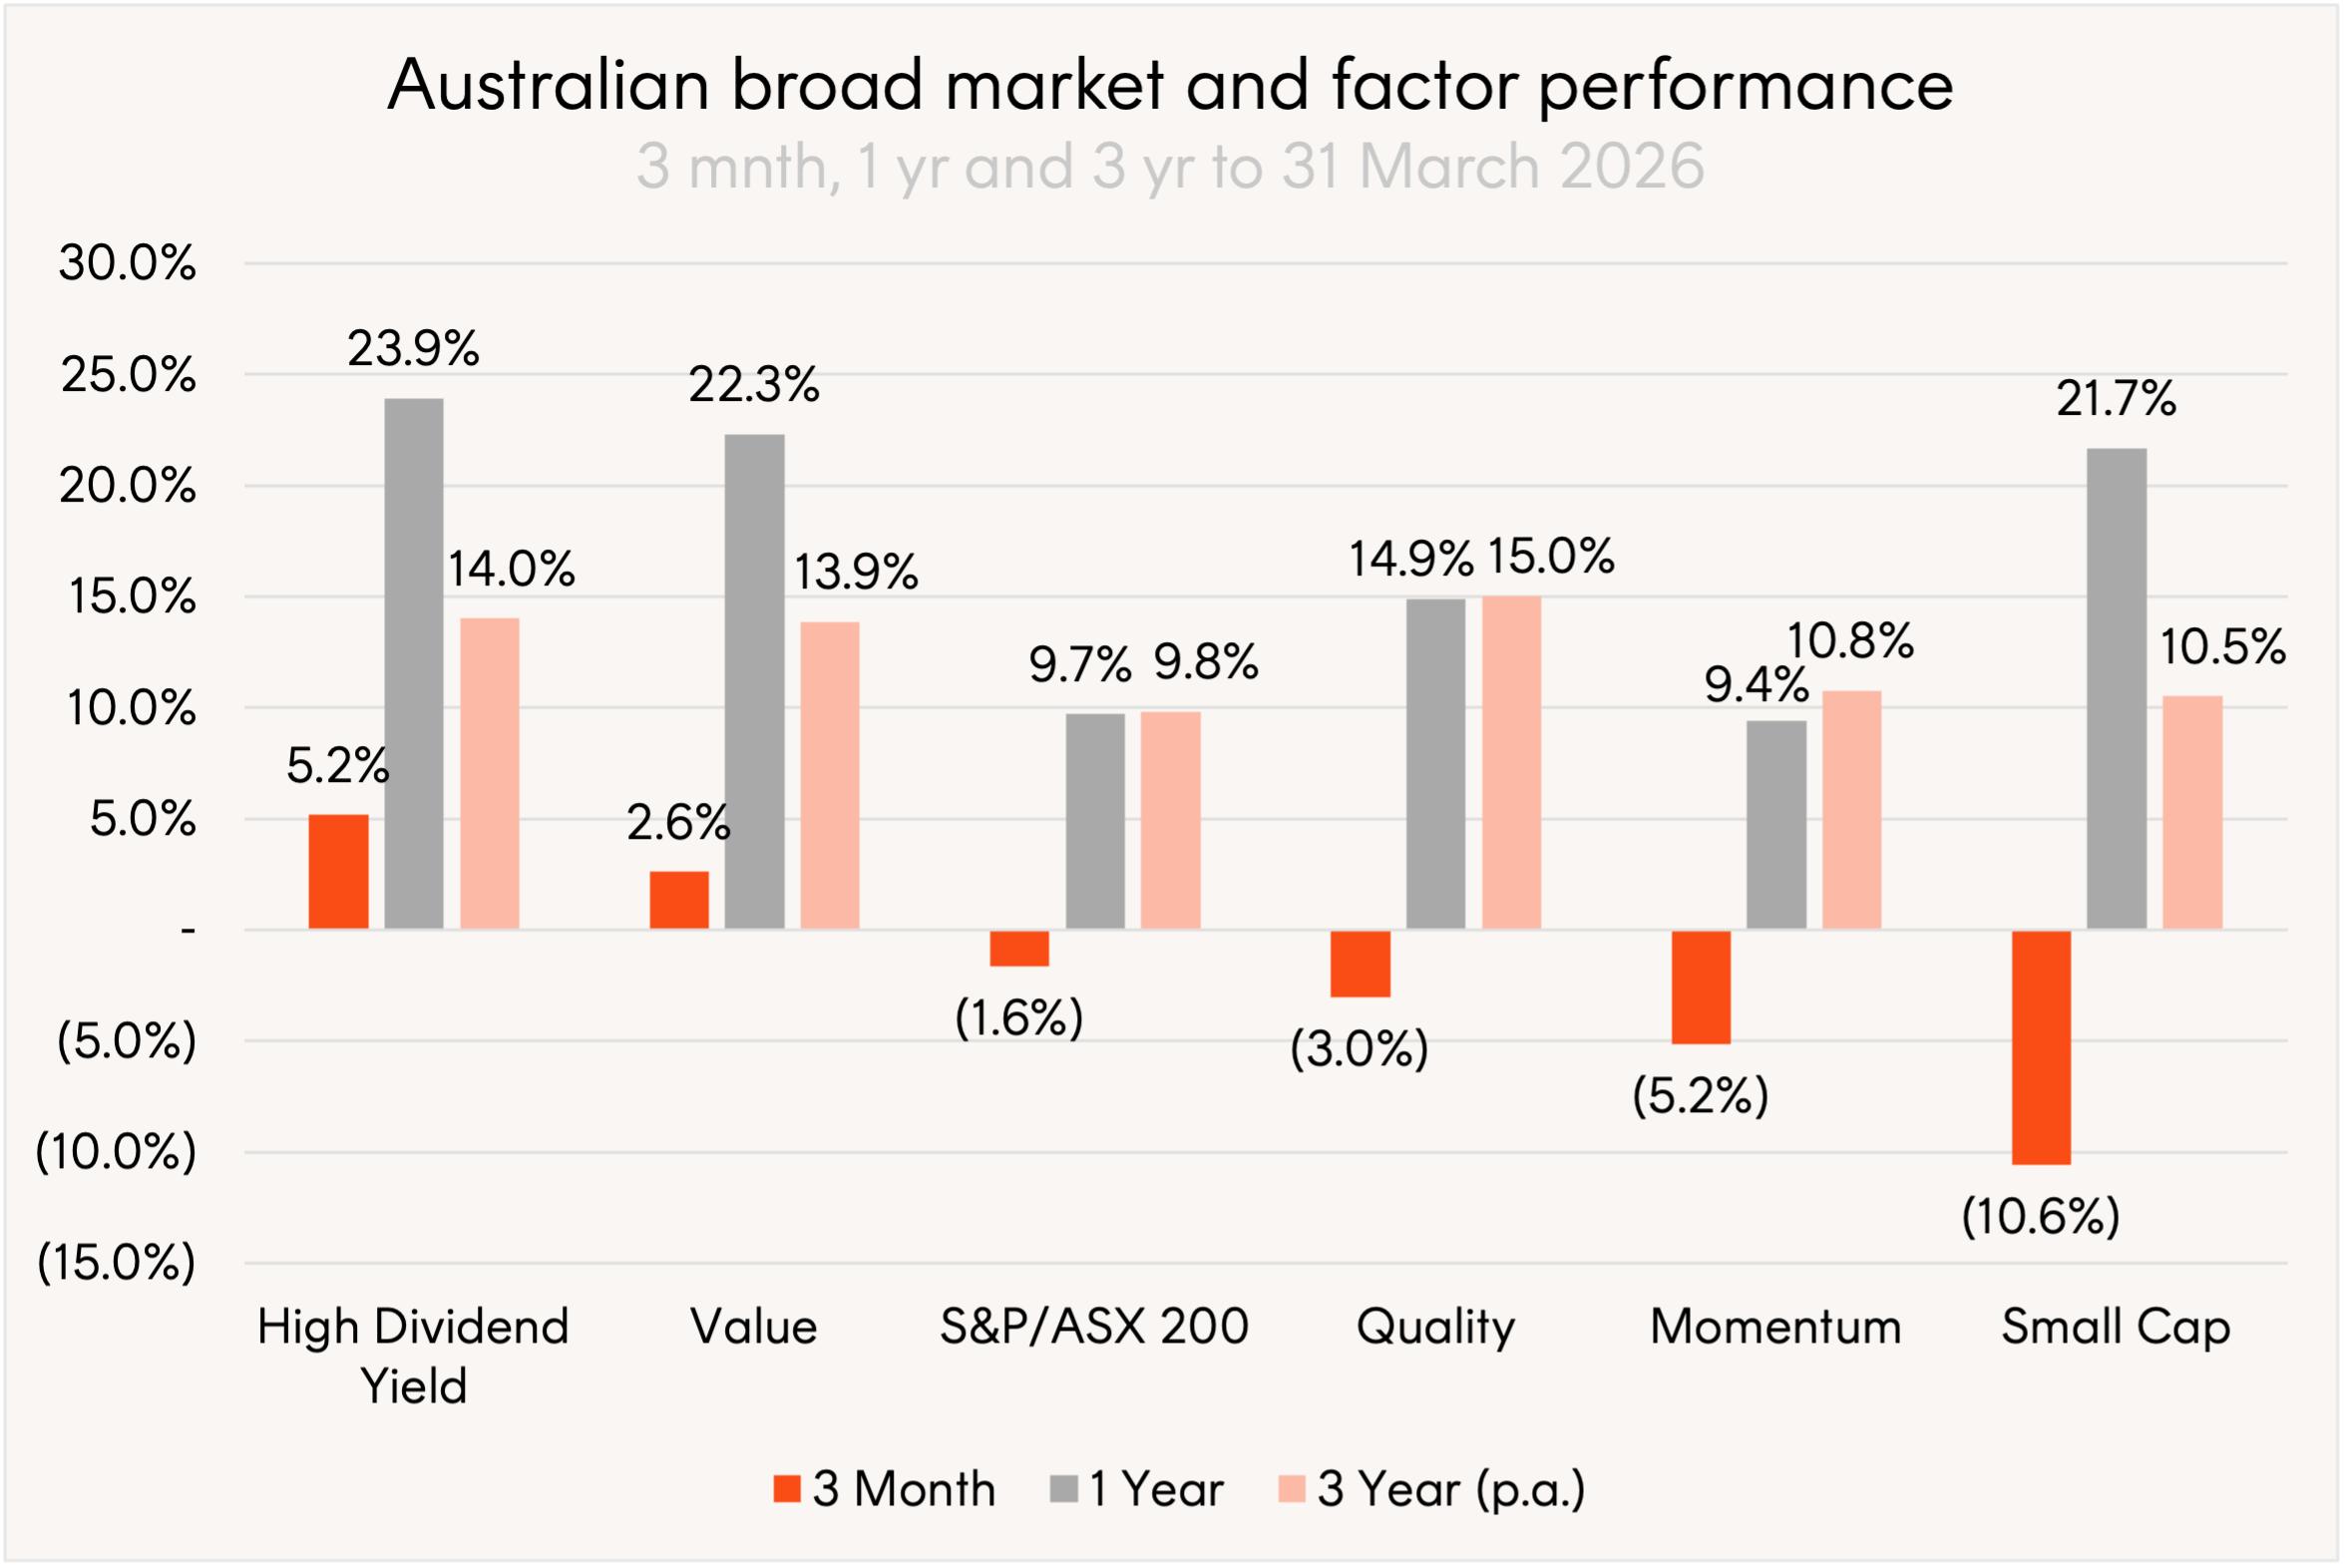
Source: Bloomberg, Betashares. 31 March 2023 to 31 March 2026. Quality: Solactive Australia Quality Select (SOLAUQST); High Dividend Yield: S&P/ASX 200 High Yield Select Index (SPATHYAT); Value: FTSE RAFI Australia 200 (TFRAU200); Momentum: Solactive Australia Momentum (SOLAUMST); Small Cap: Nasdaq Australia Small Cap Select (AUSCSGL); S&P/ASX 200: S&P/ASX 200 Total Return Index (ASA51). Past performance is not an indicator of future performance. You cannot invest directly in an index.
The high yield and value factors have outperformed the broader Australian market over the past year as investors rotated toward predictable cash flows and away from growth. The shift reflects converging forces that defined Q1: AI disruption threatening software earnings, two RBA rate hikes rewarding low-leverage and high-dividend businesses, geopolitical uncertainty driving demand for defensive allocations, and related commodity price rallies spurring the materials sector.
For a detailed breakdown of Australian factor performance see Betashares factor dashboard here.
1 Question remaining
What does an end to the Iran war look like for markets?
How different does the world look through the market’s lens after the conclusion of the Iran war?
There could be an inflation impulse from the increase in energy prices, however, so long as there is stability central banks will likely be able to look through this. There could also be a hit to economic growth, particularly in countries more vulnerable to oil supply shocks like emerging nations in Asia. This too could be short-lived, particularly if no critical oil infrastructure is damaged.
Markets will still have to contend with lingering headwinds: AI disruption, private credit concerns (risks in the market for loans made by non-bank lenders), US unemployment and Australian inflation. And the November midterms add a structural source of volatility. But there is a strong argument that markets could transition back to the early year playbook, with the exposures hit hardest by the conflict rebounding the most. There may be even more pressure on the US dollar and strategic buying of gold following further alienation of the US administration from allies and enemies alike.
The Q2 US corporate season will also begin in April, which could provide positive tailwinds if earnings are resilient and AI shows increasing signs of productivity gains and a return on investment.
Whatever the resumption looks like, several major markets are now trading on price-to-earnings ratios and similar valuation measures materially lower than three months prior, with some approaching their most attractive levels in a decade. The MSCI EM, Nasdaq 100, and India’s Sensex stand out.
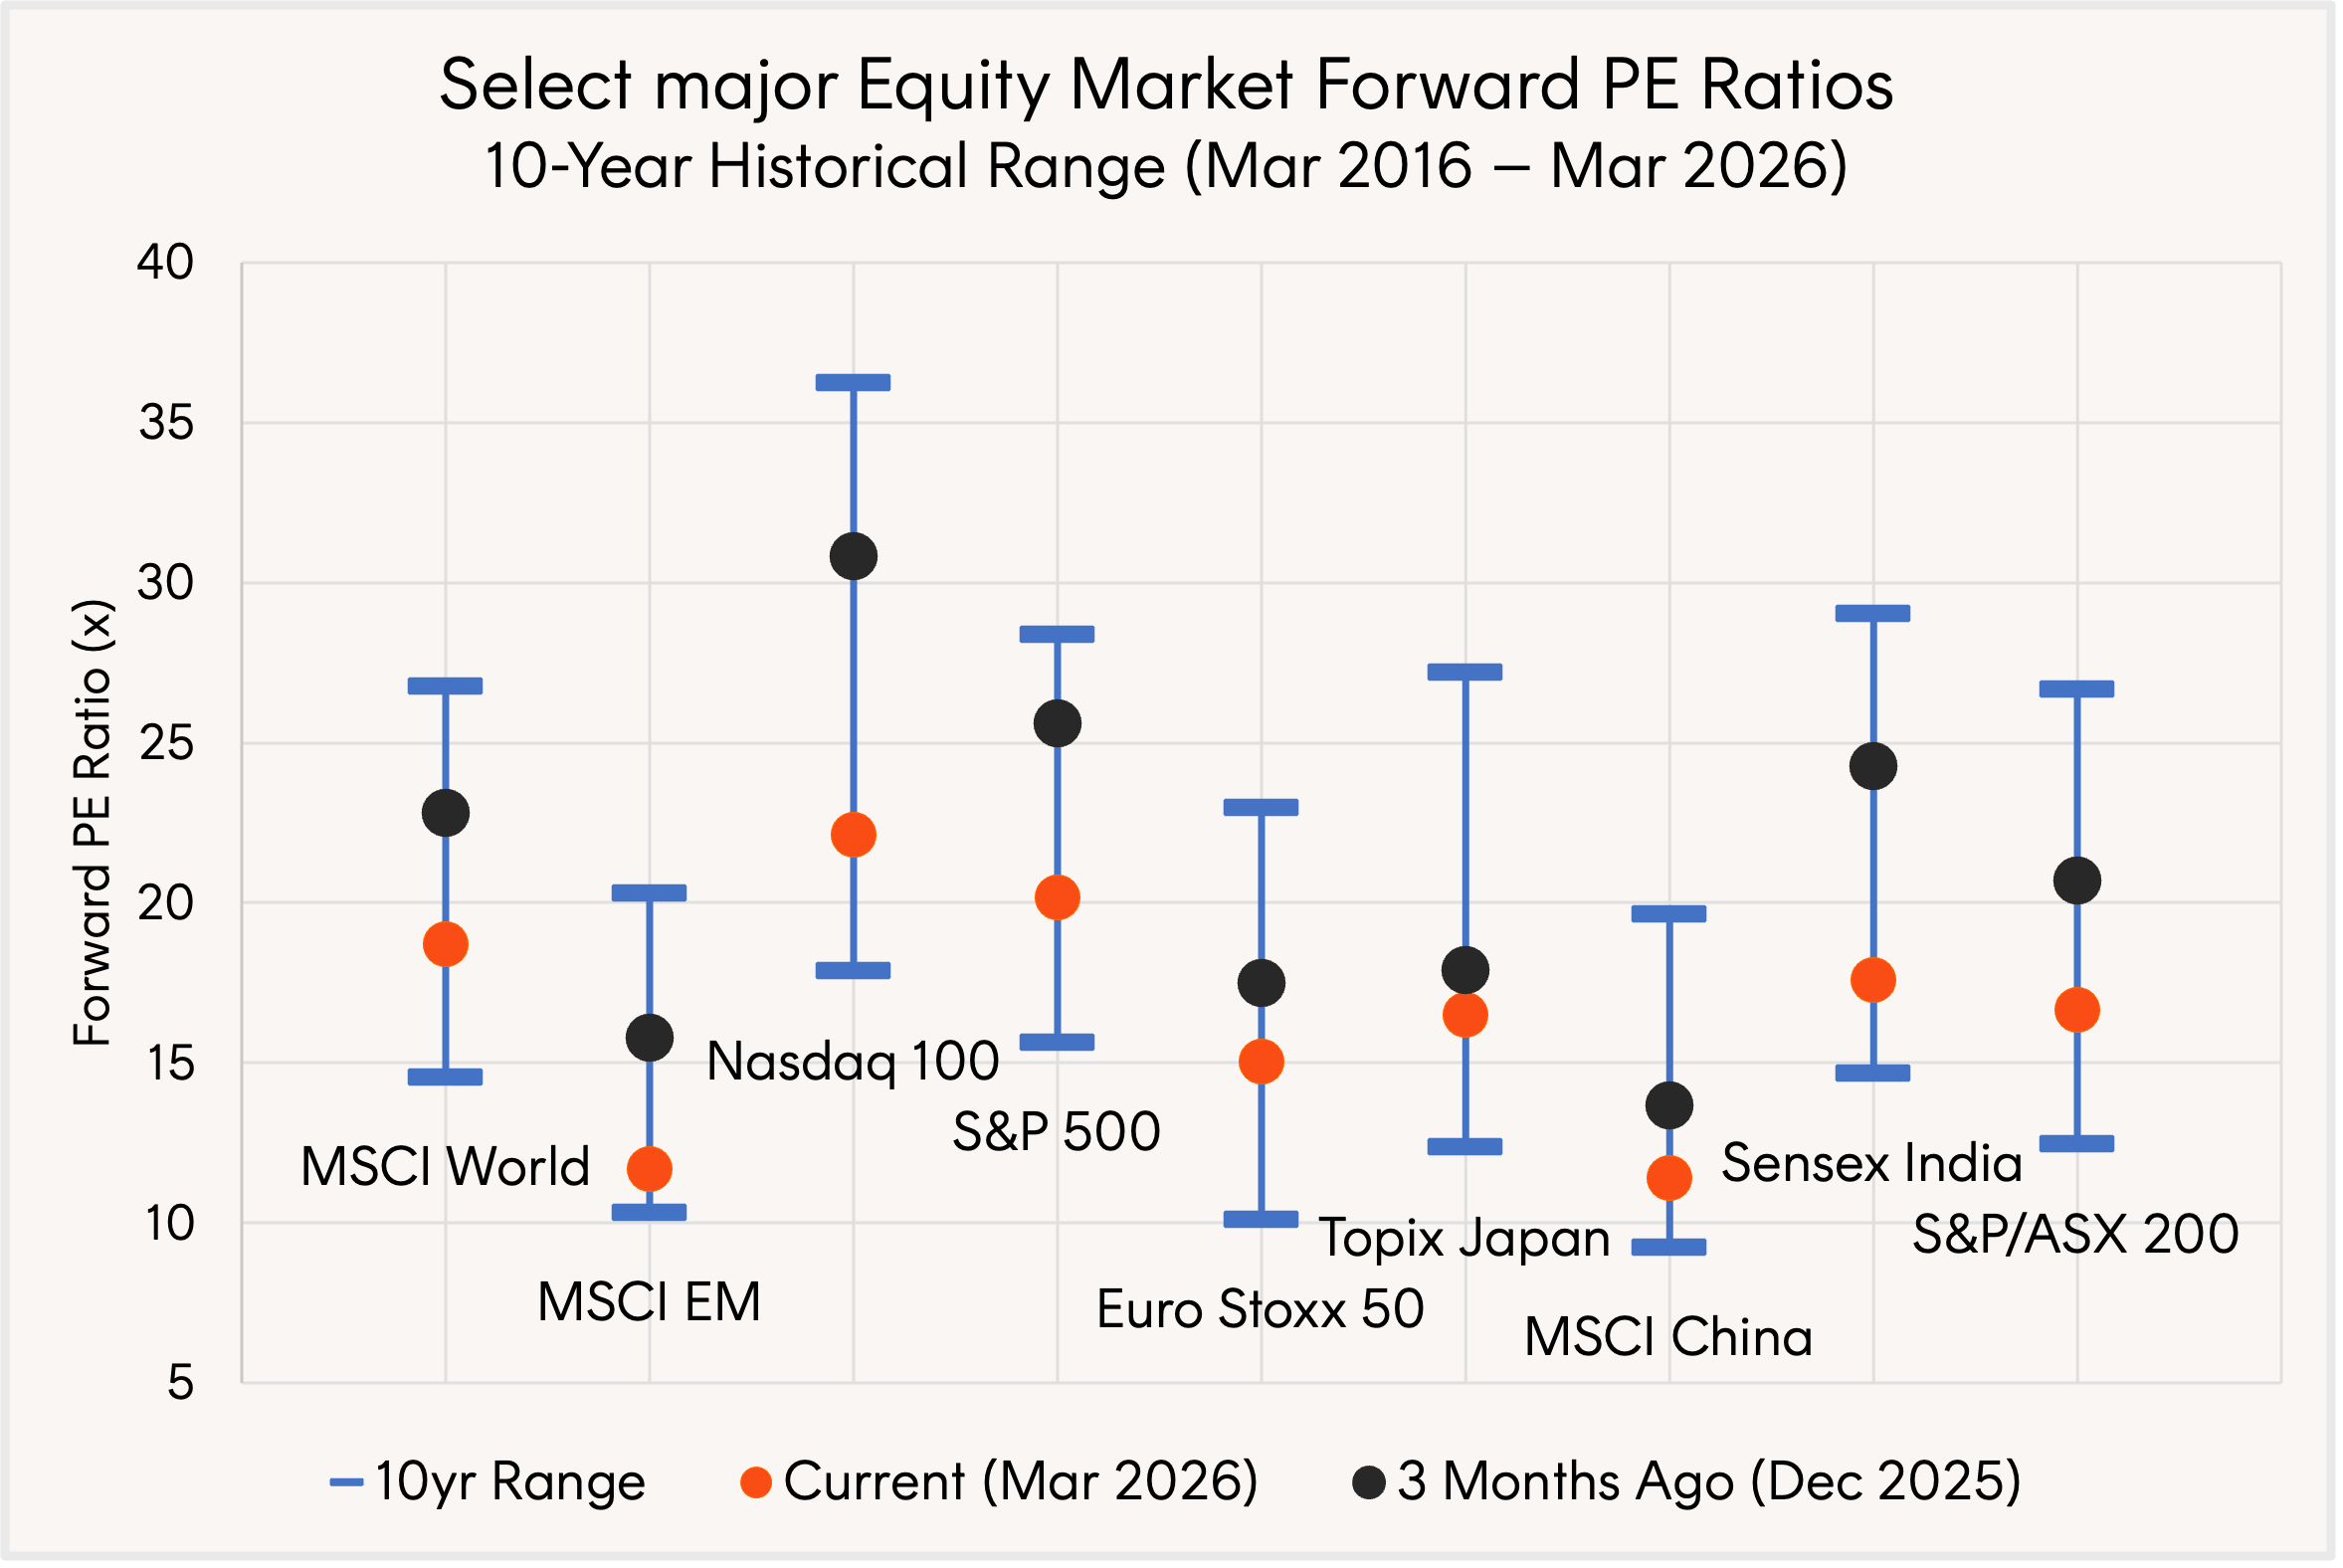
Source: Bloomberg. March 2016 to March 2026. Actual results may differ materially from forecasts.
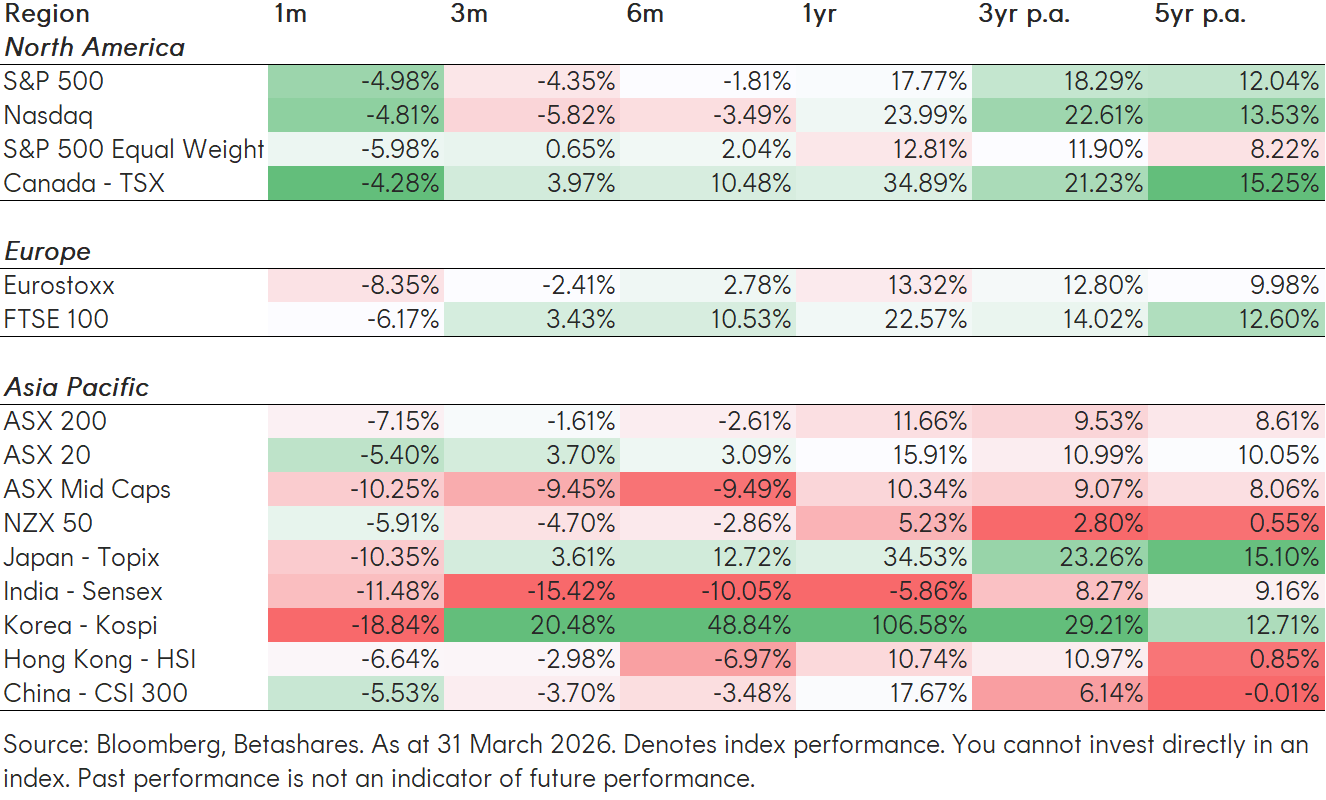
Equity market dashboards
Betashares Capital Limited (ACN 139 566 868 / AFS Licence 341181) (“Betashares”) is the issuer of this information. It is general in nature, does not take into account the particular circumstances of any investor, and is not a recommendation or offer to make any investment or to adopt any particular investment strategy. Future results are impossible to predict. Actual events or results may differ materially, positively or negatively, from those reflected or contemplated in any opinions, projections, assumptions or other forward-looking statements. Opinions and other forward-looking statements are subject to change without notice. Investing involves risk.
The article is general information only and does not take into account any person’s financial objectives, situation or needs. Investors should consider the appropriateness of the information taking into account such factors and seek financial advice. This article is provided for information purposes only and is not a recommendation to make any investment or adopt any investment strategy. Future outcomes are inherently uncertain. Actual outcomes may differ materially from those contemplated in any opinions, estimates or other forward-looking statements given in this article.
Footnotes
1. Source: Bloomberg. 29 October 2025 to 23 February 2026. Past performance is not an indicator of future performance. ↑
2. Microsoft. 29 January 2026. Q2 FY2026 Earnings Call. CFO Amy Hood: “We continue to see strong demand across workloads, customer segments, and geographic regions, and demand continues to exceed available supply.” ↑
3. Amazon. 5 February 2026. Q4 FY2025 Earnings Call. CEO Andy Jassy: demand for both core cloud workloads and AI services outstrips supply. ↑
4. Source: Anthropic. 6 April 2026. Announcement: Anthropic expands partnership with Google and Broadcom for multiple gigawatts of next-generation compute ↑
5. Source: Savings.com.au. 17 March 2026. RBA hikes cash rate to 4.10%: How CBA, NAB, Westpac and ANZ responded ↑
6. Source: Bloomberg. Based off company filings. As at 31 March 2026. ↑
7. Global defence sector as represented by the VettaFi Global Defence Leaders Index. You cannot invest directly in an index. Past performance is not an indicator of future performance. ↑